The summer dog days are upon us leaving investors cooling off in the shade waiting for a refreshing breeze of market-moving news. They are anticipating something important that will energize the gold price for an upward move, perhaps another round of quantitative easing by the U.S. Federal Reserve that could possibly be announced at the Fed's Jackson Hole, Wyoming annual gathering in late-August, or at the next meeting of the Fed's Federal Open Market Committee in September. Several U.S. economic reports released Wednesday failed to significantly impact the precious metals.
At least two heavyweight investors are not waiting on the sidelines to see what the Fed will do. Doing some bargain shopping, billionaire investors George Soros and John Paulson increased their holdings in the gold-backed exchange traded fund, SPDR Gold Trust. According to U.S. Securities and Exchange Commission filing for second-quarter, Soros Fund Management more than doubled its investment in the SPDR Gold Trust to 884,400 shares as of June 30, compared with three months earlier. Paulson & Co. increased its holdings by 26 percent to 21.8 million shares.
However, hedge funds have cut their net-long position by 66 percent from a record in August 2011. So who is the “smart money” in this case? We'll find out soon enough.
A recent Deutsche Bank outlook for precious metals suggests that the “gold will go up with QE” thesis has been around so long that it might no longer work. Recall what we wrote about information being in the price.
In a note to clients, they write:
In the latest Bloomberg survey, bulls still outnumbered bears two-to-one, and QE by the ECB and the Fed is currently held up as the next catalyst for rising prices. Indeed, evidence of falling inflation in the global economy, for instance the ebbing price pressures in China, is seen as positive for gold as it removes a barrier to easier monetary policy. So, gold bulls must be mildly frustrated at policymakers' reluctance to move so far. However, very few dwell on the reasons for this caution, namely the fear QE might do more harm than good for the economy. Mightn't it do more harm than good for gold prices too? For instance, due to the still diminished risk appetite, QE (in the way it has been conducted up to now) simply adds to the tightness in the safe-haven bond markets. Some money market investors are already facing negative yields and are being made poorer as a result of QE. It is difficult to see how this could be good for gold prices.
To see how precious metals are expected to fare in the August heat we now turn to the technical portion with the analysis of the Euro Index. We will start with the long-term chart (charts courtesy by http://stockcharts.com.)
Euro and USD Indices
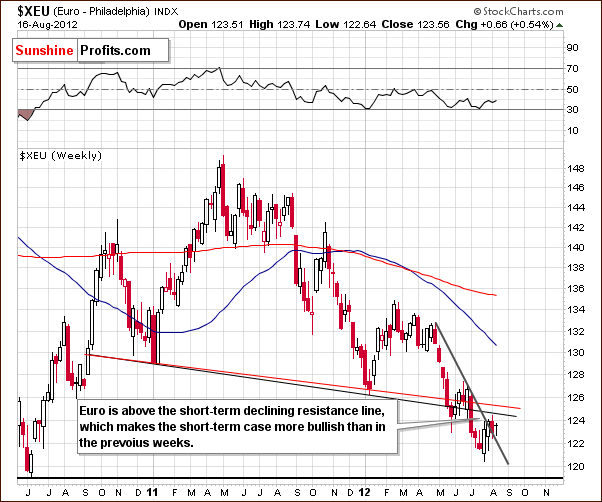
We begin this week with a look at the long-term Euro Index chart. This week we've seen a move higher which appears to have resulted in a breakout above the declining short-term resistance line. “Appears” because the week is not over yet, but unless the Euro Index declines below the 122 level, the short-term breakout will be a fact. This is not a major bullish factor medium term, but we could see further strength here in the short run.
A major medium-term resistance line is close at hand and could very well stop the recent move to the upside. Both the black and red lines in our chart could serve as resistance (the neck of the previously completed head-and-shoulders pattern).
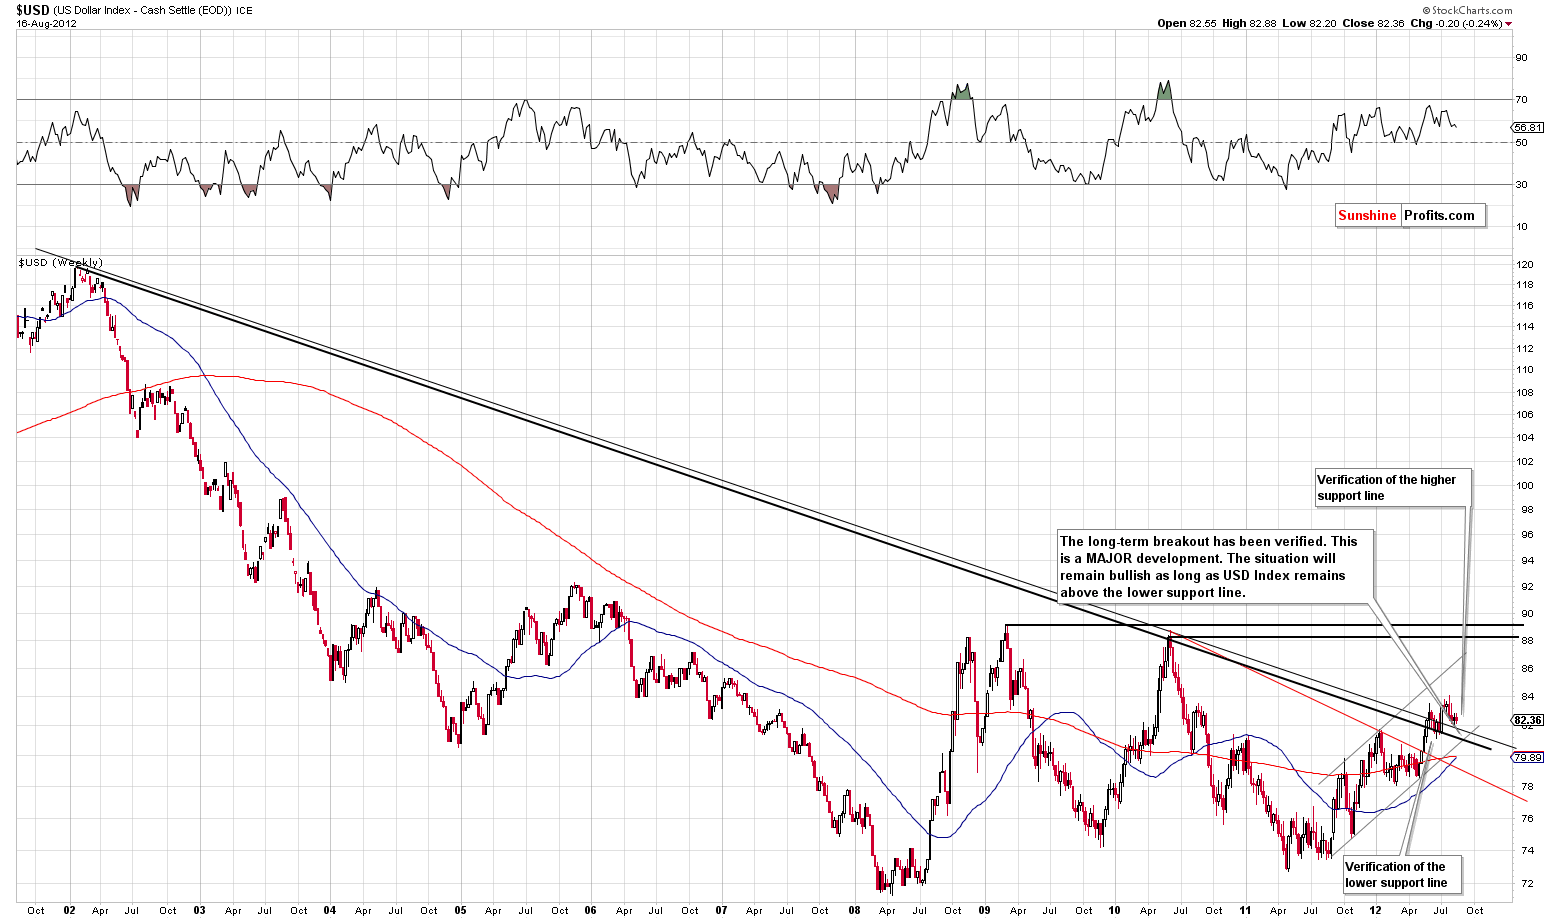
In the medium-term USD Index chart (please click the above chart to enlarge), we do not see any invalidation of the bullish trend at all. The breakout above the long-term resistance line continues to be verified, and the medium-term direction appears to be to the upside.
If the short-term rally in euro is indeed seen, then the dollar could move lower and retest one or both of its long-term support lines. Two of these lines cross at about the 81 level, and this is where any decline in the USD Index is most likely to be stopped – if it is seen at all, that is.
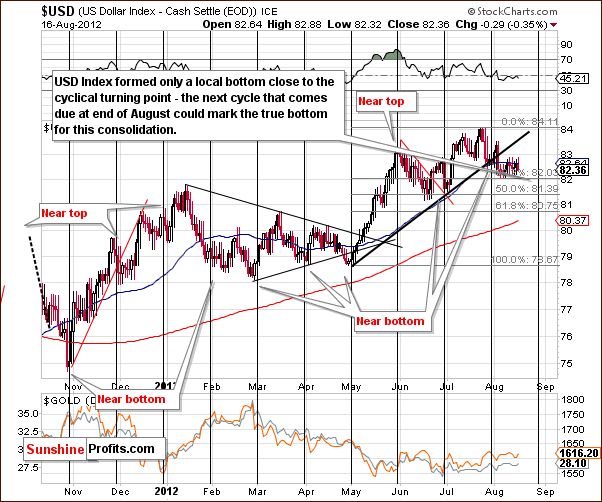
In the short-term USD Index chart this week, we could see declines to the 50% or 61.8% Fibonacci retracement levels based on the move in the Euro Index this week. Such a move would likely result in a local bottom close to the upcoming cyclical turning point. This would not at all invalidate the medium-term rally which has been seen in the USD Index recently.
Summing up, the medium-term outlook for the dollar is unchanged and remains bullish. The short-term picture has become mixed and a bit bearish based on this week's Euro Index move.
General Stock Market
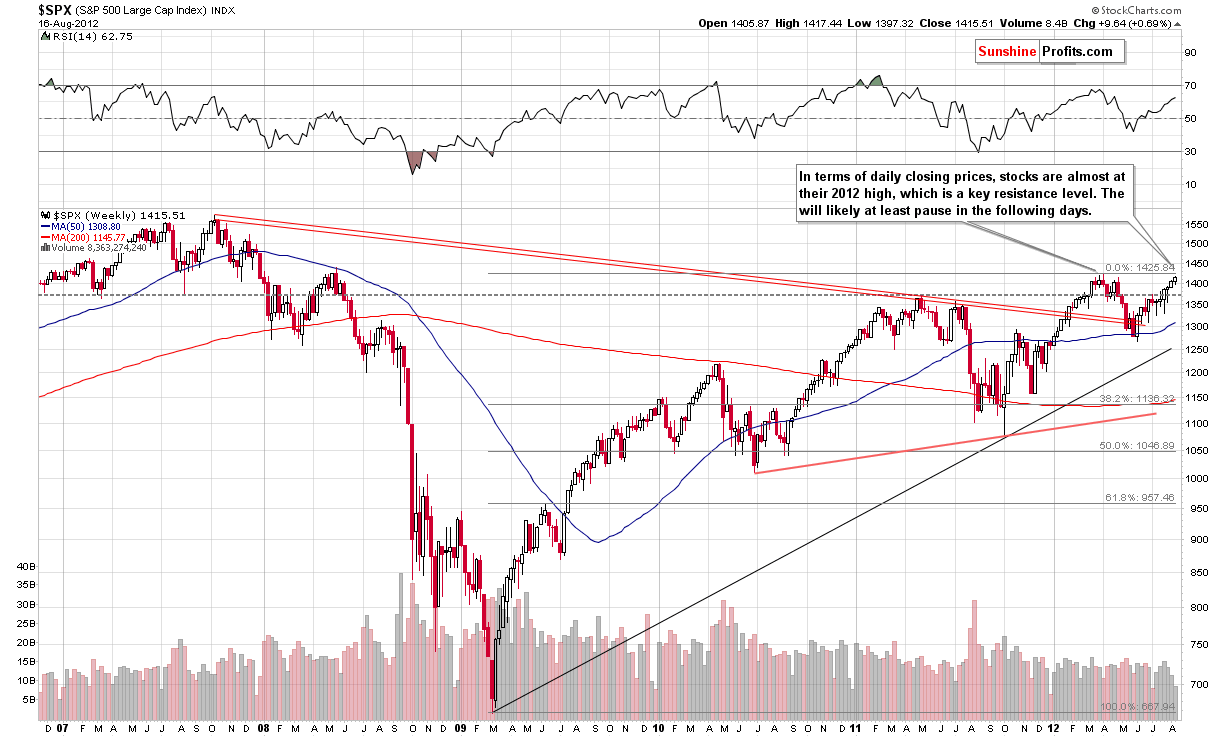
In the long-term S&P 500 Index chart (please click the above chart to enlarge), the situation has just become quite tense as stocks have moved close to the level of previous 2012 highs. This is a major resistance line, and since no meaningful correction has been seen here for several months, it appears quite likely that a period of consolidation could begin very soon. If a breakout is seen, the situation will become bullish, but that has not happened yet.
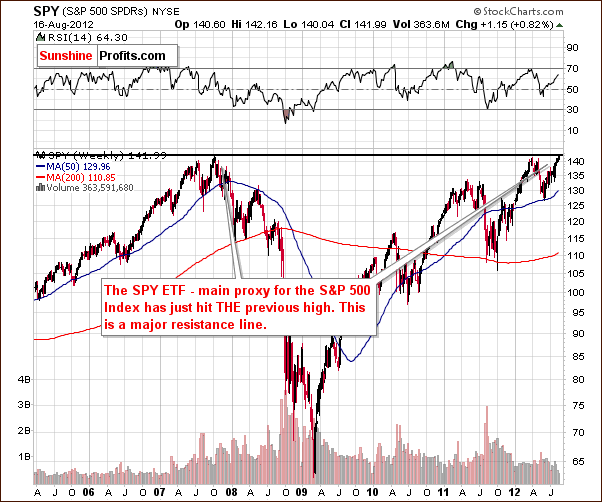
In the SPY ETF chart, we see a confirmation of the implications found in this week's long-term chart. This ETF, which is based upon the S&P 500, has reached a major resistance line which coincides with the highs of 2007. A consolidation or decline from here appears quite likely, but at the same time if a breakout is seen and verified, the rally would likely continue much higher. All in all, this chart further emphasizes the fact that stocks are at a critical level at this time.
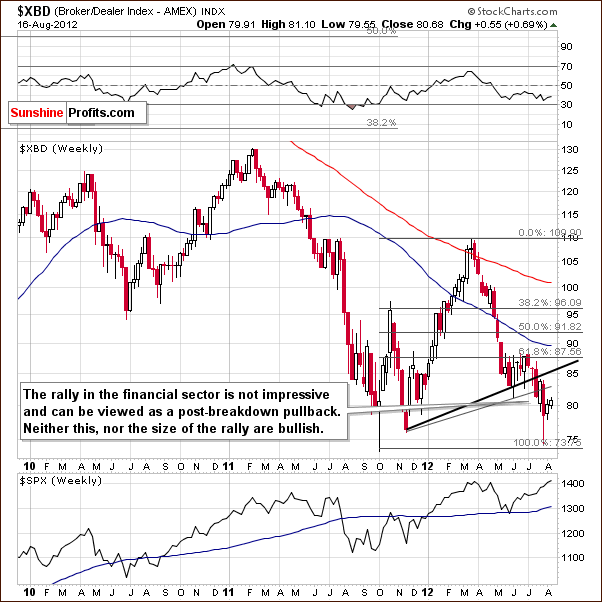
In the Broker Dealer Index chart (a proxy for the financial sector), there are once again no bullish implications whatsoever. This week's rally is barely visible, and the implications for the general stock market remain bearish.
Summing up, the situation is critical as stocks are close to an important resistance level. A move to the downside or at least a period of consolidation appears quite likely. If, however, a breakout is seen, it could mark the beginning of another significant rally. For now, it seems best to just wait and see what happens and create a more accurate trend analysis afterwards.
Crude Oil
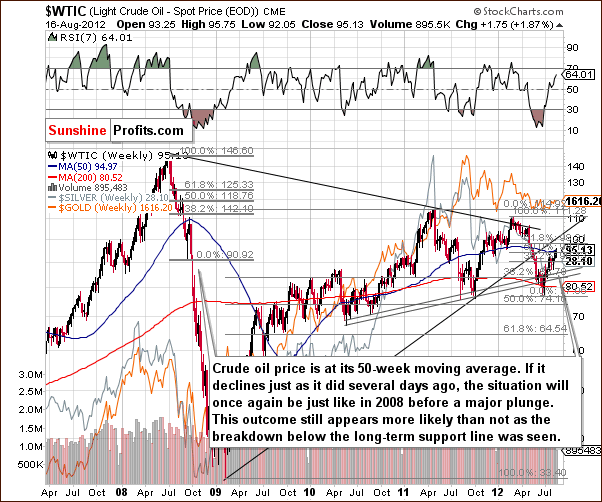
Turning to the crude oil price chart, we see that prices rallied a bit this week and are now at the 50-week moving average. This is still in tune with what was seen in 2008 and is not really a true invalidation just yet. Stocks rallied to their 2012 highs recently and crude oil is only halfway back to its high. At the same time, gold is not even close to correcting half of the decline from highs seen earlier in the year.
The situation here is not bullish even though it may seem to be based on the price action of the past few weeks. The breakdown below the long-term support line remains in place and is likely to keep downward pressure on crude oil prices for the upcoming month. Unless prices break out above the $107 key resistance level, the outlook here will remain bearish. It seems that much will depend on the situation in the general stock market and whether it manages to break above the key resistance level that it just encountered.
Precious Metals Correlations
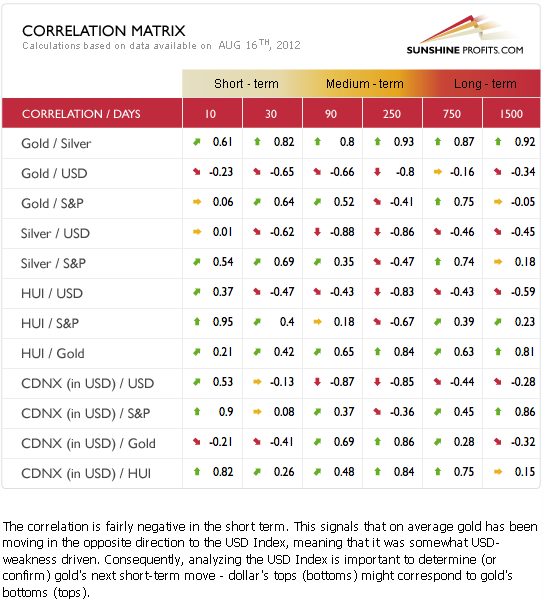
The Correlation Matrix is a tool which we have developed to analyze the impact of the currency markets and the general stock market upon the precious metals sector. The traditional correlations are in place at this time, meaning that gold and precious metals are negatively correlated with the USD Index and positively correlated with the general stock market.
Consequently, the change in the short-term situation on the USD Index makes the short-term case for metals a bit more bullish than not. The influence remains negative in the medium term, though. As far as stocks are concerned, the critical situation doesn't have any direct impact on the precious metals as it unclear whether stocks will manage to break out above their previous highs.
Gold
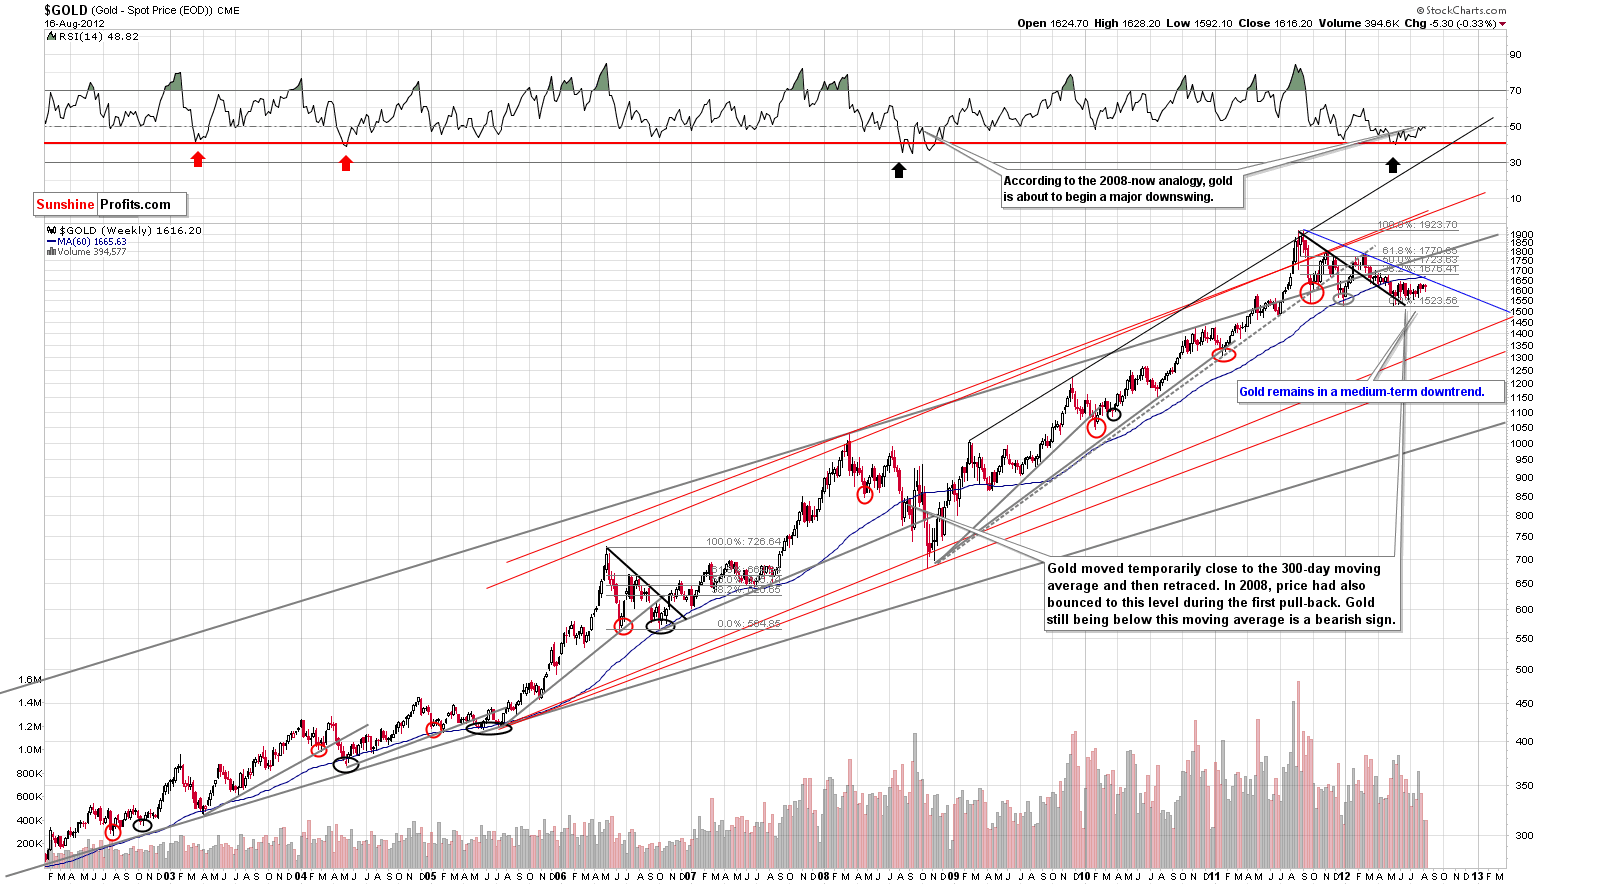
In the long-term gold chart (please click the above chart to enlarge), there were no changes this week, so what we stated in last week's Premium Update remains up-to-date and accurate:
The RSI still resembles the patterns seen in 2008 just before a period of continuing price declines in gold. The declining resistance line based on previous highs of August-September, 2011 and February-March, 2012 is only about 2% above Thursday's closing price. The closest support line, however, is a full 6% below the current price level,
Whether a small move higher will be seen before the decline continues is a different matter, though.
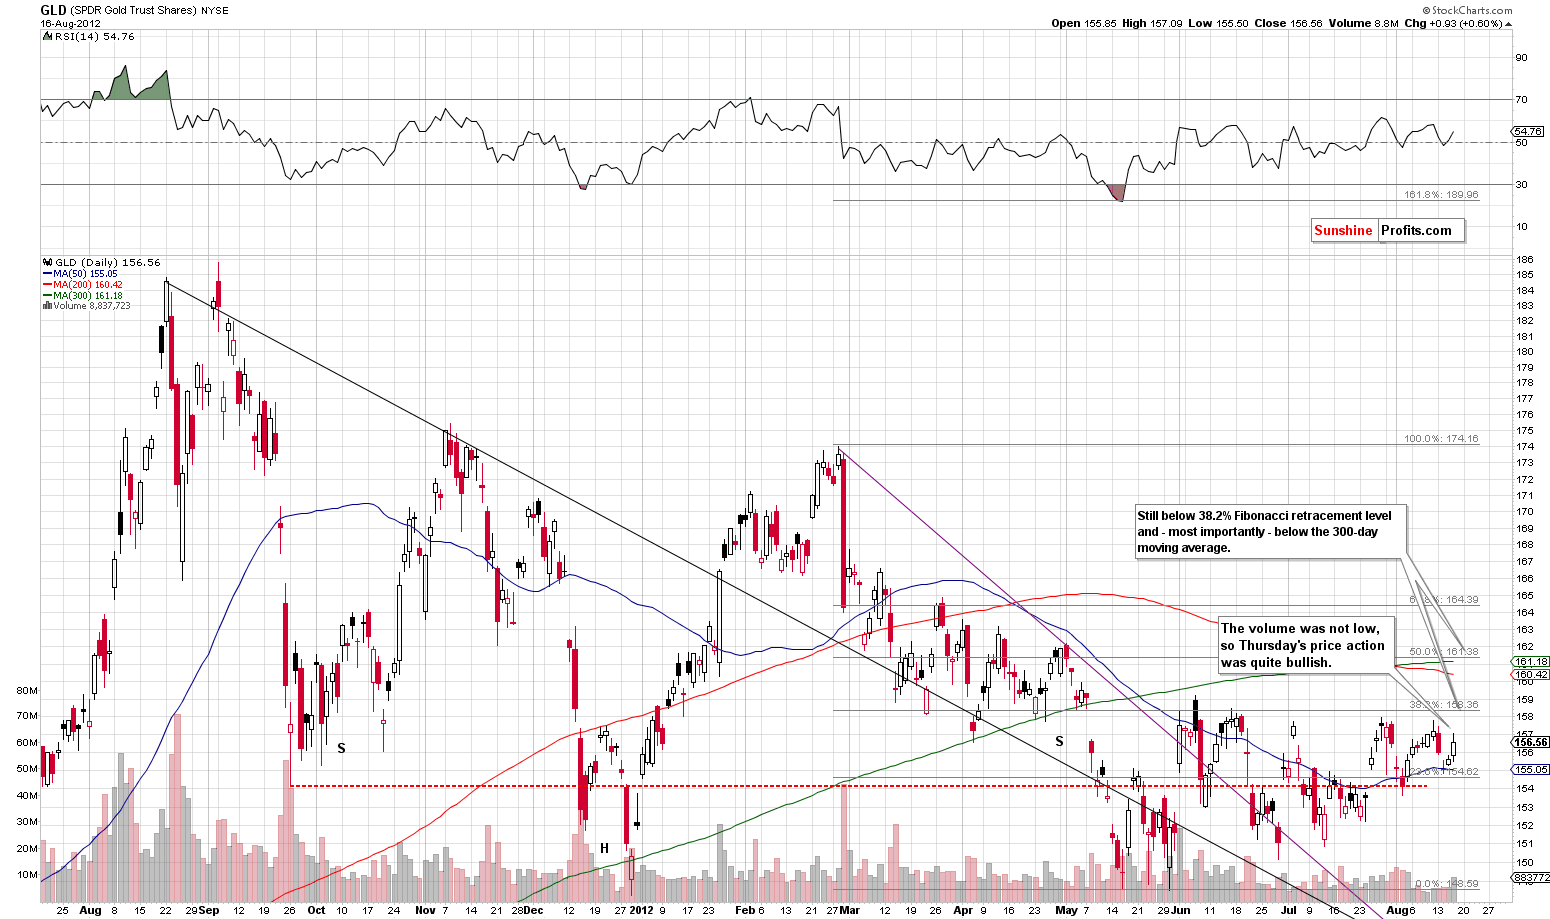
In gold's short-term GLD ETF chart (please click the above chart to enlarge), we have one interesting development this week. In Thursday's session, gold rallied and volume levels were significant. This is gold's only bullish signal of the week, and the implications are very short term in nature. It could be a sign of strength, however, since it was seen after several days of sideways trading.
Prices are still below the previous local tops, so the medium-term outlook remains unchanged. The very short-term picture has improved slightly because of Thursday's rally.
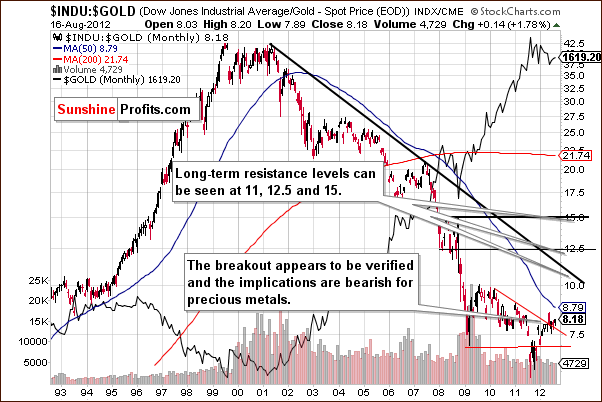
In the Dow to gold ratio chart, no change is seen this week and the breakout continues to be verified. The negative pressure here (of medium-term nature) on gold prices remains in place.
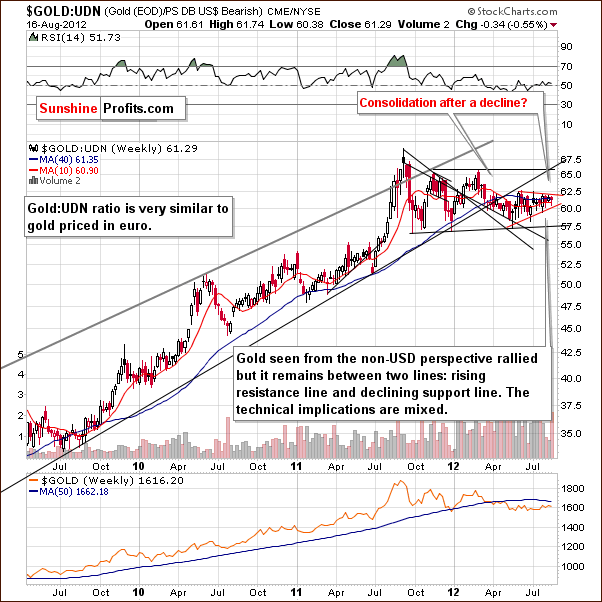
From the non-USD perspective, we see no significant changes this week. The consolidation continues and since the previous medium-term move was to the downside, the picture is not really bullish.
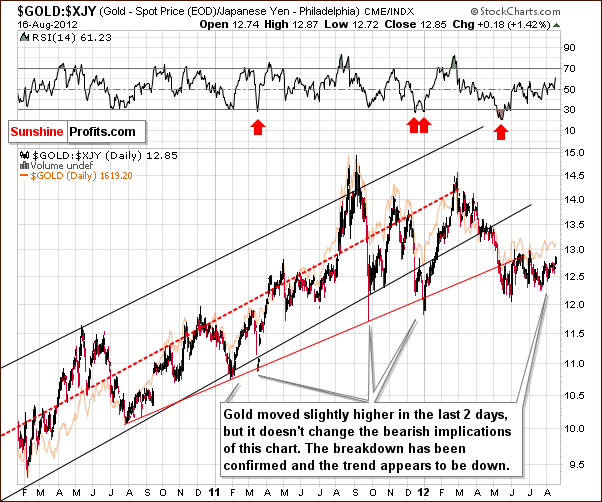
In this week's chart of gold from the Japanese yen perspective, we see a small move to the upside this week, but the confirmed breakdown is still in place. A continuation of declining prices appears to be in the cards – in the medium term; this chart doesn't currently provide us with much insight into short-term price swings.
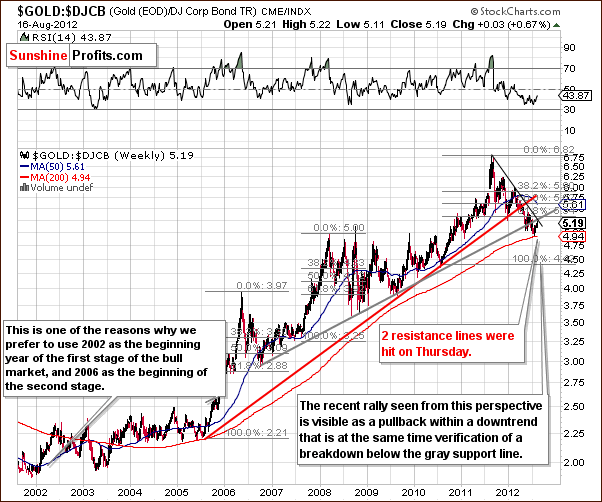
In the gold to bonds ratio chart, we have an interesting phenomenon. The ratio has moved to the intersection of two resistance lines and is just below the 61.8% Fibonacci retracement level as well. This could correspond to a local top in gold right now and caution for one's long positions appears well advised today.
Summing up, the medium-term outlook for gold has not improved just as the trends in the USD Index did not deteriorate. However, the very short-term situation is not really all that bearish this week.
Silver
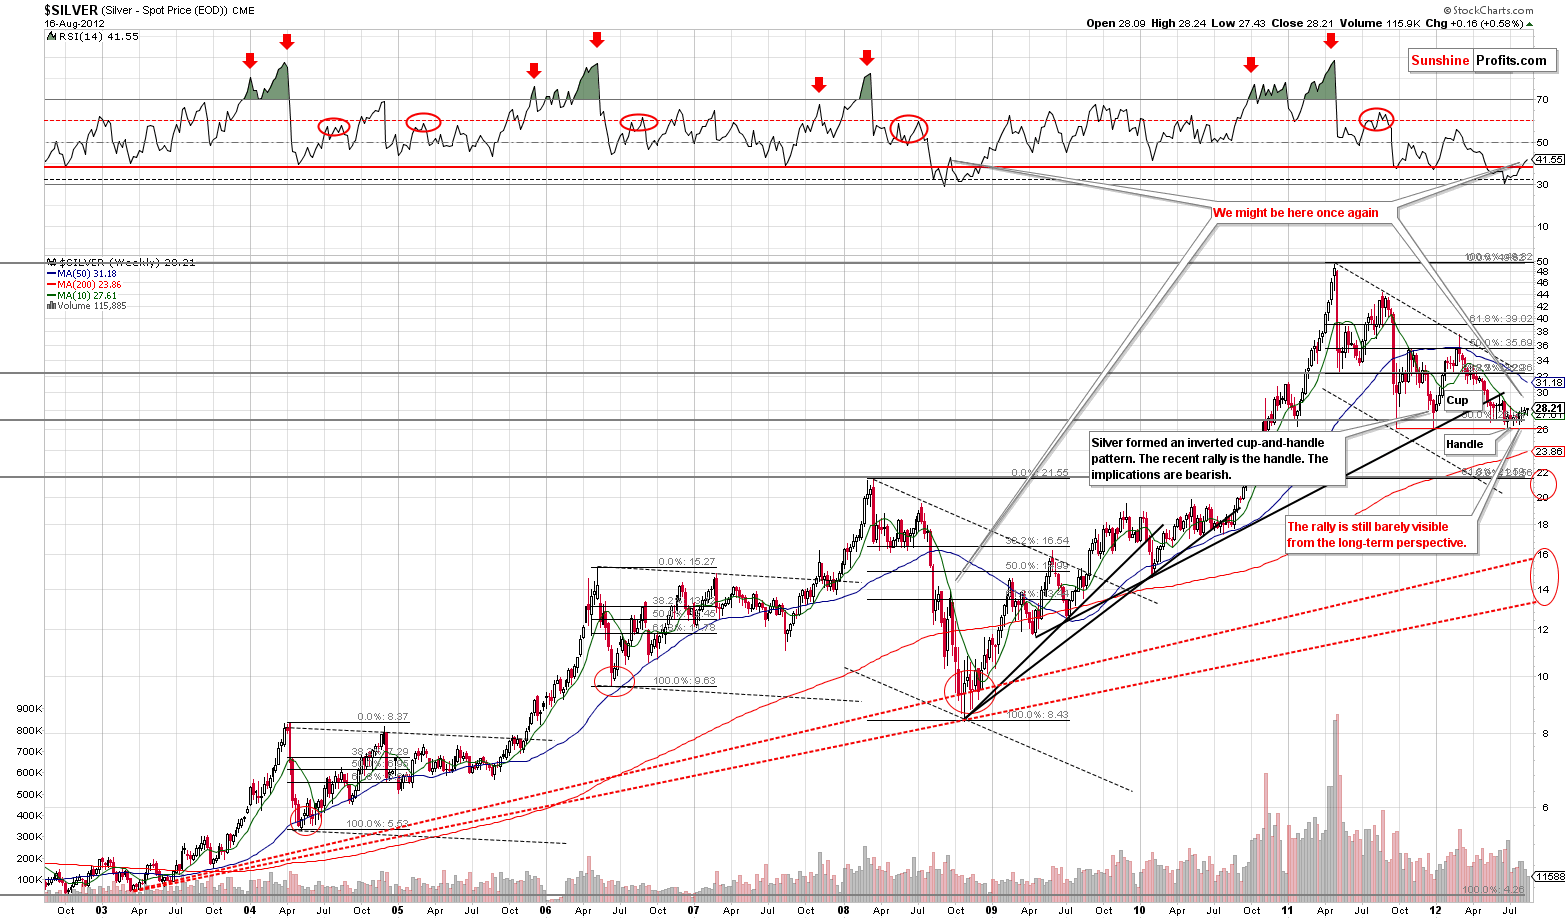
In the very long-term chart for silver (please click the above chart to enlarge), no significant changes were seen this week. RSI levels remain much in tune with what was seen during the 2008 decline, and the inverted cup-and-handle pattern here is little changed from last week.
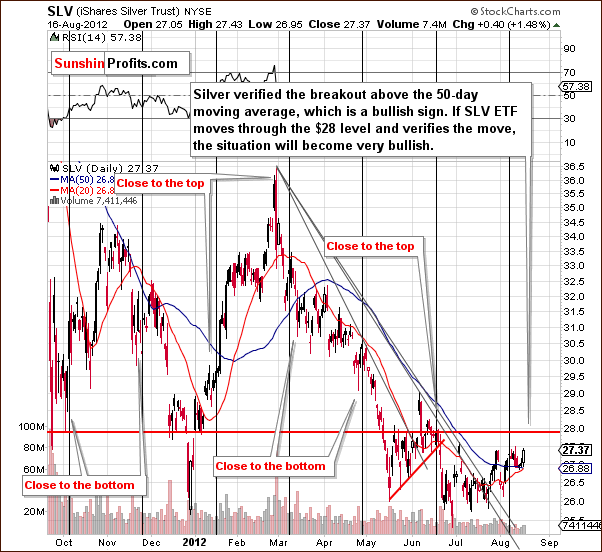
In the short-term SLV ETF chart, we see some strength in Thursday's session, but the white metal (very much like gold) is trading well below the highs seen earlier this summer. In fact, silver could be topping now like the general stock market. It could also rally further based on the short-term euro strength and USD weakness.
The bullish factor is that silver moved decisively above the 50-day moving average and this makes the above chart (and the short-term case for silver) a bit more bullish than not.
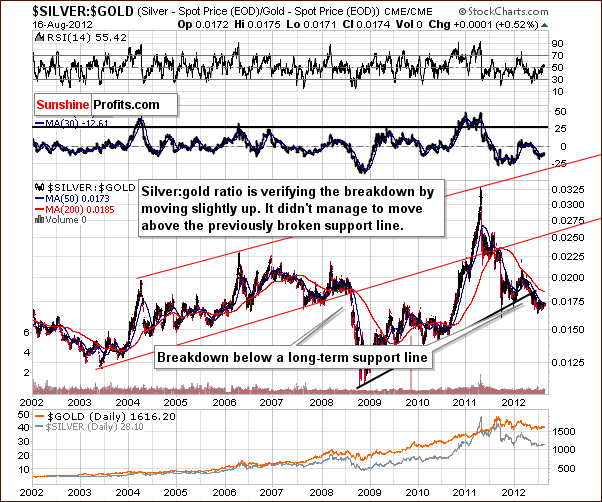
In the silver to gold ratio chart, the bearish downtrend continues. The breakdown below the support line created by previous lows continues to be verified, and the medium-term picture remains bearish here.
Summing up, the short-term outlook for silver is a bit more bullish than not at this time. There's a good chance that it will follow the path of the general stock market, which is at a major resistance line right now. Its next move is also unclear. The medium-term picture for the white metal remains bearish.
Gold Mining Stocks
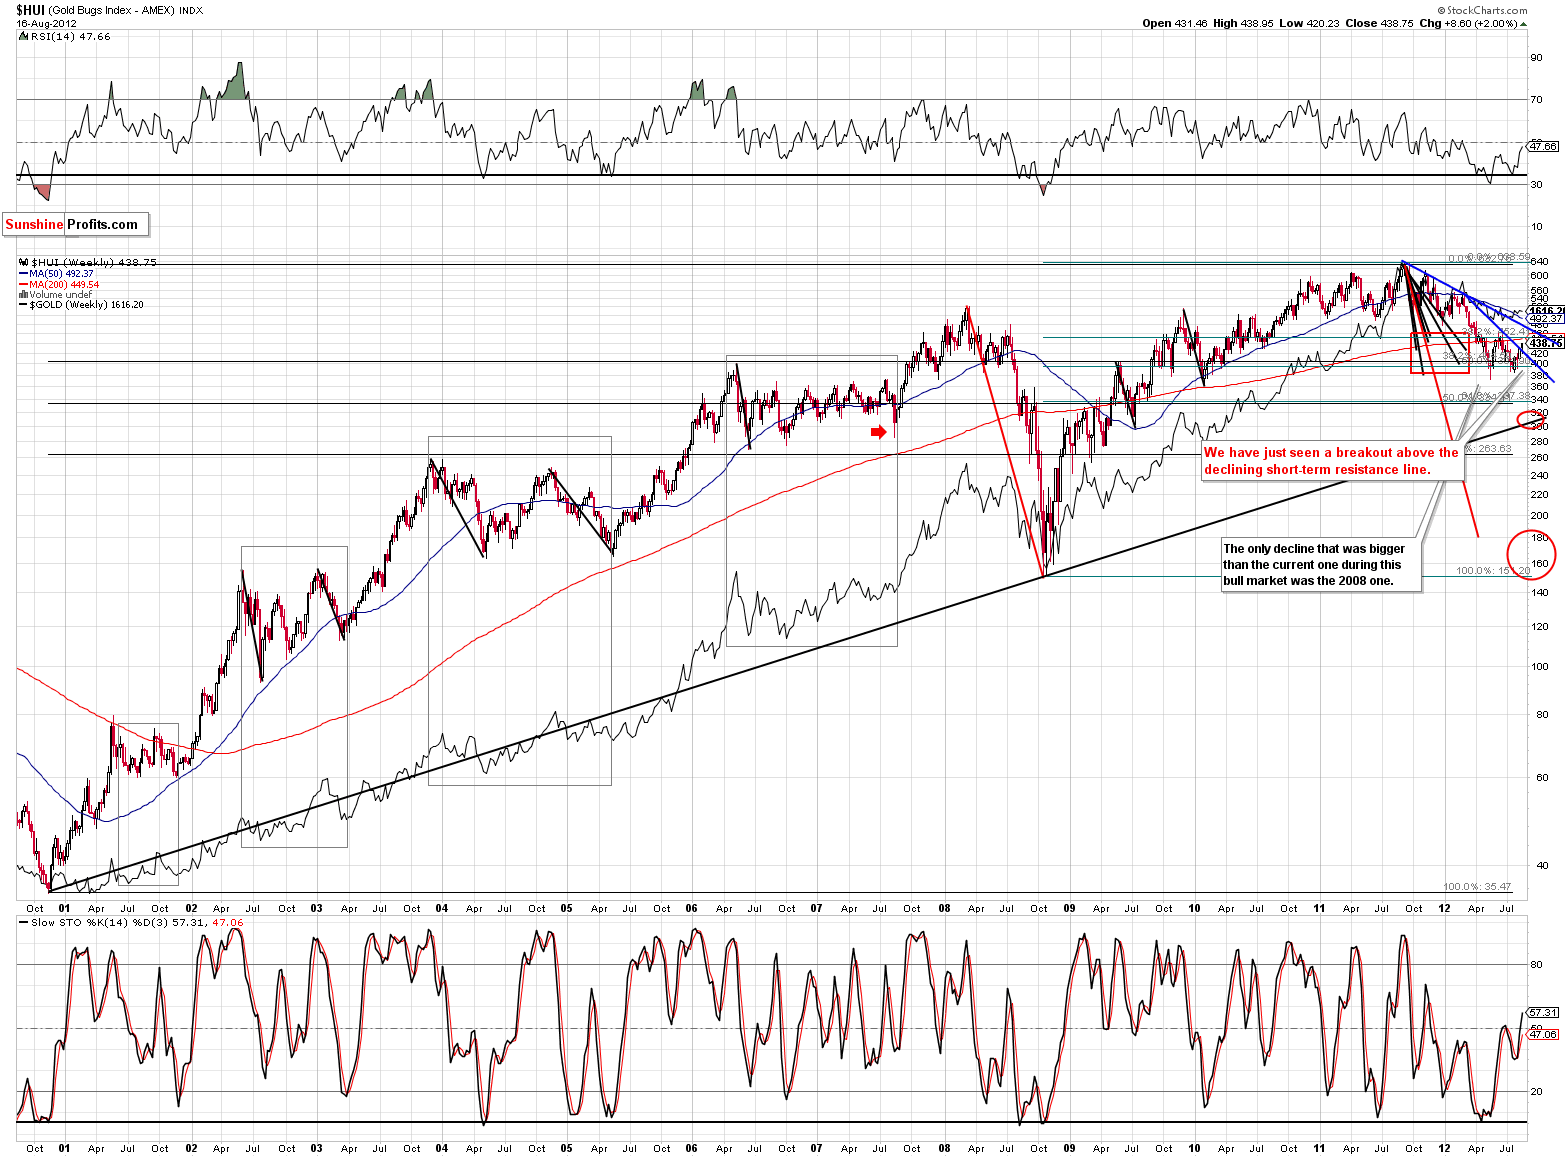
In this week's long-term HUI Index chart (please click the above chart to enlarge), we see a breakout above the short-term resistance line. The next resistance level is close to $470.
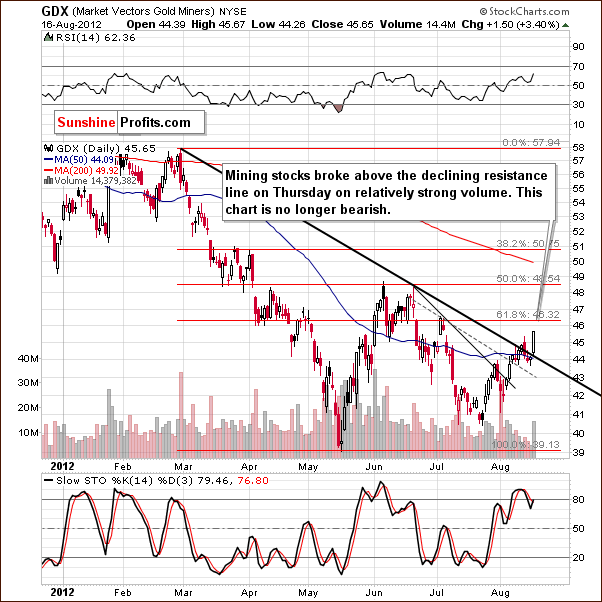
In the GDX ETF short-term chart, we see a similar situation. A breakout was seen here as well on Thursday and the volume level was relatively high. Actually, even though miners moved higher early in yesterday's session, we were waiting for the market to close, because a move back below the resistance line right before the session was over would have a very bearish implications - in fact, it would probably make us suggest increasing the short position. However, this is not what happened - miners have indeed broken out. This quite possibly suggests an important move and should not be ignored. The implications of this chart are no longer bearish as far as short term is concerned (this chart has no implications on the medium-term case).
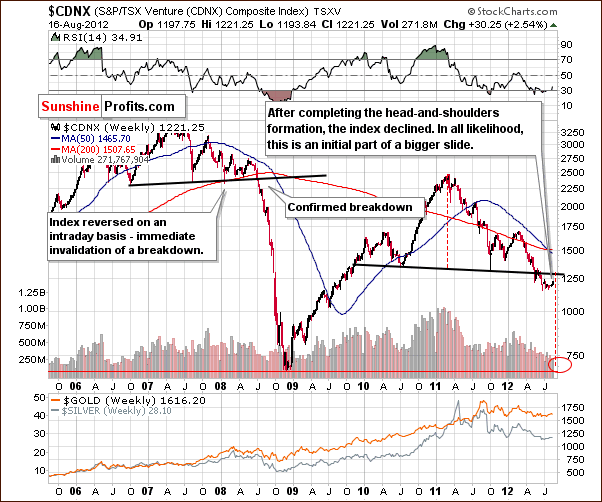
In the Toronto Stock Exchange Venture Index (which is a proxy for the junior miners as so many of them are included in it), the long-term picture did not improve. Prices are barely higher this week in spite of the rallies seen in gold, miners, and – most of all – in the general stock market.
Bigger declines appear to be in the cards here. The timing is a bit unclear but may begin in a few weeks after a period of initial sideways trading. The head-and-shoulders pattern seen over the past two years in this chart was not invalidated at all. In the short run, the outlook has actually improved due to this week's Euro Index price action and the miners' breakout on significant volume.
Summing up, it appears that short positions in the precious metals mining stocks should be closed. It simply does not seem like a good idea to keep these open as the short-term indicators point to a possible rally. Since the medium-term trend remains down (there were no indications of it being invalidated) we will most likely be able to re-enter short positions (as a bet on lower miner prices in the medium term) at higher (=better) prices.
Again, the HUI Index could rally to $470 (its next important resistance line) and then decline. Since this is quite a bit higher than today's price level, closing short positions now and reentering them at higher price levels seems to make sense. We do not suggest opening long positions at this time as the situation is too unclear for stocks and the medium-term USD Index trend is to the upside. Even though, this is not our official suggestion, day-traders may want to play Thursday's breakout but betting on higher miner values.
Letters from Subscribers
Q: I know that REE's are not typically part of your research and commentary. Could you please comment on what you think will happen with REE juniors like AVL, QRM, etc. with respect to the coming correction in miners and HUI index levels of 300 and 150, and GDX valuations of 31 and 17?
A: If the precious metals mining stocks decline and the breakdown in the TSX Venture Index results in a big move lower, as we expect, the REE juniors will likely be strongly hit as well. They could see some short-term strength, though, based on Thursday's breakout in the mining stocks.
Q: Please clarify this:
"This line is more important than the short-term one,as the declines that we expect to see are of medium-term nature."
You are continuing to recommend that we hold short, and there is other language in the update that clearly suggests that the outlook for miners remains bearish in the short term (next week and beyond). Correct?
What concerns me is that we are almost into September when things are likely to start moving, and there are all sorts of calls (some of them by normally respected sources) for gold to reach 1900-2000 by year end or so. Do you think the latter is likely? If so, do you think there is 'enough time' for gold to hit 1300 and then return to the 1900 level by year end? Or could this end up being the 'decline that wasn't'?
Anything you can do to speak to these timing issues? I am getting concerned continuing to hold short with the thought that in the fall gold may just continue upwards.
A: You are correct - September is traditionally a strong month for precious metals and it's only a few weeks away. However, the seasonal tendencies are to be taken into consideration when there are no other major factors that could influence the precious metals market. Right now, we have such a factor in the form of a USD Index that is above the long-term support line, which makes it very likely to move much higher. This is very likely to cause gold and other metals to decline. Until we see the USD Index move below this key support line and verify this breakdown, or we see gold rallying in a significant way (i.e. for more than a few days) along with the USD Index, the situation will simply remain bearish in the medium term regardless of the time of the year.
Q: With hedge funds and others very negative on gold, it seems that gold and silver have had many buyers at certain levels and it is no secret that the primary suspects for those buyers are far eastern entities. Somewhat like “Hail Mary” saves on important S&P levels in the last few minutes before the market closes.
The 800 pound gorilla has been planning an active role in precious metals and all metals trading for a long time. They bought the LME (even though it's a lousy business based on returns) to control more of the metals trades, establish warehouses in China for the LME, etc. They have planned the Shanghai gold exchange for a long time and will open it at the end of August, apparently. With China it's all about becoming a major player in this area and also about saving face. It would not gain new customers, nor would it look good for the idea and their timing if leveraged investors were handed large losses right off the bat. They need new tonnage to support any physical deliveries through the exchange. A fraudulent scheme in China recently attracted $60 billion or over 1,000 tons worth of gold futures (that's how much was lost!) so there is a lot of demand out there. For this reason it is highly unlikely the Chinese will allow gold to crash, or (perhaps) in the event of a major world market crash, to perform much worse than other investments. Something like the 'Chinese put' under the price of gold.
Perhaps a fast trip to $1480 or even $1430, and silver to $24. Western vaults would be emptied pretty quickly at those bargain levels. This is not technical, but fundamental. At what gold, HUI or silver level would you switch to a bullish bias?
A: We agree that this positive fundamental factor could put upward pressure on gold prices going forward. However, the short-term action doesn't have to be bullish. Please recall what happened to the price of silver after the SLV ETF was launched (definitely a positive factor for silver's long-term performance) - silver plunged. It rallied based on it being formed (rumor) and when it became a fact, prices tumbled.
We don't think that China would lose face if gold didn't rally immediately after the launch of the exchange. It is quite easy for any official to say that prices are unpredictable and that the launch of the exchange was a success based on some turnover measure. Moreover, we have heard (unconfirmed) rumors that China might want to try driving commodity prices lower just to acquire more of them for future growth. This suggests that the launch of the new exchange might not be bullish for gold at all. We do believe that opening yet another exchange for gold will be positive in the long run.
If a fast move to $1,430 is possible, then perhaps a move to $1,300 is not that unlikely either. We believe that fundamentals don't really provide target levels - they explain what will likely happen in the long run.
[Editor's note: we replied to this question before prices closed on Thursday, so the part about closing speculative short positions is no longer relevant as we just suggested closing them, but we will leave the following part of the reply as it originally was in order to make you more familiar with our approach]
We don't have a precise gold, silver or HUI Index stop loss in mind, because the situation depends mainly on the USD Index. If USD declines and verifies the breakdown below the 81 level, we will probably get back on the long side of the precious metals market even before any significant rally is seen in gold, silver or mining stocks.
If you insist on us providing such price levels for metals, then we would get back on the long side of the market if gold moved above $1,700, silver was above $31 and HUI above 500. Again, we would very likely see a breakdown in the USD Index first if a rally, not a decline, took place in the precious metals sector next. Paying attention to USD would allow us to get back on the long side of the market before even half of the rally to these levels would be seen. So, we have a backup plan ready.
Summary
The situation in the USD Index remains bullish for the medium term. There has been a change, however, for the short term which is now described as mixed at best. Further short-term weakness ignited by the breakout in euro could be seen before the rally continues. In that case, we still expect the 81 level in the USD Index to hold. Please keep in mind that just because we take into account the possibility of another short-term decline in the USD Index, the medium-term rally is not becoming less likely – the targets didn't change either and remain at 88 – 89.
The situation for the general stock market is unclear as stocks are at a crossroads and a critical point in time. It's unknown which way the situation will evolve, but the odds slightly favor a decline with stock prices now at a very strong resistance line and without having seen any serious correction for some time now.
The impact of both the USD Index and the general stock market on the precious metals is mixed overall in case of the short-term picture, and bearish in the medium term. Combined with the bearish medium-term situation and the bit more bullish than not short-term picture, it seems that being out of the precious metals with most of one's long-term capital is a good idea. We don't suggest any open speculative positions at this point.
We will wait for additional signals and suggest another trade idea when the signals emerge. Actually, there could be another Market Alert as soon as today if the stock market and the miners continue to show strength or if the breakdown in the miners is invalidated (in this case we would suggest getting back on the short side of the market with one's speculative capital immediately). Target levels remain unchanged from the past few weeks: $1,350 and $1,200 for gold, $21 and $15 for silver, and 300 and 160 for the HUI Index. The latter corresponds approximately to $31 and $17 for the GDX ETF. We view the probability for a move in gold below $1,500 (that would correspond to major declines in silver and miners) at 70%.
Thank you for using the Premium Service. Have a profitable week and a great weekend!
This completes this week's Premium Update. Our next Premium Update is scheduled for Friday, August 24, 2012; however we will continue to send out Market Alerts as soon as required.
Przemyslaw Radomski


