
Rising optimism that European leaders will take action to keep the euro zone together is the factor that supported gold prices last week, up 2.5 percent, gold's longest winning streak since June. Gold in the past few months has moved largely in tandem with the euro and riskier assets with investors piling into supposedly “safer” assets, such as the dollar, yen and U.S. Treasuries.
What about this week? Policy makers at the world's most powerful central banks will be meeting. Markets will be looking at today's Federal Open Market Committee (FOMC) where a recent round of soft data has fueled expectations of additional easing measures. Thursday, the European Central Bank (ECB) might make some decisions which could see the euro's recent small rise against the dollar continue, or else, peter out. In addition, on Friday, the U.S. Department of Labor will release its July report on the employment situation.
As we wrote in the Market Alert that we sent on Monday, we believe that the prospect of bond buying by the ECB is already factored into the price of all assets. When we analyzed the charts for the latest Premium Update, this was already factored in our analysis and summaries.
We wrote: It seems that investors cheered based on the announcement that everything necessary to protect the euro area will be done. However, as they realize that it will be done through monetary easing, thus decreasing the value of euro, their enthusiasm will likely fade away.
One would think that August is a quiet month with everyone at the beach or in the mountains on holiday, but we remember very well August of last year. This was when Standard & Poor downgraded the U. S. against the backdrop of the Congressional debt ceiling stalemate with an ensuing summer shakeout in global markets. Between July 27 and the end of September last year, world stock markets lost almost 20 percent. The Federal Reserve then announced that it would keep interest rates low through mid-2013 in order to help the U.S. economy. Gold, which doesn't pay dividends or interest and costs money to store, becomes more attractive when interest rates are low. Last August people ran around in London rioting, burning and looting. This year, viva la difference, athletes are running races in the Olympic Games. (As David Letterman joked in his late night show, “The opening ceremonies featured the parade of athletes from 107 bankrupt nations.”)
This year the triggers may be different but the background story is the same; a euro zone crisis that has deepened over the year, cutback in bank lending, ballooning sovereign debts, China's slowdown and a gloomy global economy. Add to that the drought that has catapulted wheat, corn and soybeans 20-30 percent higher year-to-date, which affects emerging economies more sensitive to food prices.
Last week's comments from Mario Draghi, president of the European Central Bank, that everything will be done to save the euro and to keep the 17-nation currency bloc intact, have left markets hopeful that the central bank will step in to help. The leaders of Germany and France threw their weight behind Draghi's pledge. First came a joint statement from Angela Merkel and France's Francois Hollande, followed by another from Merkel and Italy's Mario Monti. This was followed by the head of the eurozone's finance ministers group and the German finance minister.
The yields on Spanish and Italian debt fell last week after Draghi hinted that the ECB would buy more government bonds. Can you really call the euro a single currency when some of its members are paying near zero for funds and the rest are paying more than four or five percent? If interest rates are very low, the cost of running fiscal deficits is also very low. With real rates of interest in the US and UK close to zero, government borrowing is now just about free, in real terms – using the official data and many will claim that the real inflation numbers are higher than reported, which makes borrowing a profitable deal in real terms.
The latest U.S. government statistics published last week show that the United States economy has lost the momentum it appeared to be building earlier this year, expanding by a mere 1.5 percent annual rate in the second quarter. This makes the U.S. more vulnerable to trouble in Europe. Looming in the foreground are the expirations at the end of the year of several tax breaks and other buoyant measures, known collectively as the “fiscal cliff.”
On another subject, Congressman Ron Paul's long campaign for a full audit of the Federal Reserve has finally passed the House. The measure was approved by a bi-partisan vote sending the bill to the Senate, but the Wall Street Journal reports that there are no plans, at least at the moment, to bring up the measure in the Senate.
The Federal Reserve System was created almost hundred years ago on December 23, 1913. In the 100 years since then, the value of a dollar has collapsed to less than a 1,600th of an ounce of gold, or less than a 77th of what it was when the Fed was created.
August has just started but it looks like September will be the crucial month for the euro. This is when European leaders will return from their vacation and deal with important decisions and problems.
In September, a German court might make a ruling that could undercut the new euro zone rescue fund. Early Dutch elections in September will become a popular vote on the euro and EU imposed austerity measures. Negotiations will continue into September and will determine if Greece gets the next installment of bail-out loans, its financial lifeline, without which it will be forced to default. On top of that, the euro zone has to figure out how to help its next unstable dominoes, Spain and Italy.
To see what is in store for gold, silver and mining stocks, let's begin this week's technical part with the analysis of the Euro Index. We will start with the long-term chart (charts courtesy by http://stockcharts.com.)
Euro and USD Indices
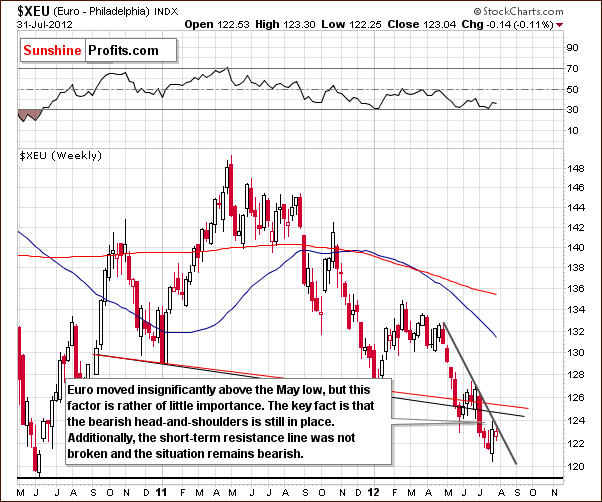
The index rallied a bit last week and this week, but this move has been stopped by the short-term declining resistance line. Prices here moved insignificantly above the May low but this really appears to be of little importance.
The Euro Index is still below the previously broken neck level of the head-and-shoulders pattern, and the outlook remains bearish. The past few days appear to have been nothing more than a contra-trend pullback, and the declining price trend remains in place here.
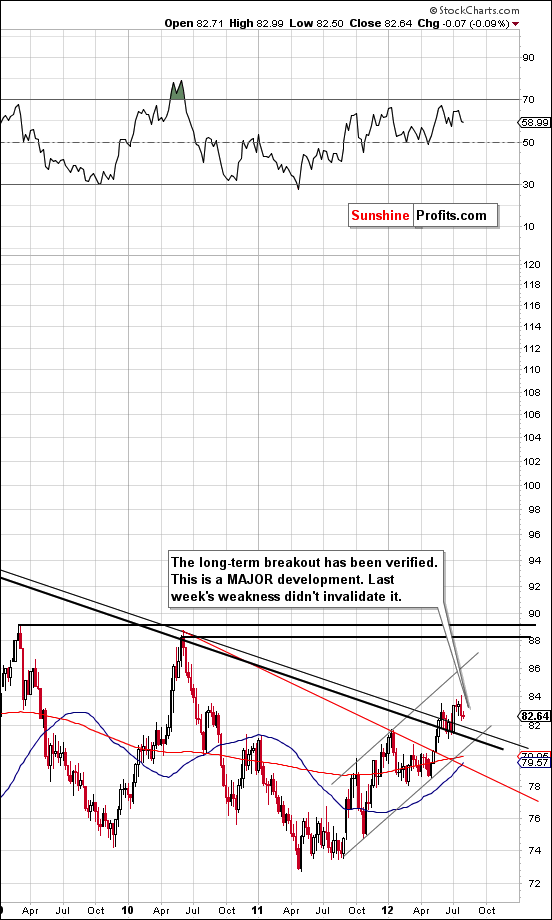
In the medium-term USD Index chart (please click the above chart to enlarge), there is no real change to speak of. The trend here remains up, and the breakout above the long-term declining resistance line has not been invalidated. In fact, it has been well verified by several weekly closes above this previous resistance level. Simply put, we expect the rally to continue here and as you will see on the next chart it may start very soon.
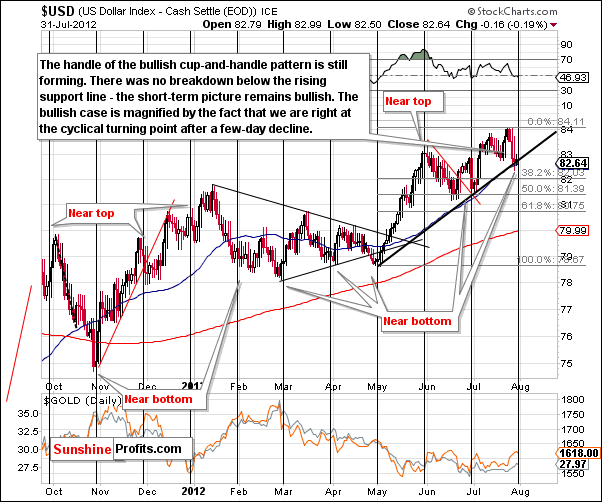
The cyclical turning point is now upon us and price levels are at the short-term support line. With declines having been seen just ahead of the cyclical turning point, the USD Index is likely to move higher from today's level.
Comments made in last week's Premium Update are still up to date: "With the most recent move being to the downside, the cyclical turning point is likely to cause a reversal to the upside. You may recall that in early July, a sharp rally was seen soon after the cyclical turning point was crossed."
The medium and short-term pictures remain bullish for the USD Index.
Summing up, the short and medium-term trends remain bearish for the euro and consequently bullish for the dollar. This combination results in bearish implications overall for the precious metals sector.
General Stock Market
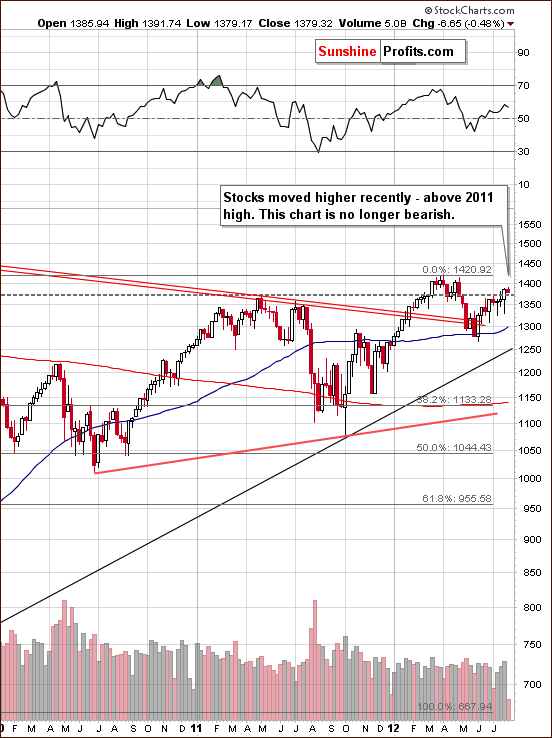
In the long-term S&P 500 Index chart (please click the above chart to enlarge), some significant strength has been seen as stock prices recently moved above the 2011 highs. This move has been verified by three consecutive closes, and the situation is therefore no longer bearish. At this time, this chart is best described as mixed as stocks are still not below their 2012 high.
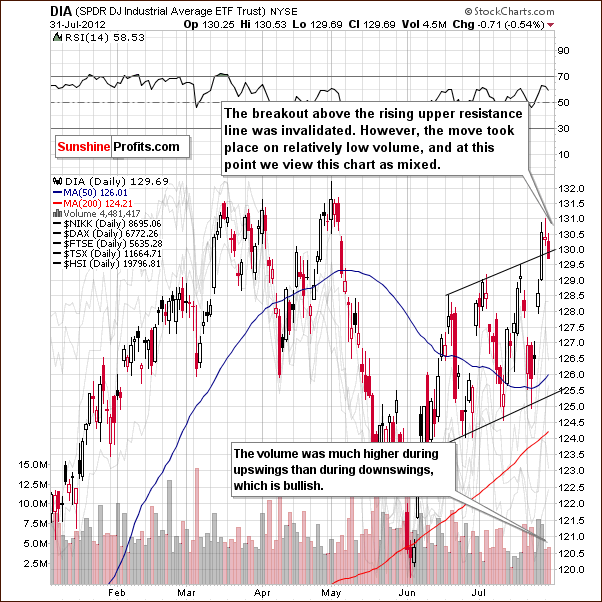
In the short-term DIA (a proxy for the Dow Jones Industrial Average), recent price action was bullish up to Tuesday's close. The previous breakout may seem to have been invalidated on Tuesday, but the move lower was quite weak as volume levels were very low. At this point, the situation is not really bearish (invalidation of breakout took place on low volume and price is close to the resistance/support line) or bullish (after all the price is below the previously broken resistance line, so we technically have an invalidation of the breakout), so we prefer to call it mixed.
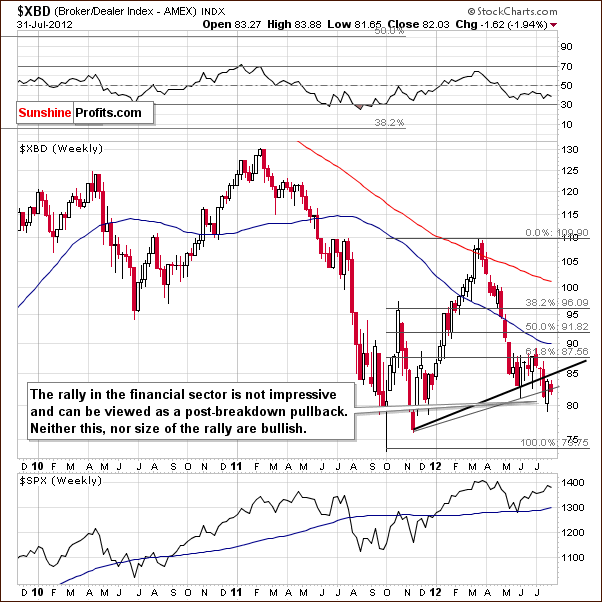
In the Broker Dealer Index chart (a proxy for the financial sector), a bearish situation is in place once again as prices have declined this week on the heels of last week's rally. The current index level is below the lowest of the support-resistance lines, and the outlook appears bearish.
Summing up, the situation in the general stock market seems to be mixed at this time with a bearish bias based upon the bearish outlook in place for the financials.
Crude Oil
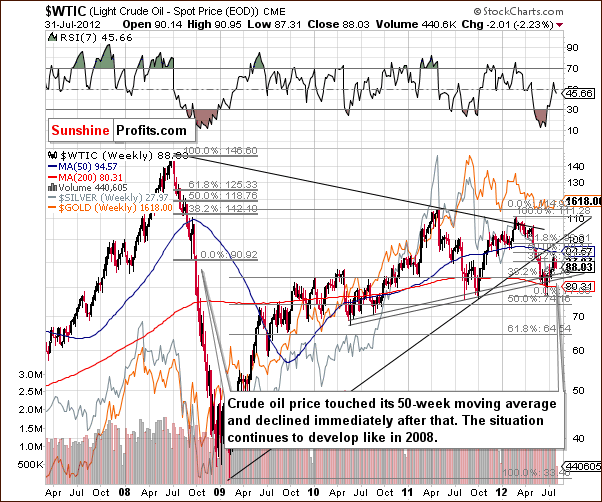
Turning to the crude oil price chart, very little change was seen in price levels since last week's Premium Update. We wrote that:
The outlook is not bullish since the resistance line …….has not been broken but we no longer view the situation as very bearish. A bit more bearish than not would be a better description today based on this chart alone.
These comments are still up to date.
Correlation Matrix
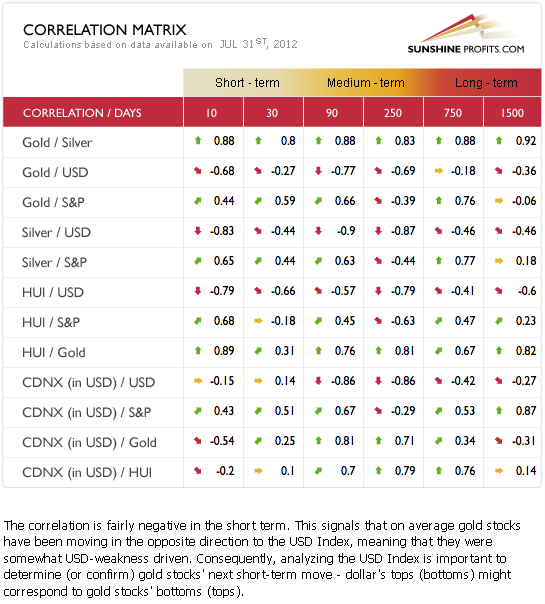
The Correlation Matrix is a tool which we have developed to analyze the impact of the currency markets and the general stock market upon the precious metals sector. The short-term coefficients between the miners and the USD Index currently have the strongest correlations (negative) of all the precious metals sectors.
Recall that in last week’s Premium Update we stated that “This bearish influence upon the mining stocks appears even greater than the USD's impact upon gold and silver... The USD Index has negative medium-term coefficients with gold, silver and the precious metals mining stocks, so it's clear that the situation in the USD Index is still having a strong negative impact here.”
These points are still up-to-date and accurate at this time.
Gold
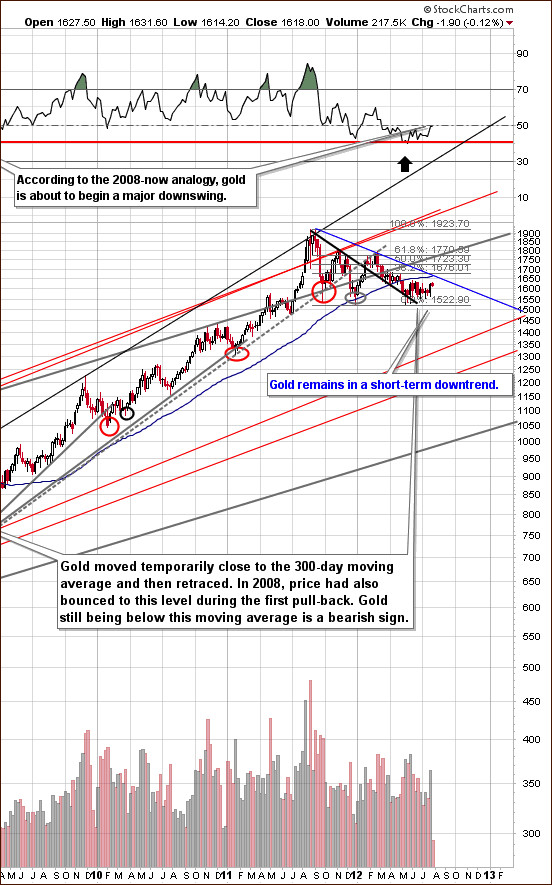
In the very long-term gold chart (please click the above chart to enlarge), we see that the recent short-term downtrend remains in place and it's important to note here that gold is visibly below the 300-day moving average. An interesting thing is seen this week in the RSI levels. The recent consolidation appears significant enough to have leveled the emotions of many market participants based on where the RSI level is now. Please note that the similar move was seen in 2008 and it was accompanied by the same overall enthusiasm among gold investors and analysts – the worst appeared to be over, but it wasn't.
The trend is likely to become more bearish once again. Gold no longer appears to be heavily oversold and we are more or less in a position similar to where gold was before its final plunge in 2008.
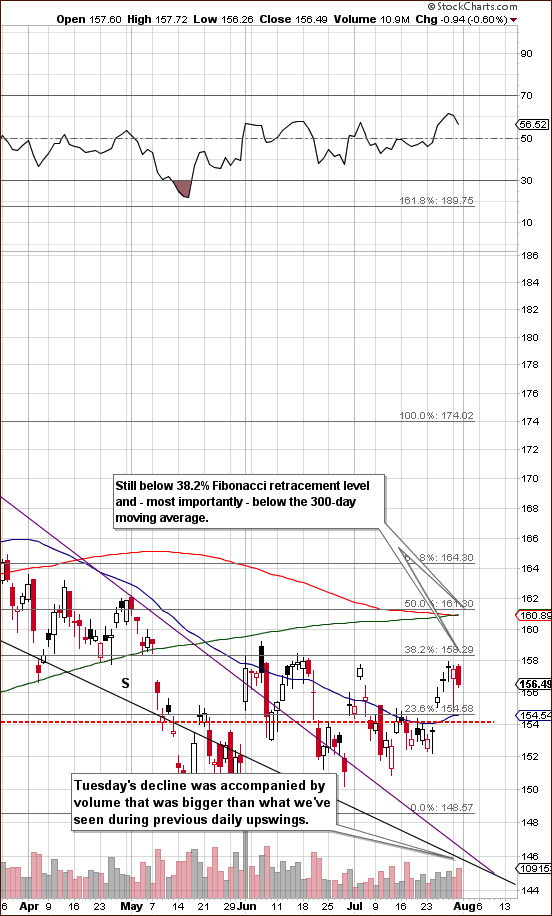
In gold's short-term chart (please click the above chart to enlarge), gold's price continues to trade below the 38.2% Fibonacci retracement level and the 300-day moving average. The consolidation does not appear to be over here at all. This bearish factor is still evident in volume levels, which have recently been higher on downswings than on moves to the upside.
A bearish reversal candlestick hammer was seen on Monday, and this is an indication that the recent rally may already been over. In any case, the outlook certainly appears less bullish today than it did at last Thursday's market close, when we wrote our last Premium Update. Furthermore, these gold charts alone are not the only bearish indicators at this time.
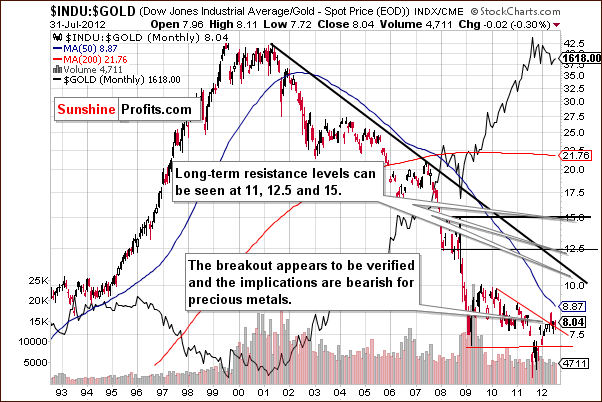
In the Dow to gold ratio chart, the ratio appears to have broken above the declining resistance line. This is a bearish sign for gold relative to stocks as it indicates that stocks will outperform the yellow metal.
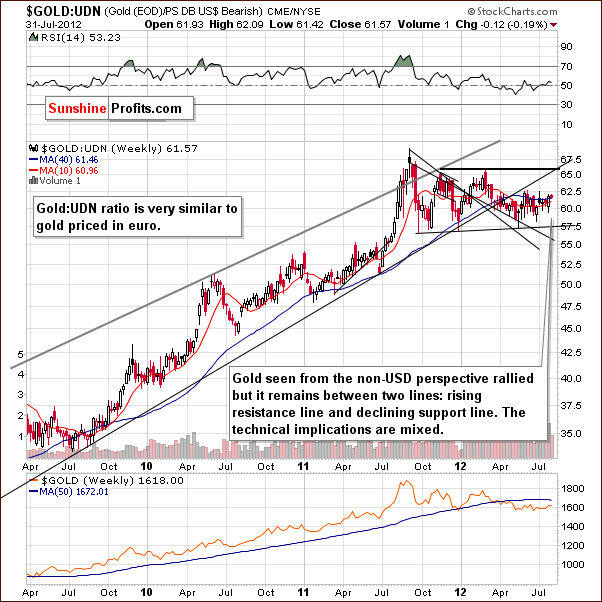
In this week's chart of gold from a non-USD perspective, the situation appears to be pretty much mixed. Little has changed recently as the index level has pretty much moved sideways within a narrow price range for the past several months.
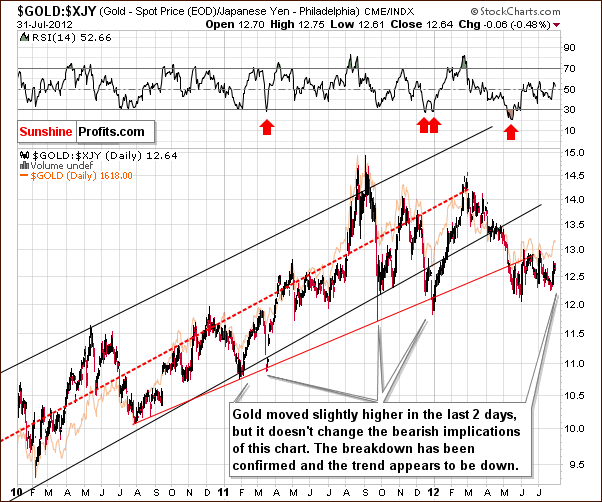
In this week's chart of gold from the Japanese yen perspective, we see that last week's rally appears undoubtedly to be a part of the post breakdown consolidation and does not imply any real bullish move whatsoever. The bearish implications remain in place here.
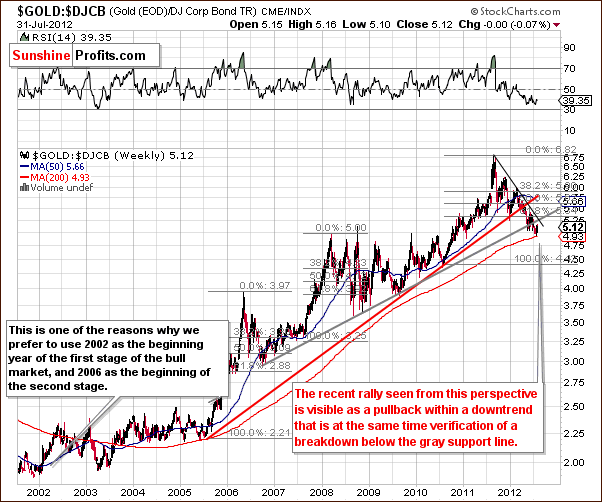
In the gold to bonds ratio chart, it's clear that the breakdown is in and verified as we have seen multiple closes below the rising gray line. The short-term trend remains down and with the breakdown in the situation is clearly bearish for gold.
Summing up, the situation for gold remains bearish this week, much in line with our recent weekly Premium Updates. At this time, the most bearish factors are not seen in the analysis of the gold charts themselves but rather in the corresponding ratios (Dow to gold and gold to bonds) and the situation in the USD Index.
Silver
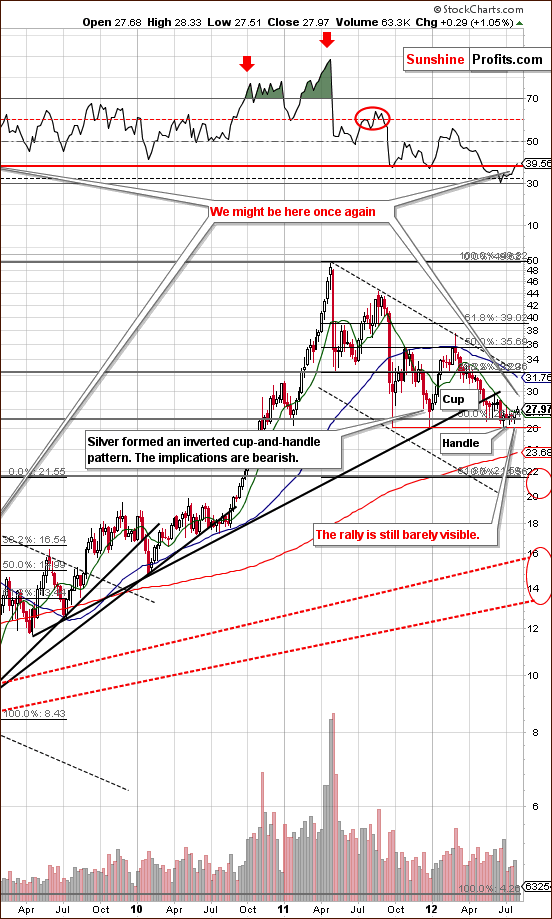
In the very long-term chart for silver (please click the above chart to enlarge), we did see some signs of strength on Friday and Monday. This is not overly significant from the long-term perspective however. The inverse cup-and-handle pattern is still in place here and the RSI levels provide a bearish analogy here as well.
Please recall what we wrote about gold earlier today - how it consolidated in 2008 before plunging. Recent RSI levels suggest a similarity to 2008. The RSI levels are currently above the horizontal red line, and this was seen just before the plunge continued four years ago. It seems that declines in silver's price are quite possible in the coming days and weeks.
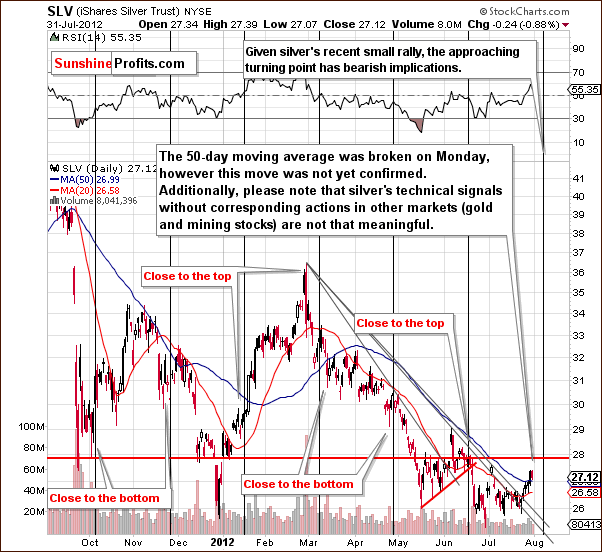
In the short-term SLV ETF chart, we see some signs that price declines are quite possible very soon. The recent move above the 50-day moving average could be viewed as a breakout and bullish signal. However, with only two closes above this resistance level, the move has yet to be confirmed.
Without signs of strength in the gold and mining stocks sectors and with no sign of weakness in the USD Index, this breakout truly appears not to be very meaningful. Fake breakouts are fairly common for the white metal (if not seen in other markets as well) and can be seen as recently as in both June and July. We simply do not see strong bullish implications here, especially with a cyclical turning point just ahead.
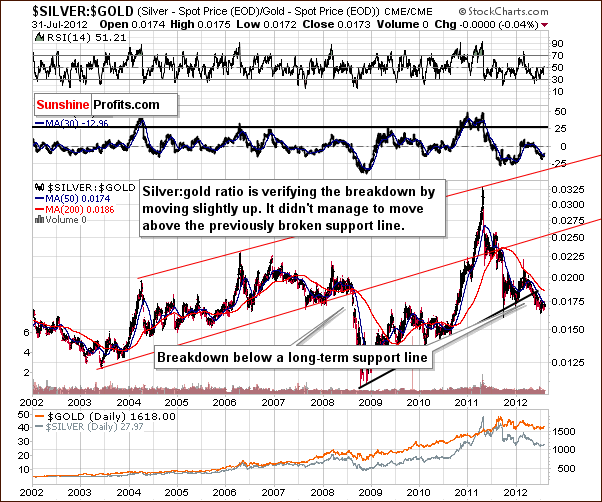
Finally, in the silver to gold ratio chart, we see no change at all this week, and the outlook remains medium-term bearish. This means that silver is expected to underperform gold in the weeks ahead.
Summing up, the situation for silver has not really changed even though the 50-day moving average has been surpassed. Things are a bit less bearish than last week, but long-term factors are likely to cause declines throughout the precious metals sector, and the USD Index rally is still very much in place.
Gold Mining Stocks
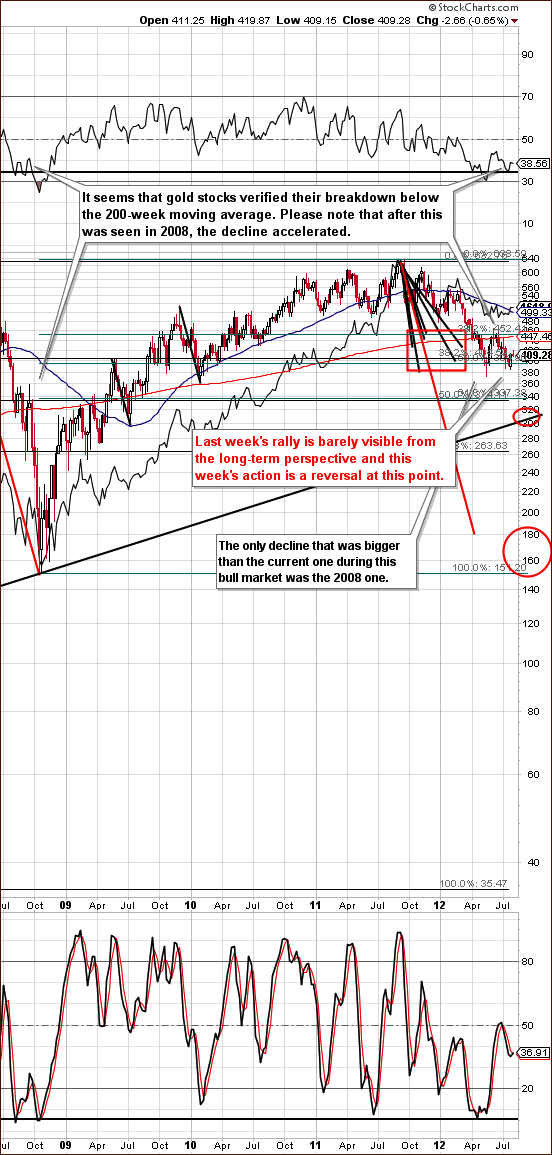
In this week's long-term HUI Index chart (please click the above chart to enlarge), we see that while miners rallied recently, this is barely visible from the long-term perspective. The index declined a bit this week, and the reversal candlestick which developed is not overly significant. Of course, we are still early in the week as we are writing just a few hours after Tuesday's closing bell. This chart simply does not provide us with any important bullish indications at this time. Conversely, the medium- and short-term trends remain down.
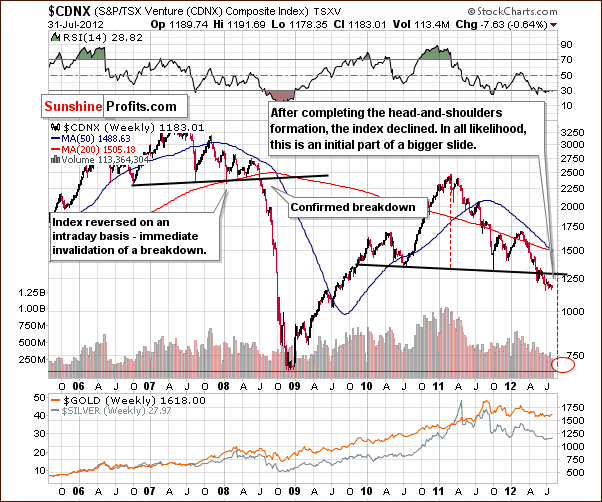
In the Toronto Stock Exchange Venture Index (which is a proxy for the junior miners as so many of them are included in it), we see additional bearish indications. A breakdown and completion of the bearish head-and-shoulders pattern are well in place, so the consequences remain bearish here. We expect prices to continue to move lower.
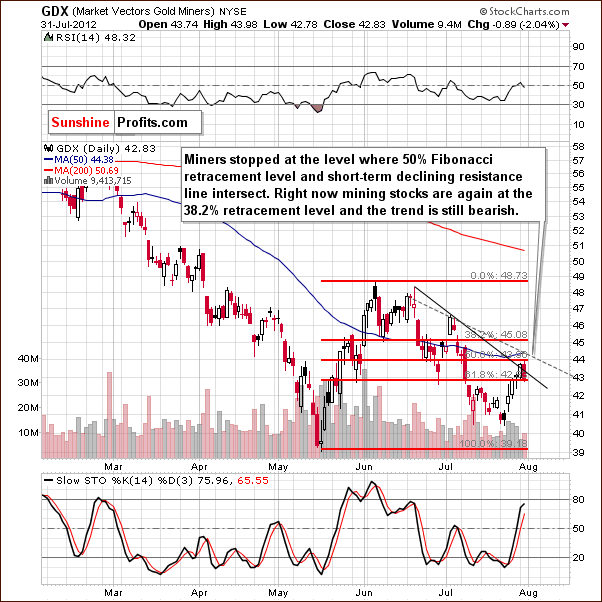
In the GDX ETF short-term chart, we see a move up to the declining resistance line and then a reversal which was accompanied by higher volume levels. At this point, the trend remains bearish as no significant breakout has been seen.
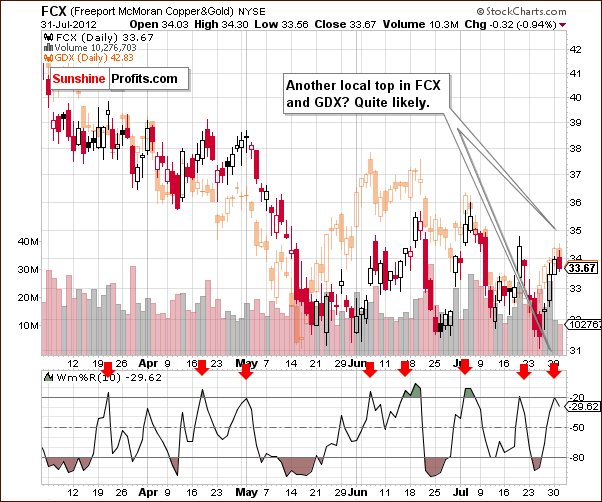
We now look at the Freeport - McMoran (FCX) Copper & Gold chart. The implications are bearish here as well. A few weeks ago, we introduced this chart and discussed a local top at the time. In our July 20th Premium Update, we wrote “In the Williams %R, seen in the bottom section of our chart, when the indicator (based on FCX) moves to the upper overbought line (it actually crossed it), declines in the GDX ETF generally follow.”
In other words, whenever the Williams %R indicator is seen at overbought levels, a local top usually emerges. This has once again just happened, so we are likely seeing another local top for the FCX and GDX. The implications are for the miners to likely move lower from here.
Summing up, although we have seen a couple of small moves to the upside, none really showed strength. The moves to the downside are not only more frequent but also appear stronger. Overall, the outlook remains bearish for the mining stocks and for the CDNX and FCX stocks as well.
On an administrative note, we usually provide junior rankings in the first Premium Update of the month, but since the case for the junior sector is so bearish right now, we will postpone it to the point at which the outlook will be at least neutral.
Letters from Subscribers Q: I agree with your logic that monetizing the eurozone debt means a weaker euro and so a stronger USD and thus increased downside pressure on precious metals. But a stronger dollar will mean more QE by the Fed, as a major part of both the eurozone and US problem is the need for growth and therefore for a weaker currency (structural economic problems and not cyclical ones). So if the euro weakens because of EU monetizing, followed by more QE in the US, then the euro rises again which is good for a lower USD Index and supports higher precious metal prices.
So the issue is not just whether a lower euro constantly justifies lower gold prices, but rather which country monetizes its debt more in this struggle for a lower currency. The price of gold then becomes just a function of the net balance of this monetary debasement between both international reserve currencies. And at some point gold, which is the real store of value, will stop playing this game, and increase its value as both fiat currencies are just being manipulated by their respective Central Banks and losing their real value.
It is inconceivable to me that as this monetary battle goes on the price of gold is continually held in check every time the ECB tries another round at depreciating the currency against the USD. If this was to happen, just for technical correlation reasons, then gold is no longer a true store of value but a puppet to a game where both currencies lose their store of value regardless of which one is up or down at any given time. The only question is when gold prices will separate themselves from this game, but for this unfortunately there is no chart. Which is why whichever way this keeps going, gold will have to go up if, in the end, it is a true store of value.
I therefore see little real reason to keep a part of one's long-term capital normally allocated to gold out of gold and in cash, because long-term gold will be up beyond any pullback from here. The only two investments currently are gold/silver and cash. Anything else is more risky. For traders it is different, as those are shorter-term positions looking for quicker profit. They may not want to allocate longer-term capital to gold as they may look to speculate in other more volatile risk assets rather than take a limited correction in gold prices. Would you agree?
A: Yes, we agree that a stronger dollar (and weaker stocks and commodities) will most likely cause (i.e. be an excuse for) another round of QE.
"...and at some point gold, which is the real store of value, will stop playing this game, and increase its value as both fiat currencies are just being manipulated by their respective Central Banks and both are losing their real value."
Exactly. However, the nature of the relationship is particularly interesting. Taking a fundamental approach, gold has been rising in almost all currencies since 2006, so the above is already in place. However, gold still reacts to short-term news, and this tendency will not end until the final part of the bull market when gold shoots much higher (and so will silver). This will likely continue to be the case in the following months. Furthermore, in a way, we will have a chart for that. We will see gold and silver move parabolically up and burst through resistance lines without taking a breather. That will be a confirmation that it's time to hold tight until gold moves above $5,000 in today's dollars. Naturally, we cannot tell for certain right now when that will happen. Charts are sometimes like headlights in the dark - you can only see part of the road, but you can make your whole trip that way.
The question of whether or not to make any medium-term adjustments to one's holdings really depends on one's attitude. Some will prefer to stay invested no matter how low gold could go temporarily. However, if that low was hypothetically $100, would you really not consider getting out now? We think that most long-term investors would because by selling today at $1,600 and then buying again at $100, one would increase their future capital 16 times. (Before anyone asks - that's just a thought experiment, we don't think that gold will ever trade that low.)
Of course the question is how low gold can go and how likely that is. That's why we provide price targets and probabilities, so that you can judge for yourself if you want to participate in a given move or not. We also provide the details behind our summaries, so you can verify them and see if you agree with the points we make. Right now in our view, higher values in the USD Index are on the horizon and this is very likely to contribute to lower gold prices, especially since there has not been a significant correction in gold in years. There was a major correction in the previous bull market (70s) and we expect to see something similar this time.
As far as short-term riskiness is concerned, we would argue that silver is one of the most risky markets out there because of its volatility and the way it declines after tops.
Q: For the last couple of months the $1500 level has provided very strong support. The author of this article is actually bullish and claims it's almost impossible to break such strong support, as can be seen in his charts. If support has been built over 6 to 9 months then it's very strong. Of course if such strong support is actually broken then the move will be quite strong to the downside. But aren't the chances of a breakdown only 20%-30%?
Here is the article:
http://www.clivemaund.com/article.php?art_id=68
A: We agree that the support at $1,500 is strong. However, we believe that it will be broken. The reason doesn't come from the gold chart alone. It comes to a large extent from the USD chart and the long-term breakout that we witnessed recently. It comes from the analysis of the gold:bonds ratio and dow:gold ratios and the fact that the Fed wants to see lower stocks and commodity values before launching another round of QE.
Q: When you write about opening positions in precious metals miners are you also referring to the metal (or its index/ETF)? Or do you explicitly distinguish between miners and the metals?
A: When we write about opening positions in precious metals miners, we mean only precious metals miners. Not metals. We strive to be precise in our suggestions, because we realize that many investors/traders read us to the letter.
Q: Would you agree that shorting gold would be a good idea?
A: Depends on who's asking, what their portfolio looks like and how much money are they willing to use for this short position.
Assuming that the question is being asked by a trader with experience, using only a part of their capital for speculation, and who remembers to use only a small part of it on each trade, then we would say this option is ok, but more risky than shorting gold miners because the situation in the latter is more bearish. We would tell this trader that we don't short gold ourselves, but if one doesn't have the opportunity to short mining stocks or mining stock ETFs (like GDX ETF) then one might short gold, but with a small position. Again, the situation with gold is less bearish than with miners.
All in all, we do not suggest shorting gold or silver at this point, only miners.
Q: The following example was shown in the June 7 Q&A section:
Assuming that you had $10,000 and ZSL's price was $60, you would buy: (10,000 / 60) * (10% / 30%) = 55.56 => 56 (rounded) ZSL shares."
Why would the price of ZSL be a factor? Assuming the whole $10,000 is in ETF SLV, at the price of $27, it means I have about 370 shares. Since ZSL is an inverse double ETF, I would need to buy 370/2=185 shares of ZSL to hedge my position 100%. Am I correct in this calculation?
A: Yes, this calculation is correct.
The price of ZSL in the quoted answer was a factor because we were asked how one can hedge juniors with this particular ETF. It was a factor in these calculations because there is no stated leverage for an ETF vs. a basket of juniors. In the case of ZSL vs. SLV you can immediately tell that the leverage is -2x (meaning that it's double and in the opposite direction). And that is because that is the description of the ETF. However if you want to make more detailed calculations like comparing ZSL to a whole portfolio, then more input data becomes necessary.
Q: You often discuss the correlation between the price of gold and a number of other factors. Here's an interesting thing to use for correlation: the US debt. I found such a comparison posted on a forum and copied the graph here: http://s19.postimage.org/armv8w9gz/US_Debt.png
This chart implies we can project gold's price if we can estimate the future US debt and debt ceiling.
A: Actually, we commented on the gold-debt-ceiling link about a year ago, in the July 29th, 2011 Premium Update. Since nothing has really changed about this relationship, we will quote what we wrote back then:
For more details on the history of the debt ceiling in the U.S., please take a look at the chart below.
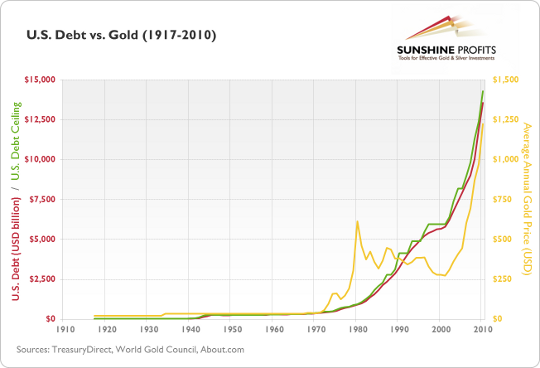
As you can see, gold has roughly followed the rise in the U.S. debt since 2000. You can also see that there were periods when gold traded without a visible correlation with the debt. In short, the above chart confirms that growing uncertainty linked to the growing debt pile might fuel the price of gold. However it also confirms that markets cannot follow a given economic indicator with reasonable precision at all times. This is what we've emphasized many times - that fundamental factors can only point you in the general direction a market is going. They do not provide details on timing.
In fact, while the debt didn't decrease, the price of gold did, which confirms this observation. This link doesn't provide details on timing, but remains a positive long-term factor for gold.
Q: When are the cycles supposed to change?
A: The cyclical turning point in the USD Index is in place right now. A rally should occur either immediately or soon (in the next several days).
The cyclical turning point in silver is approximately a week away, but these cycles are less precise for silver than for the USD Index. Consequently, we are already in the bearish cyclical zone, simply because we are close to the turning point.
Summary
The situation for the precious metals remains bearish in our view. Just because gold has not moved below $1,500 does not mean that it won’t happen within the next few weeks. It still appears more likely than not (75% or so) that we will see declines to this level and below.
The breakout in the USD Index held and the rally is likely to continue. The cyclical turning points for both the dollar and for silver suggests that the USD Index will move higher with lower precious metals prices likely being just around the corner.
We continue to believe that being out of precious metals with at least part of long-term investments and betting on lower mining stock prices with speculative capital are both good ideas right now.
This completes this week's Premium Update. Our next Premium Update is scheduled for Friday, August 10, 2012. Naturally, we will keep you notified via Market Alerts if the situation requires it.
Thank you for using the Premium Service.
Przemyslaw Radomski

