
Gold rose sharply Wednesday after a European Central Bank council member suggested the possibility that Europe's rescue fund could get a banking license, allowing it to tap cheap ECB funding. The rally was also supported by reports that the Federal Reserve is getting ready to implement another round of stimulus. The Wall Street Journal reported Wednesday that the Fed is growing uneasy over the sluggishness of the U.S. economy and the unemployment rate. We sent out a Market Alert saying that despite the short term rally we have not changed our mind and still believe that it is a good idea to be partly out of the precious metals market and to use a part of the speculative part to bet on lower mining stocks' prices in the medium term.
It was around this time last year that a dazzling hoard of gold coins and precious stones worth about $22 billion was uncovered hidden in the underground vault of a temple in Southern India. It had been untouched for nearly 140 years. Many items in the precious stockpile were offerings made by devotees over hundreds of years and the rest, the hoard of the royal family. Besides more than 2,500lb of gold coins and precious stones, the booty included gold ropes; a 3ft 6in idol of the Hindu god Vishnu embedded with diamonds, emeralds and rubies, and an 18ft-long gold chain weighing more than 75lb to adorn it.
Traditions in India do not change and Hindu worshippers continue to show their devotion by bringing gold offerings to the deities. Some temples get donations of as much as 100 kg (3,215 oz.) of gold every month. Recently these offerings have come under the scrutiny of the Reserve Bank of India which called for a cutting back on the custom. Tons of gold are hidden in temple vaults across the country with more gold offerings adding to it annually. The metal has always played a key role in Indian spiritual and financial life and it is the symbol of the Hindu goddess Lakshmi, the goddess of prosperity and luck. One temple, which receives 100 kg (3,215 oz.) of gold and 130 kg (4,180 oz.) of silver per month, has approximately 1.2 tons of gold deposited in the State bank of India, enough to rival the central banks of some small countries. Indian officials are unhappy with the fact that imports of the precious metal are adding to India's trade deficit.
Recent sales of gold coins by Iran's central bank evoked huge responses from large crowds seen outside the various banks. Many Iranians are reported to buy gold and dollars from black markets in response to rising inflation which climbed near twenty percent recently from as low as 8.8 percent. Worries about the declining buying power of the Iranian rial and doubts over the currency's stability are the main drivers behind the flight to gold. Wealthy Iranians in Turkey are collecting gold on behalf of the Iranian central bank and exporting it to Iran, Turkey's Zaman newspaper reported. The expatriates are strengthening the resources of the Islamic republic's central bank amid concern over tougher sanctions against Iran. The country is estimated to have over 300 ton of gold and is now believed to be among the 20 largest holders of gold reserves. We say that accumulating gold reserves is much better than accumulating nuclear bombs.
Turkey is experimenting in using gold in the monetary system. Like India, Turkey has a traditional fascination with gold and for generations Turks have flocked to the jewelry shops of Istanbul's labyrinthine Grand Bazaar. The Turkish monetary authorities have found a ways of harnessing the gold owned by their citizens to complement the existing paper monetary system.
In September 2011 the central bank of Turkey increased the ratio of reserves that could be held by banks in the form of gold from zero to 10%, then raised it to 20% in March 2012, and again, to 25% last month. This has increased the banks' appetite for gold and the country's commercial banks are encouraging customers to open gold deposit accounts. Customers give their gold to a bank and can make withdrawals in gold bars or the lira currency. The accounts offer interest rates substantially lower than those on normal time deposits. The interesting thing is that lower interest rates are associated with assets that involve lower risk. So – the above implies that gold is less risky than cash.
It's a win-win situation for Turkish gold investors who can store their gold in a secure environment and earn interest on their holdings, even if it is low.
This prompts people to take gold holdings out from under their mattresses and put them back in circulation, it may help to reduce the growth of the country's gold imports, cutting its current account deficit. Turks are believed to have accumulated about 5,000 tons of gold in their homes. According to the World Gold Council, Turkey's gold demand is fifth in the world for jewelry and eighth for retail investment.
It makes us wonder why other countries are not following Turkey’s example. Already the State Bank of India is offering gold deposit options for customers at low rates of interest. It is estimated that the public in India holds some 20,000 tons of the yellow metal.
It's only mid-year and already there are prognostications as to the future price of gold. According to Deutsche Bank's precious metal forecast for next year,gold price will reach its all-time high of $2,000 an ounce in the first quarter of next year. Silver prices are expected to average $42 per ounce.
“While we see ongoing upward pressure on the US dollar over the summer, we expect US efforts to address the fiscal deficit in an environment of loose monetary policy will resume US dollar weakness. Indeed latest US capital flow data continue to indicate an under funding in the US trade deficit,” Deutsche Bank noted.
“We expect that the precious metal prices are likely to remain range-bound over the next month or so as meaningful monetary policy action is likely to be absent. Nevertheless towards the end of the quarter we expect that gold may lead a move higher as investors anticipate intervention and US dollar weakness resumes.”
Goldman Sachs updated its forecast recently on the gold price to $1,940 within the following 12 months, which means by mid of 2013. Barclays Capital expects a gold price of $1,790 in the fourth quarter of 2012 while Morgan Stanley predicts gold prices as high as $2,000 during that quarter. Isn't it strange that these financial institutions now point to higher gold prices while they were predicting gold to “average at lower prices” i.e. decline in the previous years? Maybe it will be time to buy when these forecasts are lowered.
To see how the price of gold will do in the upcoming weeks let's begin this week's technical part with the analysis of the Euro Index. We will start with the long-term chart (charts courtesy by http://stockcharts.com.)
Euro and USD Indices
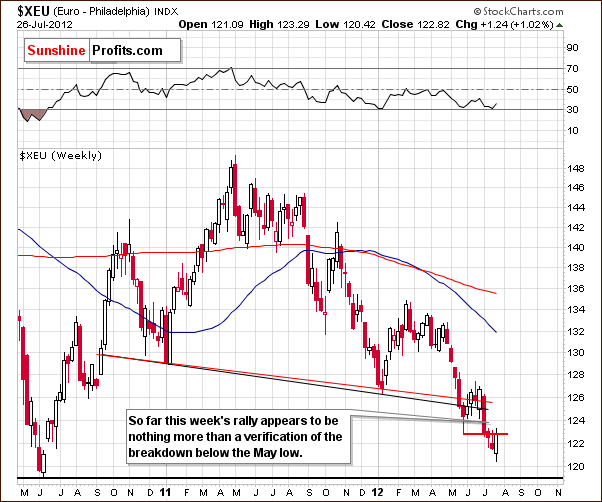
We begin this week with a look at the long-term Euro Index chart. The euro rallied this week, its first positive action in a month. It was not really very positive, however, because the index was not above the level of the May lows. The recent breakdown is actually still being verified so the short-term and medium-term trends remain to the downside. We are therefore not bullish right now based on the small rally which was seen this week, as what we see appears to be simply a pullback.
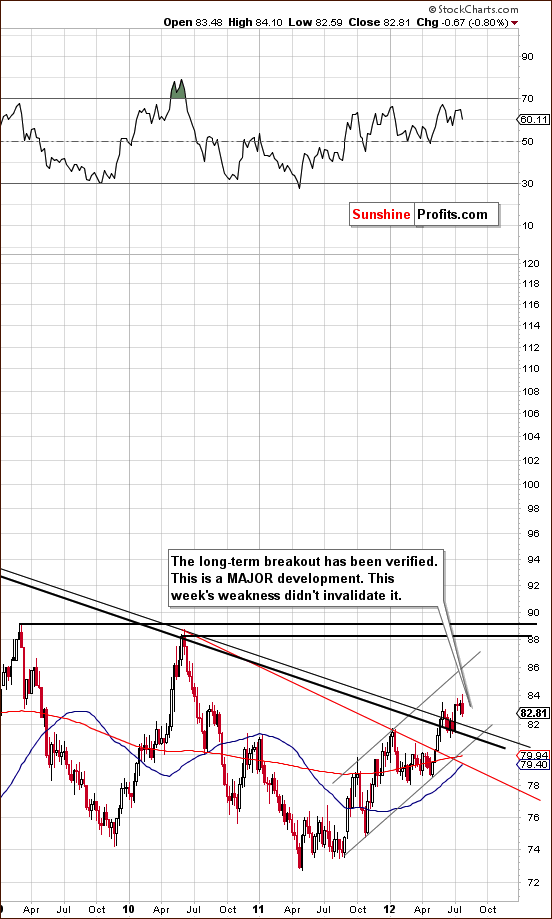
In the long-term USD Index chart (please click the above chart to enlarge), the picture is consistent, that is, the opposite of what we saw in the Euro Index. Here the breakout above the long-term resistance line is still in place and the medium-term trend remains up. This week's declines in the USD Index do not invalidate the bullish outlook here at all.
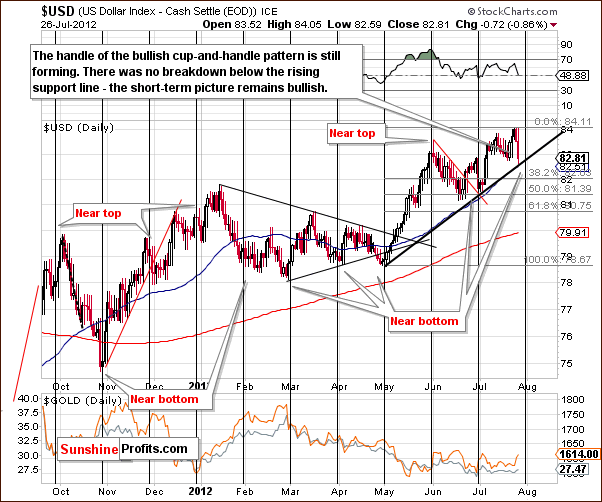
In the short-term USD Index chart this week, we see a decline towards the short-term rising support line and the 50-day moving average, which is the blue line in our chart. This could actually be viewed as a bullish event because the cyclical turning point is close at hand. With the most recent move being to the downside, the cyclical turning point is likely to cause a reversal to the upside. You may recall that in early July, a sharp rally was seen soon after the cyclical turning point was crossed.
Please take a look also at the bottom of the chart – prices of precious metals (gold and silver are visible on the chart) are below their early-June high, while USD Index is a bit lower. So, even though we have seen gold's strength relative to the dollar on Wednesday, the opposite was the case on Thursday and overall the medium-term impact of this relative analysis is not bullish for PMs.
Summing up, the short and medium-term trends remain bullish for the dollar and bearish for the euro. The implications overall for the precious metals sector also remain bearish.
Please keep in mind that the rally in the USD Index is not really based on dollar's fundamental strength – it is based on Euro's weakness. The latter is simply likely to decline in value faster which will make USD appear like a strong currency. Gold should theoretically benefit from both: USD and euro weakness because investors “should” buy gold to protect themselves against the depreciation of fiat currencies. But that's not how the market views the situation – at least not yet. Gold is still being viewed by many market participants as a “risk asset” like stocks that one should sell in exchange for dollars if things get uncertain. This irrational (our opinion) situation will change at some point in the future, but until it is in place (and it is the case right now) one should take it into account while determining next moves in gold and silver.
The average, medium-term relative performance of precious metals and the dollar don't imply a rally in the former. We saw some short-term strength but it didn't change the medium term picture. The relative analysis in this perspective is not bearish for gold, but it's not bullish either.
General Stock Market
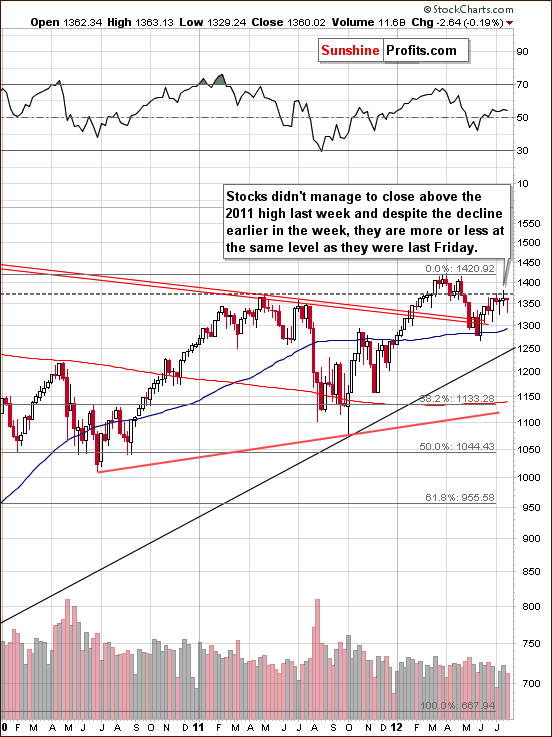
In the long-term S&P 500 Index chart (please click the above chart to enlarge), a lot happened this week, but very little changed. Stocks did not close above their 2011 highs last week. This week stocks moved lower and then pulled back up showing very little change overall. This week's move to the downside was less than 0.2% so price levels are pretty much unchanged from last week. At this time, the long-term S&P 500 Index chart is a bit more bearish than not.
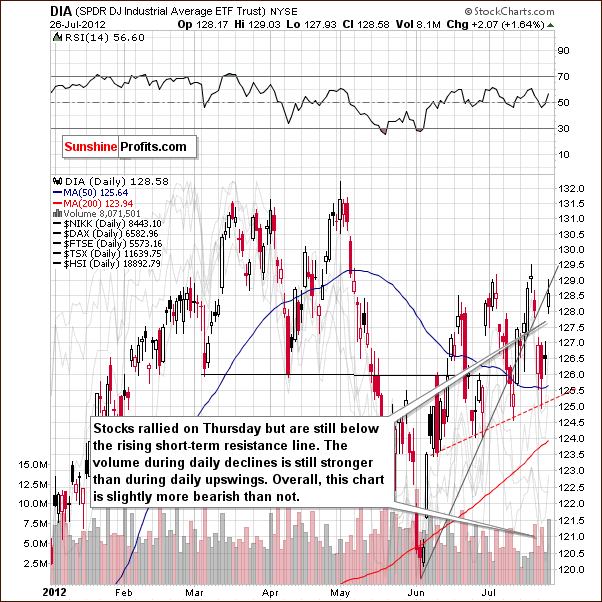
In the short-term DIA (a proxy for the Dow Jones Industrial Average), the outlook mixed because the price levels are below the rising resistance line and at the same time we see a bullish indication in form of high volume. The significant volume levels which accompanied Thursday's 2% rally seem to confirm the direction of the move. Then again, since price levels are not above previous local highs or above the rising short-term resistance line, the overall situation here is mixed.
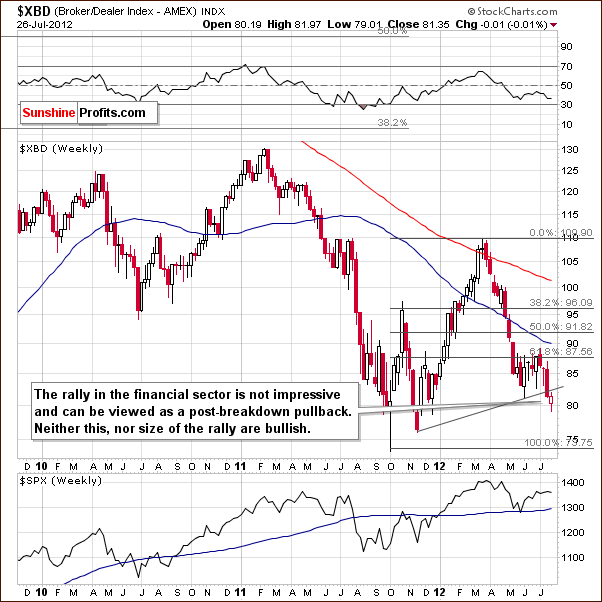
In the Broker Dealer Index chart (a proxy for the financial sector), we have bearish indications and this week's rally is barely seen here. The financial are now generally lower than they were a few months ago and also much lower than recent local highs.
Indications are that a move to the downside is likely from here, and this also holds true for stocks in general, since the financials usually lead the other markets. This has been the often been the case when looking back on numerous months and years.
Summing up, the situation for stocks in general is a bit more bearish than not based mainly on the recent price action of the financials, which seem to be headed lower and generally lead the other stocks.
Crude Oil
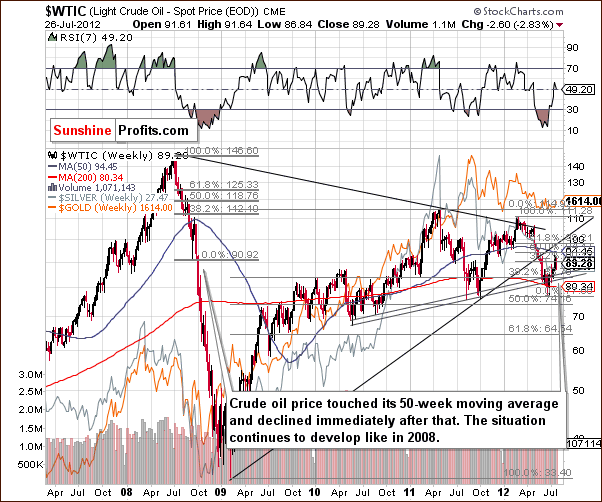
Turning to the crude oil price chart, recall that in last week's Premium Update, we indicated that the rising prices were probably temporary and we expected that downtrend to continue.
The outlook is not bullish since the resistance line just discussed has not been broken but we no longer view the situation as very bearish. A bit more bearish than not would be a better description today based on this chart alone.
This week, we once again have seen a sharp decline in prices followed by a pullback. Prices are now below the 38.2% Fibonacci retracement level of the previous decline. Therefore, we see the short-term trend from here likely to be to the downside.
It is particularly interesting to note that the prices reversed after touching the 50-week moving average, the blue slope in our chart. This is quite similar to what was seen in 2008, and back then, a significant decline followed. All-in-all, the above points make this chart overall bearish.
Precious Metals Correlations
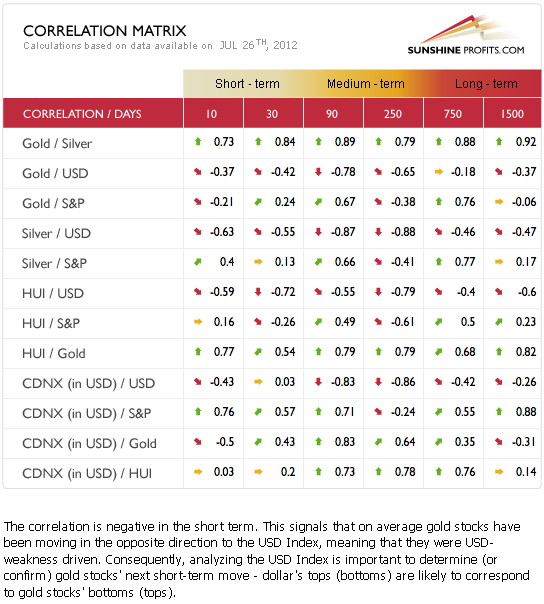
The Correlation Matrix is a tool which we have developed to analyze the impact of the currency markets and the general stock market upon the precious metals sector. Looking at the USD Index and the general stock market situation, the likely impact of these markets is still bearish upon the precious metal sector. The strongest short-term coefficients are seen this week between the mining stocks and the dollar. This bearish influence upon the mining stocks appears even greater than the USD's impact upon gold and silver.
The USD Index has negative medium-term coefficients with gold, silver and the precious metals mining stocks, so it's clear that the situation in the USD Index is still having a strong negative impact here. One final interesting point this week is that the miners moved a bit higher on Thursday even though the USD Index declined significantly (for a one-day move). This small move is actually a sign of the current weakness now present in the mining stocks overall.
Gold
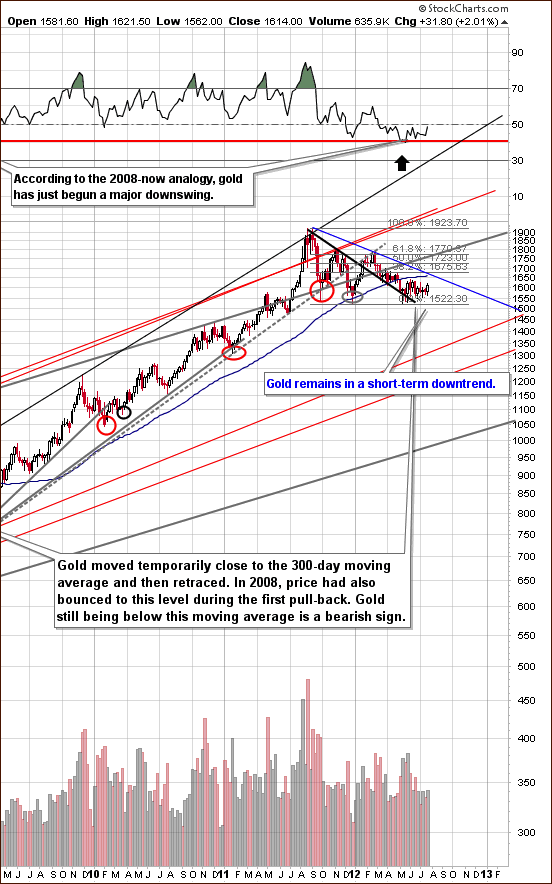
In the very long-term gold chart (please click the above chart to enlarge), the situation is unchanged in spite of the rally this week. The trend still remains down from here and with RSI levels now close to 50, gold is no longer oversold. It is quite possible that another decline could be seen very soon and overall the situation here is very similar to last week.
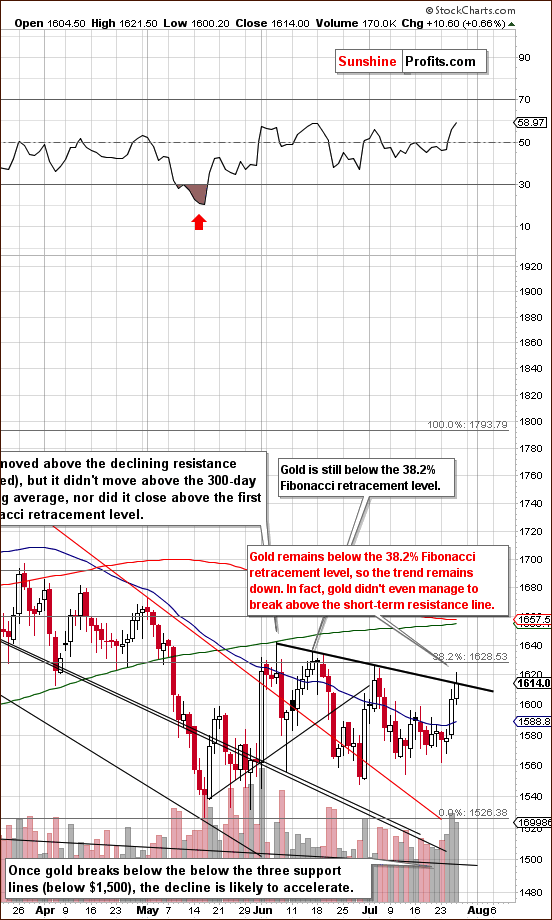
In gold's short-term chart (please click the above chart to enlarge), we see an unsuccessful attempt to move above the short-term resistance line. Prices reversed and moved back to this line, and the breakout is not viewed as being in. Even if it was in, it would not be confirmed at this point.
The outlook appears bearish for the short term as price levels are still below 38.2% Fibonacci retracement level based on the previous decline. Technically what we've seen since early June is a consolidation within a downtrend. This week, we saw price action quite similar to what we saw in late June, that is, a rally on significant volume but not enough to ignite a bigger gain.
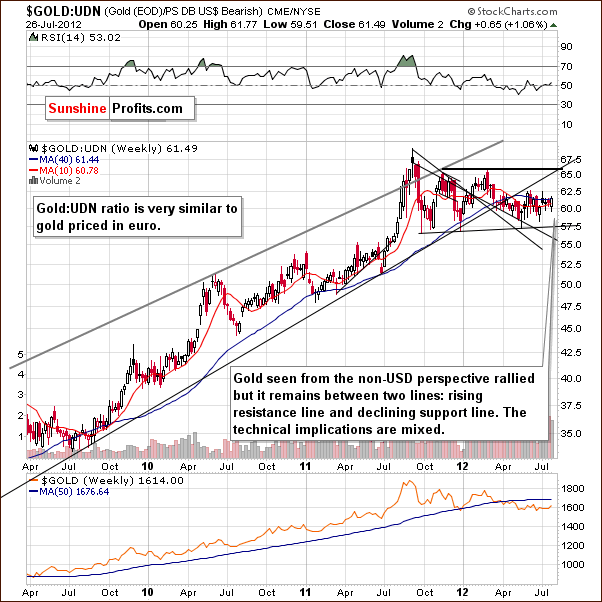
In this week's chart of gold from a non-USD perspective, nothing has changed this week, and the implications remain mixed here. As we stated in last week's Premium Update, “we continue to see sideways price movement as has been the case for several weeks now. The situation remains mixed here.”
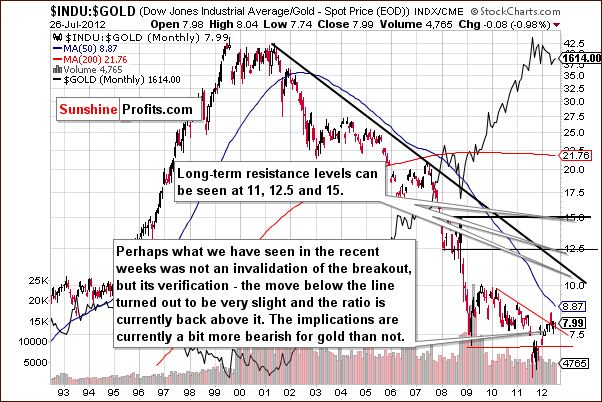
In the Dow to gold ratio chart, we see a breakout in this chart, which although is not huge, has bearish implications. With the ratio above the declining resistance line, a further rally seems probable. The past couple of months have likely just been a period of consolidation, and, with gold in the denominator of this ratio, the bullish outlook here spells bearish news for gold. This ratio rises only when stocks outperform gold. In this case it seems that the rally would be caused by gold's decline, not by stocks' superb performance.
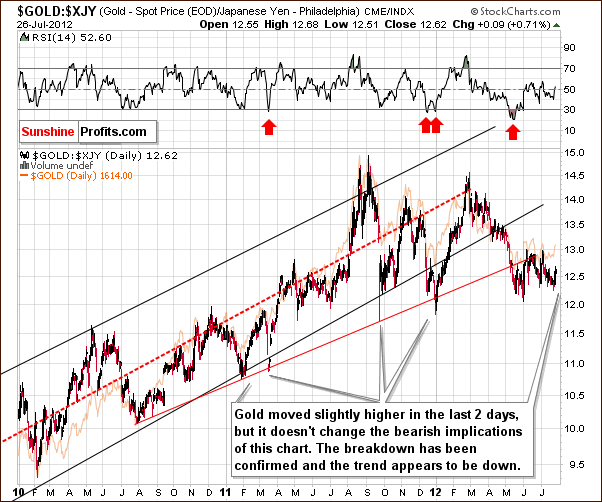
In this week's chart of gold from the Japanese yen perspective, we see no bullish details as this week’s rally is barely visible here. The consolidation after the breakdown still seems to be in progress, and the bearish implications remain unchanged.
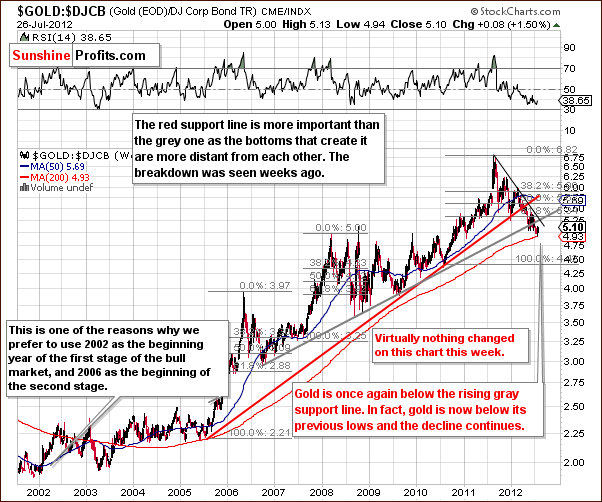
In the gold to bonds ratio chart, we see a small pullback this week, but this really doesn’t change anything. The breakdown below both significant support lines is confirmed, and right now the situation is bearish.
Summing up, the bearish case for gold is somewhat supported by the gold charts seen this week. Most important is the medium-term outlook for the USD Index where a major breakout has been seen. This week's trend was seen twice recently, both in June and July, so it doesn't really seem likely that the rally will hold here.
The thing that stopped the rally in early June was the 300-day moving average and as long as gold remains below it, the situation will remains bearish for the medium term. The 300-DMA is currently at $1,655. At the moment of writing these words we have gold at $1,628, so the situation remains bearish.
Silver
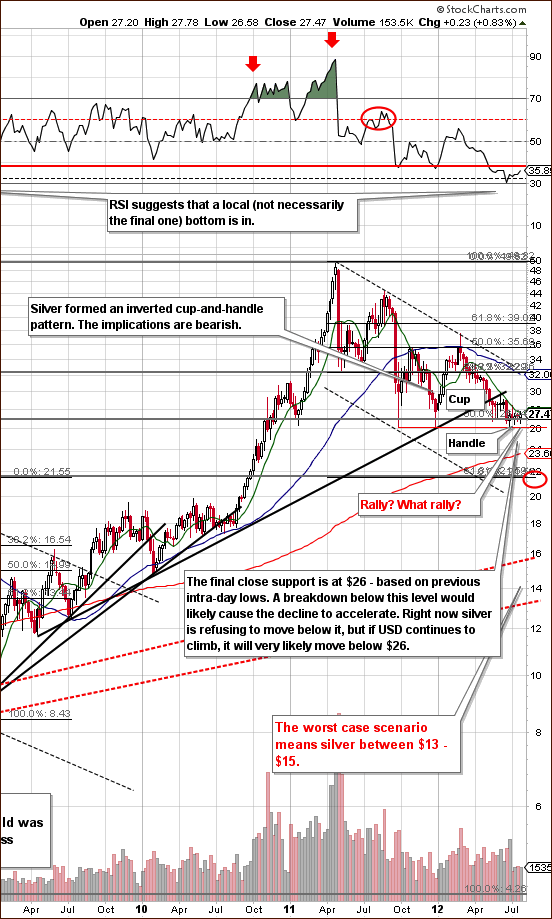
In the very long-term chart for silver (please click the above chart to enlarge), it's most important to note that this week's rally is basically invisible. Silver saw a small move to the upside which was stopped by the 50-day moving average.
The inverted cup-and-handle pattern is still in place and still has bearish implications. The same 50-day moving average provided resistance during the pullback back in 2008. The level was not breached and sharp price declines followed. The outlook here remains bearish.
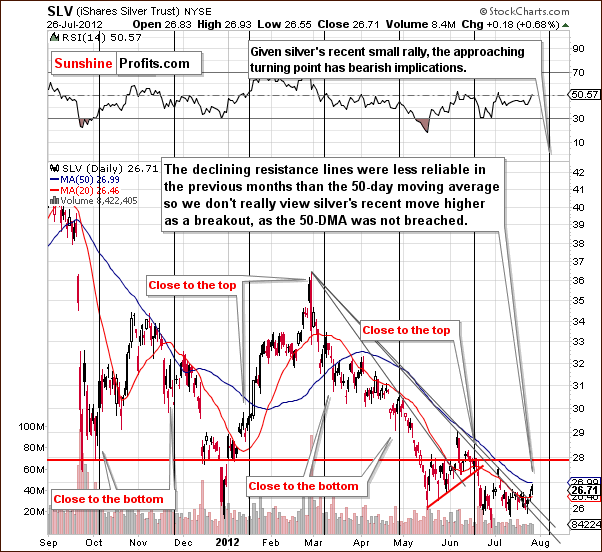
In the short-term SLV ETF chart, we have seen a breakout above the declining support line. After a closer look, we have decided not to view this as a significant event. Examining a previous analogy, we see a similar move as recently as mid-June when this line was broken without meaningful impact in the following days.
Right now the blue 50-day moving average line in the chart is more important. It has not been broken, only touched this week, and the cyclical turning point is fast approaching. The fact that prices moved higher ahead of the cyclical turning point indicate a likely period of decline rather sooner than later (perhaps next week).
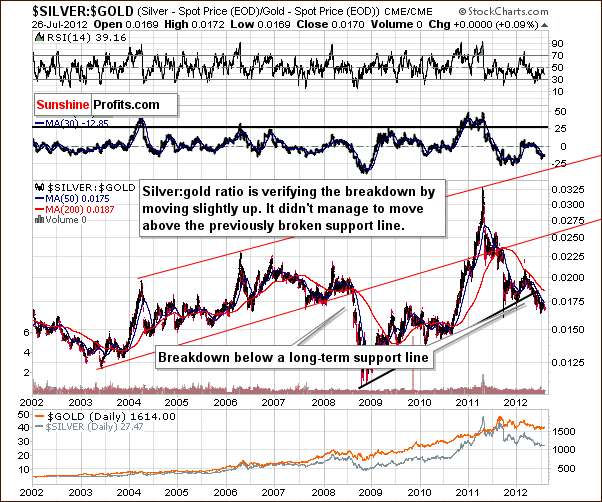
In the silver to gold ratio chart, we remain in a medium and short-term downtrend. The situation for silver continues to be bearish based on this chart. Quoting from last week’s Premium Update: “The implications in this ratio chart are quite bearish. The last time such a serious breakdown was seen was in 2008, when a very volatile decline in gold, silver and mining stock prices resulted.”
Summing up, the case for silver remains bearish, very much like we saw for gold. This outlook is based not only on silver's price action but also is due to the influence of the USD Index. Finally, the cyclical turning point situation here suggests that price declines are likely to be seen beginning in a week or so.
Gold Mining Stocks
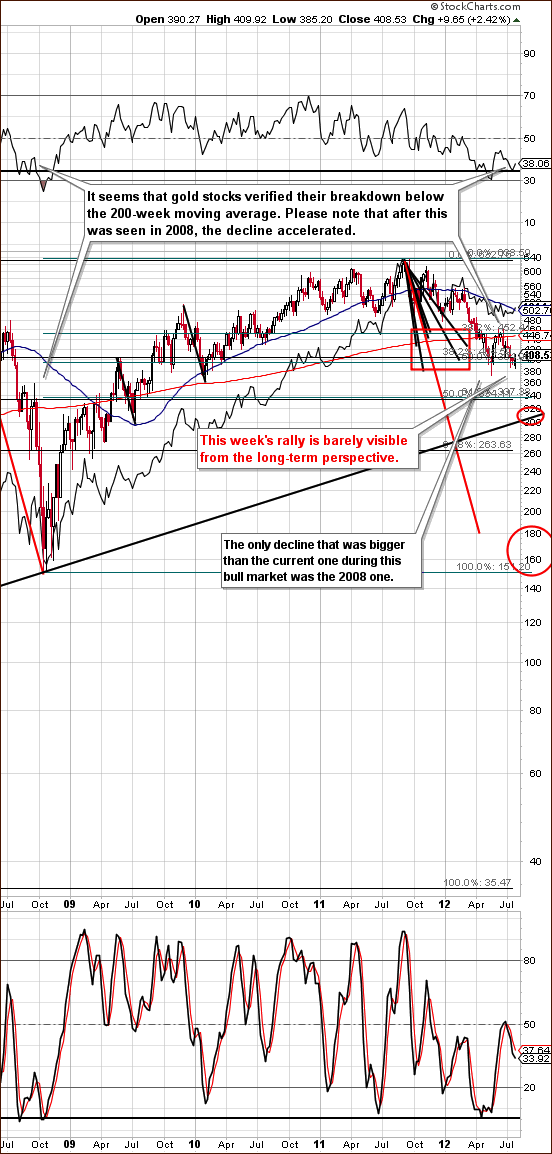
In this week's long-term HUI Index chart (please click the above chart to enlarge), barely any rally has been seen, and the index is just a bit more than 2% above the level of a week ago. Gold is close to its price levels of early June, but the HUI Index is not close at all, and thus its recent price action is not viewed as bullish.
Conversely, the mining stocks underperformance is quite striking and the important bearish factors remain in place for precious metals overall. Downside target levels are presently unchanged at about 310 initially with 160 as a minimum target for the current decline.
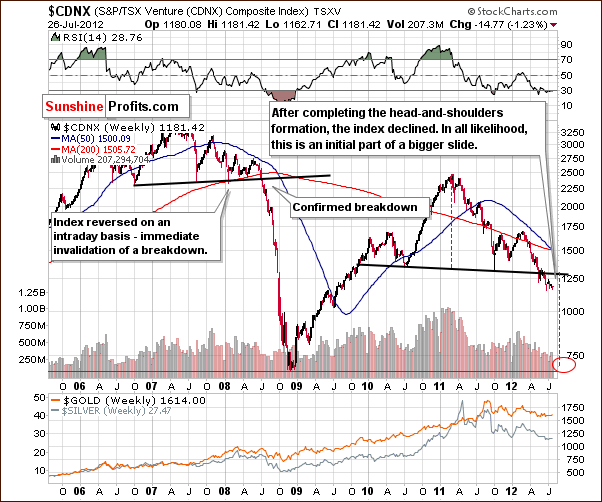
In the Toronto Stock Exchange Venture Index (which is a proxy for the junior miners as so many of them are included in it), the bearish outlook for mining stocks is well supported here. The breakdown is in place and the situation is unchanged since last week. The bearish signs remain in place.
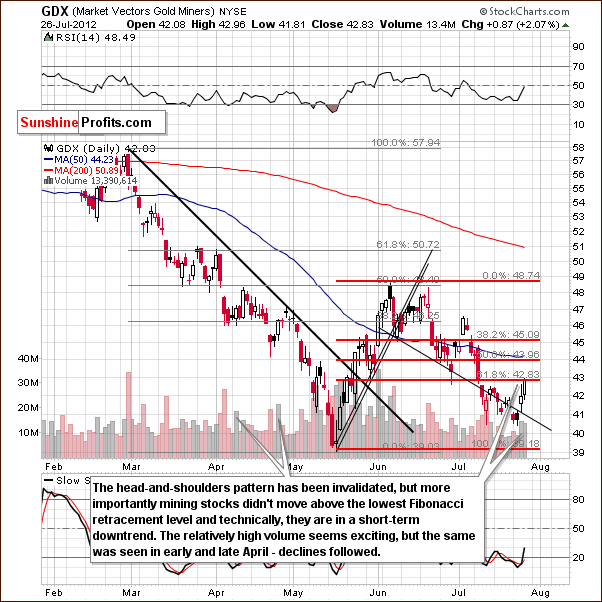
In the GDX ETF short-term chart, we see a rally, which could be considered quite encouraging based on volume levels. It does not seem to be something to get overly excited about, however, as such moves have been seen within contra-trend rallies a few times over the past month or so.
Whereas it is somewhat bullish, it is not enough to invalidate previous points which have been made this week. Also, the mining stocks did not manage to close above the first Fibonacci retracement level based on the May-June rally, so the short-term trend remains down.
Summing up, the situation is bearish for mining stocks based on what we are seeing in the gold and silver markets, the USD Index, the Toronto Stock Exchange Venture Index, and the recent underperformance of mining stocks relative to gold.
Sunshine Profits Indicators
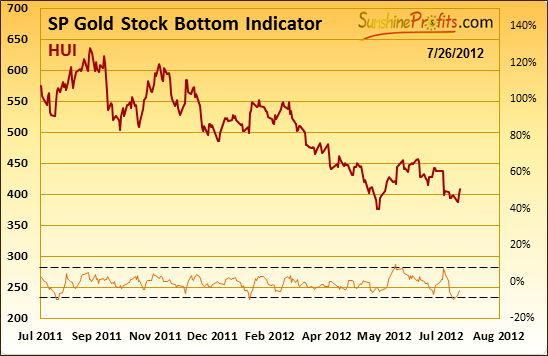
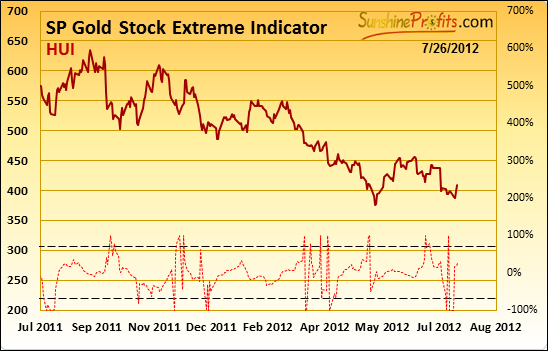
Looking at the Sunshine Profits Gold Stock Bottom Indicator and the Sunshine Profits Gold Stock Extreme Indicator, both flashed buy signals this week, and a rally actually followed. So these indicators can be particularly valuable for day traders.
We are not day traders ourselves, and we do not believe that declines in the precious metals are over yet, so we chose not to bet on this small rally. We made this decision because we expected the move to be quite small, and we judged the risk of not getting back on the short side at favorable prices to be too great.
In our recent Market Alert, we also discussed the underperformance of mining stocks relative to gold:
The rally that our indicators have suggested might be what we are seeing today - and the rally in the mining stocks is quite disappointing when one compares it to the one seen in gold - miners are where they were on July 13th, and gold is well above this level.
So far, this seems to be the case very much in line with what the indicators predicted.
Letters from Subscribers
Q: The dollar is at 83.7. The euro is at an eleven year low. Gold is still above 1580. Something is wrong with this picture. You haven't given us the odds of gold continuing below 1500. Now would be a good time.
A: The odds for gold continuing below $1,500 are currently 75% in our view.
Q: To Mr. Radomski: Your correlations have been very helpful. Here is what I'm seeing for the last 90 days:
Gold down 5% from 1660 to 1580
Silver down 15% from 31 to 27
Dollar up 6% from 79 to 84
HUI down 15% from 450 to 390
And silver made a 20 month low on June 28.
There are two huge technical triangles and I feel silver and gold are going to break downwards. What are your comments?
A: Generally triangles are continuation patterns. In most cases they are seen during rallies, but right now we see them in a decline, so the implications now are bearish.
Q: The CDNX breakdown. Is there a percentage you can apply here as to the chance it will lead to a significant decline based on the breakdown in the H&S formation? Is it a 30%, 50% or 80% probability?
A: It depends on what we would define as a significant decline. We'd say that a move below 1100 is 75% likely, a move below 1000 is 65% likely and a move below 750 would be 40% likely.
Summary
The situation this week in the USD Index remains bullish as the breakout above the long-term resistance line is still in effect. The bearish days for the Euro Index continue in spite of a small rally seen over the past week. The general stock market remains more bearish than not, and the outlook for crude oil prices is also bearish.
Keep in mind that the Fed most likely wants to see lower stock, commodity, and precious metals prices before considering any additional rounds of quantitative easing. This makes the picture quite bearish for the precious metals sector overall.
The technical picture for precious metals is not too favorable either. Overall, gold charts provide a bearish outlook and the same holds true for silver. In addition, the white metal is approaching a cyclical turning point, which will likely result in lower prices for the short term based on the price action of recent days.
The most bearish of all are the precious metals mining stocks, where all our previous negative points also apply, and in addition, there are bearish implications from the Toronto Stock Exchange Venture Index and in the underperformance of the mining stocks relative to gold. All-in-all, we continue to believe that being partly out of the precious metals market with long-term capital and betting on lower mining stock values with speculative capital continue to be good ideas at this time.
Our targets for gold are: $1,350 and $1,200, for silver: $21 and $15, and 300 and 160 for the HUI Index. The latter corresponds approximately to $31 and $17 for the GDX ETF.
We would like to emphasize that we keep monitoring the markets at will notify if anything changes – as soon as possible.
This completes this week's Premium Update. Our next Premium Update will be moved up by two days and is scheduled for Wednesday, August 1, 2012.
Thank you for using the Premium Service. Have a profitable week and a great weekend!
Przemyslaw Radomski

