
Jay Leno recently joked that the space probe, Voyager 1, launched back in 1977, is 11 billion miles in space and is on the verge of leaving our solar system on a mission to find other civilizations from which we can borrow money.
Voltaire, the French Enlightenment writer and philosopher, shed some light when he said: “Paper money eventually returns to its intrinsic value –zero.”
The world is facing a crisis of unprecedented proportions. The U.S. economy is not much better off now than it was in 2008 and Europe’s economy is substantially worse. The financial system is fighting for survival and has been temporarily rescued by governments printing obscene amounts of money, it being the politician’s path of least resistance. But it is a course of action that can have direct consequences-- the devaluation of currencies and inflation.
Can the Fed and the ECB print money forever and keep rates near zero?
Many believe that the current economic turmoil began in 2008, but one can argue that the seeds were planted in 1995, which is when the M2 money supply shot up. Four years later, December 1999, it was a startling $1.140 billion. You realize the upward thrust of this trajectory when you compare this with the relatively “mild” rise of $322 billion in preceding four-year period from January 1990 until December 1994. It was no coincidence that the increase since 1995 was accompanied by the Dot.Com boom and bust.
The money supply just kept growing after the Dot.Com bust. In 2000 the M2 money supply was increased to a walloping $2,834 billion in the eight years from January 2000 through December 2007. Again, it is no coincidence that we had the 2008 real-estate bust.
Worldwide, there is a Himalaya-size mountain range of debt, built upon debt, backed by debts, based on debt and leveraged with more debt that has been piling up since President Nixon unshackled the dollar from its last gold restraint – so the above-mentioned seeds of turmoil might have been planted much earlier than in 1995. His decree severed the ability to redeem the dollar for gold and thus, in one fell swoop, he eliminated the speed bumps for debt. Things have come to such an extreme on the Debt Super Highway that you can lend money with borrowed money, which is what you do when you buy a bond with leverage.
Governments have long since passed the point where they can amortize their debts and now all they can do is kick the can down the road and "roll" the debt and the interest as they come due. This leaves them vulnerable to the market demand for their bonds, as some of the weaker members of the eurozone have discovered lately, much to their dismay. When they will hold a bond auction that will fail to attract bids it will be “game over.”
Up to this day, no paper currency has survived in its original form while gold has been used as money since time immemorial. Every fiat currency since Roman times has ended in devaluation and eventual collapse, of not only the currency, but often of the host economy. The usual course of events is that paper currencies are inflated away until worthless. The purchasing power of the US dollar, for example, has declined by 90% since 1950, also true for most currencies.
The Roman Denarius was a coin of pure silver at the beginning of the first century C.E. Hundred years later the denarius’ silver content was down to 85%. Roman emperors liked the idea of devaluing their currency in order to pay the bills and by 218 C.E. the Denarius was down to 43% silver. Around the time of the collapse of the Romans Empire, the Denarius contained only 0.02% silver and was no longer universally accepted as a medium of exchange or a store of value.
There are numerous other examples of failed experiences in fiat money, the “Flying Money” of China, The Livres and Assignats of France. The German Mark under the Weimar republic deserves special mention, since this period influences Germany’s thinking today. Post-World War I Weimar Germany is infamous as an example of the greatest hyperinflation ever. The Treaty of Versailles that ended World War I punished Germany by forcing it to make reparations. The only way Germany could meet its obligations was by running the printing press. Inflation got so bad that Germans were using stacks of Marks to heat their furnaces and used wagonloads to buy bread. In 1919, 12 German marks equaled one U.S. dollar. By 1923 the rate was 4.2 trillion marks for one U.S. dollar. In more recent history we have had currency shocks in Argentina, Finland, Italy, Norway Mexico, Thailand, Russia, Turkey and there are many more examples.
So what’s in the future for the dollar?
History teaches us that when governments come under financial pressure they can never resist printing money to pay for debts, be it for wars or excessive spending. Gold is the only currency which has no liability attached to it, nor can it be printed, counterfeited or reproduced (well, silver and platinum are exceptions here). Among its many stellar qualities is the fact that it cannot be destroyed by fire, water or time. Gold doesn’t expire, it is mobile, divisible and internationally accepted for the last few thousands of years.
Over time gold has represented an excellent investment that holds it value in real terms. In particular, gold appreciates during periods of high inflation and financial instability. As there is limited supply of gold it cannot be printed to finance government deficit spending. Gold can act as a critical hedge both against inflation and a deflationary financial collapse.
Precious metals are in a secular bull market and are likely to move much higher eventually, but there’s a huge difference between “eventually” and “now” and a decline may be seen first.
So, let’s begin this week's technical part with the analysis of the Euro Index. We will start with the long-term chart (charts courtesy by http://stockcharts.com.)
Euro and USD Indices
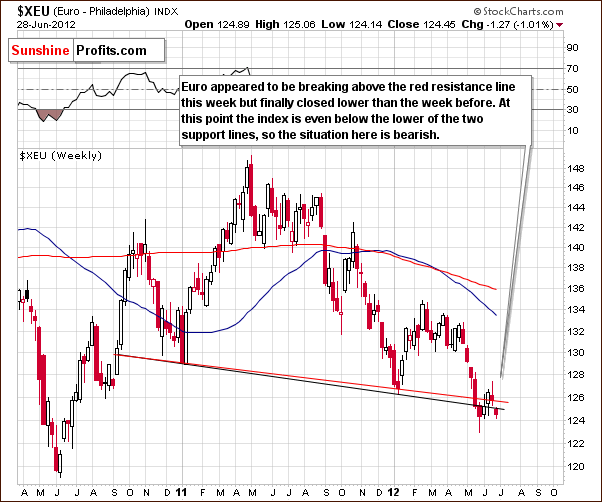
We begin this week with a look at the long-term Euro Index chart. Last week’s attempt to move above the neck level of the head-and-shoulders pattern was invalidated within the week. The index has now declined below both the neck level corresponding to intra-day lows and the one corresponding to weekly closing prices. The situation is clearly bearish, and we view this formation as being completed. Further moves to the downside are underway and likely to continue.
Friday’s rally (not seen on the above chart) didn’t take euro above the declining red line, so the above remains up-to-date. At this point we see a consolidation after a significant decline and below the red resistance line.
We’ll see and discuss the corresponding move in the USD Index next.
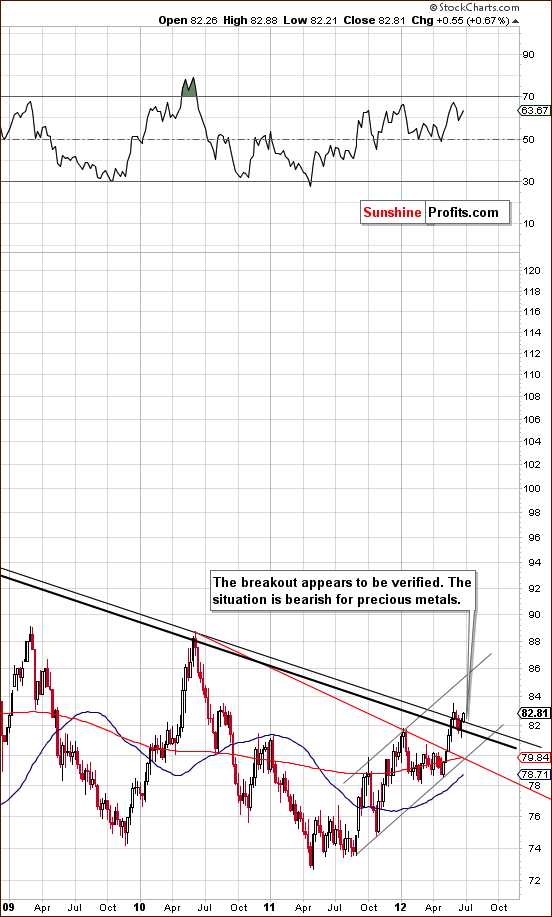
In the long-term USD Index chart (please click the above chart to enlarge), we see that the recent breakout has been verified, and the index continues to move higher. The declining long-term resistance lines have been surpassed and are now support lines. The next important resistance is in the 88-90 range – much higher. Clearly, we have a significant upside potential here.
As a result of Friday’ early decline in the USD Index, we see another move down - to the upper resistance line, close to the 82 level. This level held and the bullish trend remains in place.
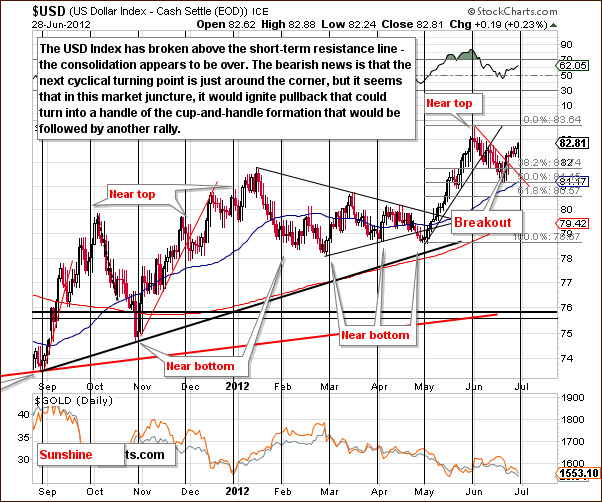
In the short-term USD Index chart, we see a few signs that a period of some consolidation is possible in the week ahead. A cyclical turning point is fast approaching. Now the index declined when the previous turning point was reached in early June, but this time some consolidation is likely. Perhaps the handle part of a bullish cup-and handle pattern could form; such a development would very likely be followed by a continuation of the rally.
While we created the above chart based on Thursday’s closing prices, based on Friday’s early decline in the USD Index, it seems that the cyclical move lower could already be behind us. Consequently, if this small decline is something that “needed” to be seen before market was ready to move higher (because of cyclical turning point being in place), then it is not really a bearish sign at all.
Summing up, the situation in the USD Index is bullish and is likely to continue to put bearish pressure on precious metals prices. Lower values are likely for the Euro Index in the coming weeks as well.
It’s important to note here how precisely the recent period of decline and quick reversal to the upside in the USD Index translates to gold prices. Taking the whole June into account, it seems that one index point corresponds to approximately a $40-$50 move in the price of gold (note: this doesn’t have to hold on a daily basis). It seems therefore that if the USD Index moves to 88 or so, gold prices will likely decline to the $1,300 to $1,350 price range. This is not a precise target, but rather an estimate of possible gold price declines based on the anticipated USD Index rally. Similarly, silver’s price would likely move to about the $20 level in this scenario.
General Stock Market
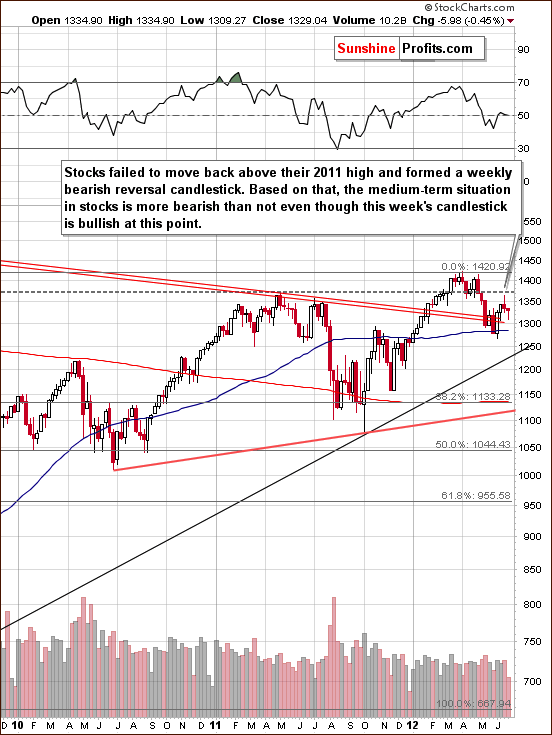
In the long-term S&P 500 Index chart (please click the above chart to enlarge), prices moved lower this week and formed a bearish reverse candlestick, although an intra-day rally was seen late on Thursday. The situation here remains a bit more bearish than not as stocks have been unable to move above the level of last year’s highs. Little change is seen in the general stock market this week from the long-term perspective.
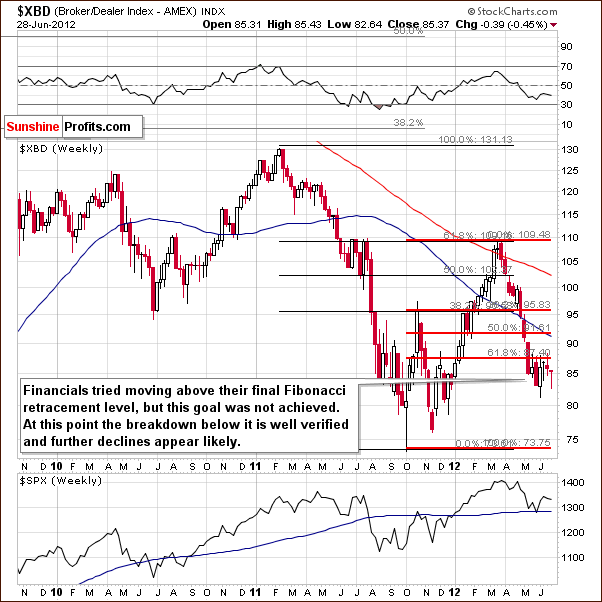
In the Broker Dealer Index chart (a proxy for the financial sector), the index remains below the lowest major Fibonacci retracement level, and the breakdown is now well verified. At this point, the implications here remain bearish.
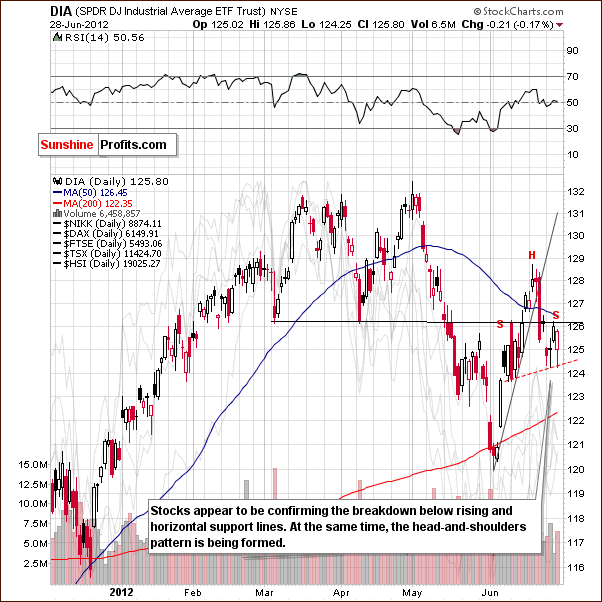
In the short-term DIA (a proxy for the Dow Jones Industrial Average), the ETF trust has broken below two support lines, the horizontal based on previous bottoms and the rising support line based on intra-day lows. A head-and-shoulders formation appears to be underway and it seems to have a good chance of being completed. Of course, this has bearish implications for the weeks ahead.
Summing up, the situation in the general stock market appears bearish for both the short and medium term. The immediate outlook (for the next day or two) is a bit unclear.
Crude Oil
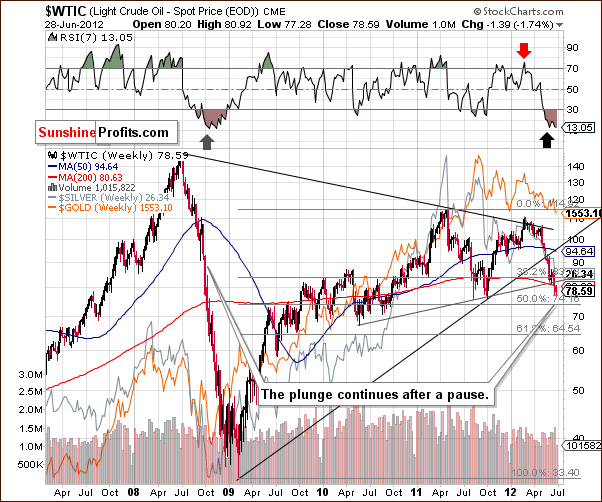
We now look at the crude oil price chart where we see further declines this week. It does not seem that the moves to the downside are over yet, and a price level of $64.50 or lower appears possible in the coming weeks. The implications of these plunging crude oil prices are bearish for gold, as oil prices and those of the yellow metal have pretty much moved together in 2012.
Correlation Matrix
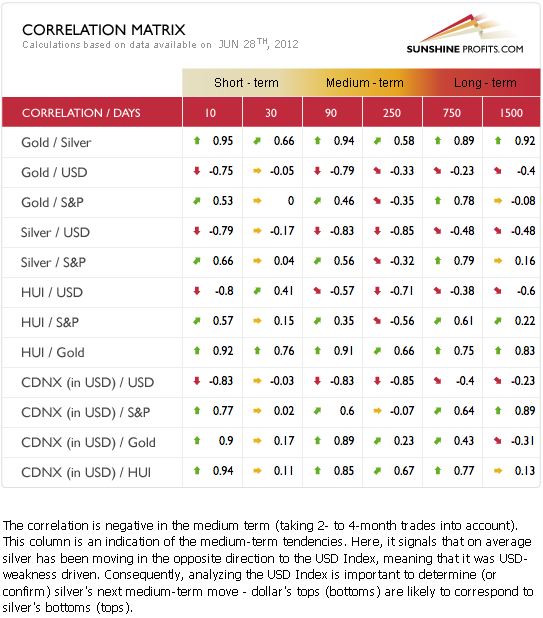
The Correlation Matrix is a tool which we have developed to analyze the impact of the currency markets and the general stock market upon the precious metals sector. This week, the short term correlations appear rather weak. Metals did not respond immediately to all the signals from the currency and general stock markets and price moves generally have been somewhat erratic.
The medium-term coefficients of the precious metals this week hold pretty much true to form as they are negative with the USD Index and positive with the general stock market. The currency markets continue to be more important at this time as has been the case for the past month or so. This is true although not really visible on a day-to-day basis. Significant moves to the upside in the USD Index are likely to be devastating to precious metals prices.
Gold
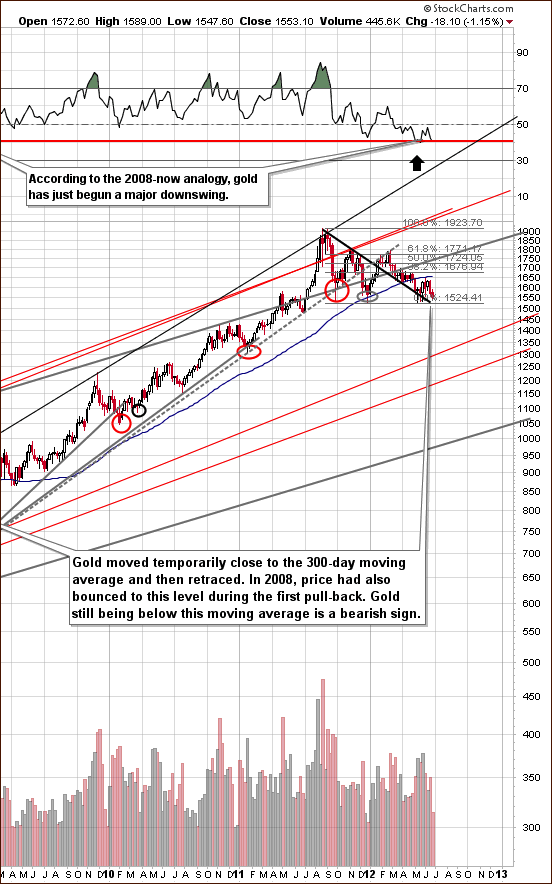
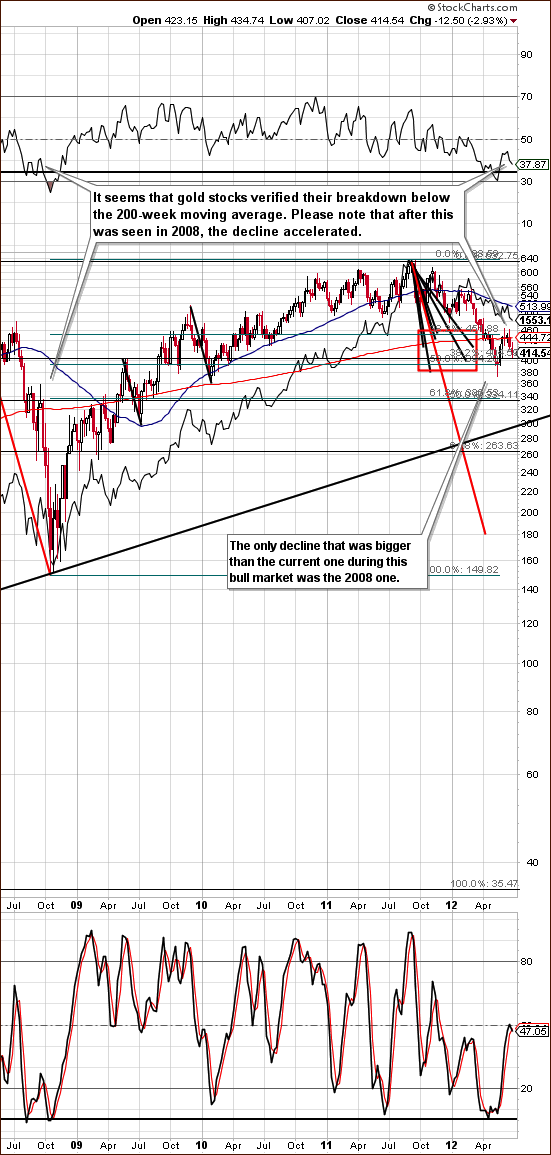
In the very long-term gold chart (please click the above chart to enlarge), not many changes were seen this week although we do see RSI levels suggesting the situation is similar to 2008. Indications are that a significant decline is underway right now, and it’s likely that the period ahead will be quite volatile.
We expect volatility, especially if gold’s price moves below the $1,500 level. This would be an important development, because it would surpass the two recent local bottoms and the psychological round number of $1,500. Many would likely run for the hills causing the decline to accelerate.
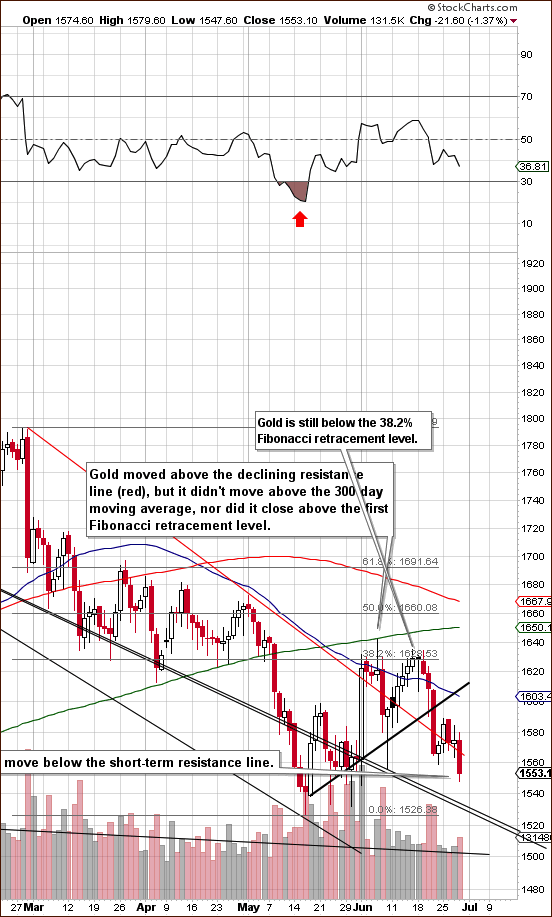
In gold’s short-term chart (please click the above chart to enlarge), we see another move below the declining red support line which has now become a resistance line. The previous attempt was invalidated as prices consolidated below the rising black support line after the breakdown, so we now expect another move to the downside here. It is possible that prices will approach $1,500, likely consolidating between $1,530 and $1,500 before moving lower. This could be very much in tune with the USD Index trading patterns discussed earlier with the cup-and-handle pattern over there corresponding to a consolidation here.
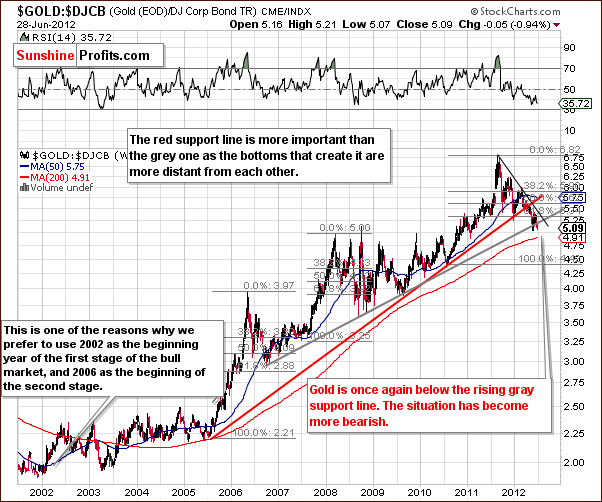
In the gold to bonds ratio chart, the situation has deteriorated from the long-term point of view this week. The ratio moved lower and is now more visibly below the rising gray support line. The situation is bearish to a greater extent than it was last week.
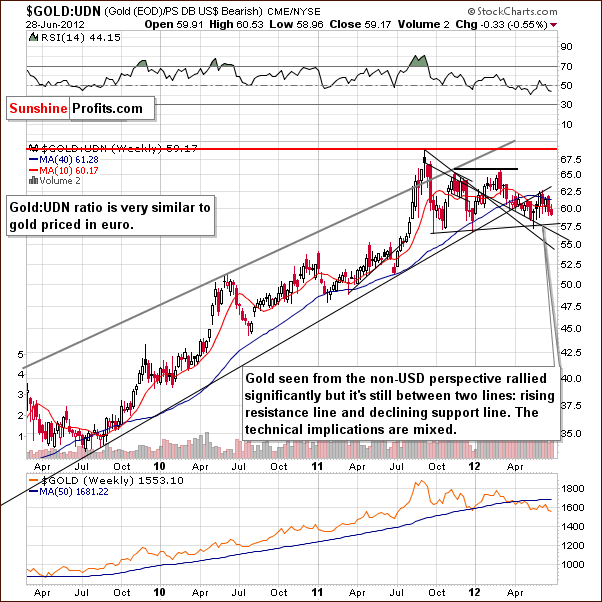
In this week’s chart of gold from a non-USD perspective, we see no significant changes. Price levels remain between the rising resistance and declining support lines as has been the case for a number of weeks now. The recent sideways trading patterns continue to have mixed implications.
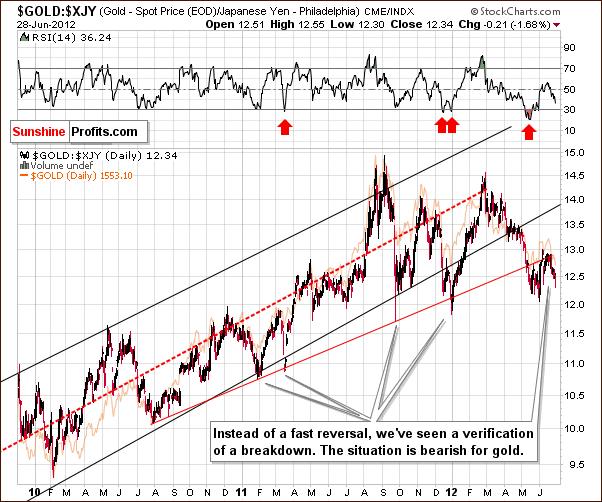
Looking at gold from the Japanese yen perspective, it appears that the breakdown below the red support line has been verified, and this line will now provide resistance to any turnaround in prices here. The medium-term trend is to the downside, and the outlook remains bearish here.
Summing up, the outlook for gold is bearish for both the short-term and medium-term point of view. With this week’s developments, it is in fact a bit more bearish for both perspectives than was the case last week.
Silver
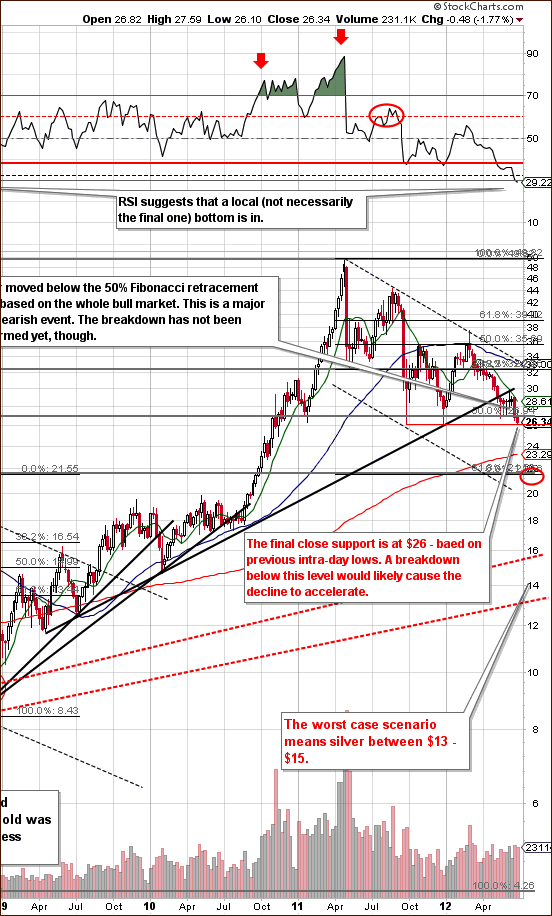
In the very long-term chart for silver (please click the above chart to enlarge), one of the major developments seen this week is a move below the 30 level in the RSI. The only previous time that this was seen was in 2008, and it corresponded to an initial bottom, not the final one. So, are we likely to see a quick bounce based on the RSI value? Not necessarily, because there was just one similar case in the last decade and making conclusive calls based on just one case is risky. Yes, the RSI is extremely oversold at this point and it makes the situation bullish. However, the preceding move was much less sharp this time than it was the case in 2008. Additionally, the time that it took for the RSI to move to this level from the previous top is now 2 times bigger than it was the case in 2008. Consequently, comparing the values of the RSI indicator alone might be misleading, and the bullish implications here are rather weak in our opinion.
This week, silver’s prices moved below the 50% Fibonacci retracement level, and this is a big deal, something seen only twice in the past. In both those cases, immediate reversals were seen on a weekly basis but such is not the case this time. If silver closes the week below $27 (we now see silver at $27.04, so it's quite likely), the implications will then become even more bearish as we will have a weekly close below this important support line.
Only one more support level based on intra-day lows is close and it’s a $26. If this line is broken and the move confirmed (for instance by 3 consecutive closing days below it), prices will likely move even lower and the move to the downside accelerate. A confirmation from gold would be required for the outlook here to be described as “very bearish”. The initial downside target level is around $21, a price range (red ellipse on the chart above) which also corresponds to the 2008 high.
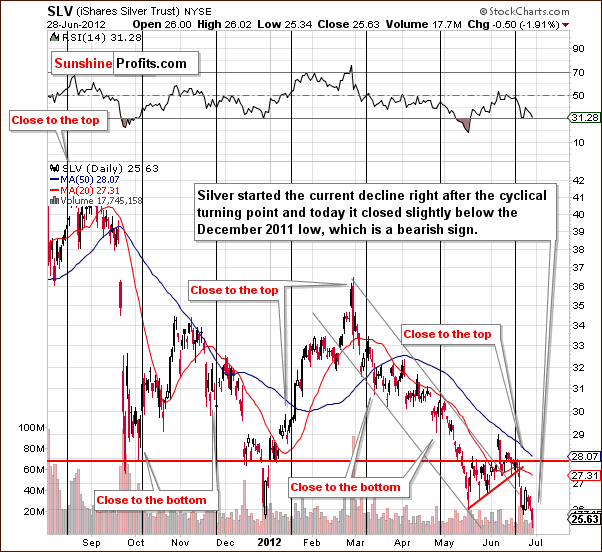
In the short-term SLV ETF chart, we see what we’ve not seen in the long-term chart. Prices actually closed a few cents below the December 2011 bottom and this could be viewed as another breakdown (last week closed lower than 2010.) The situation could now be seen to further deteriorate from here. We could also see further consolidation – the immediate term is unclear, but it’s quite likely that the next week will prove bearish for silver.
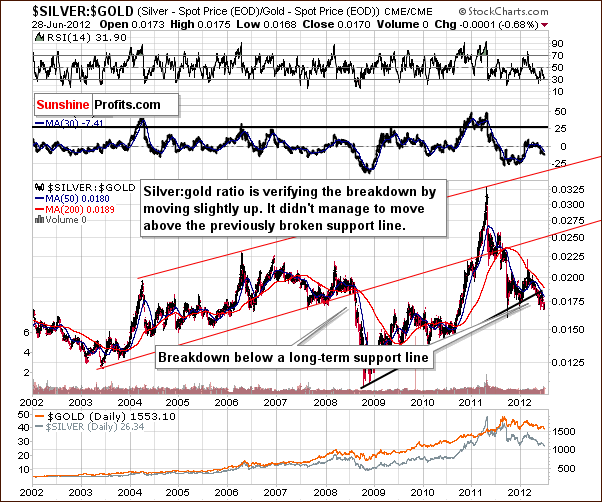
In the silver to gold ratio chart, we have a confirmation of the signals seen in this week’s other silver charts. The breakdown is clearly visible in this long-term perspective, and the implications are bearish for silver and the precious metals sector overall.
Summing up, the short and medium-term outlook is bearish for the white metal. The immediate outlook (next day or two) is unclear as a move to the upside is possible by the end of the week.
Gold Mining Stocks
In this week’s long-term HUI Index chart (please click the above chart to enlarge), we see that miners declined after reaching the 200-week moving average. This suggests that the consolidation and pullback is over, and right now we’re likely to seen significant price declines. It’s also probable that these declines will be sharper than any seen previously this year.
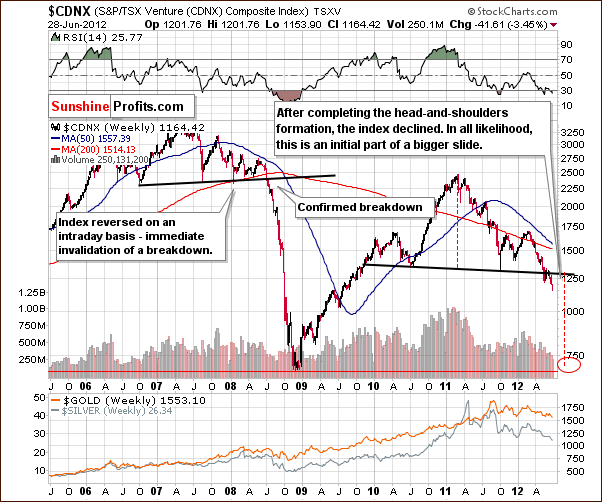
In the Toronto Stock Exchange Venture Index (which is a proxy for the junior miners as so many of them are included in it), we have confirmation of the previous chart. Prices have moved below the neck level here in the bearish head-and-shoulders pattern. A downside target level has been created based on the size of the head in this formation and it is close to the 2008 low. It’s also much lower (40% or so) than current price levels.
Investors are encouraged to exit juniors if this has not already been done. It seems that hedging or selling, preferably hedging, is a good move to make at this time. We suggested doing so a few weeks ago, but if you didn’t proceed at that time, it may be a good idea to reconsider it now.
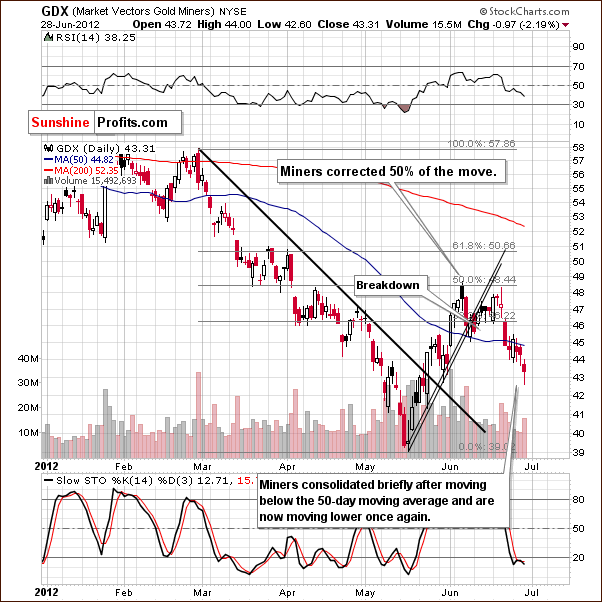
In the GDX ETF chart, recall that we previously mentioned that this ETF could move to $42 and taking profits on the short position would be advised. At this market juncture, we no longer suggest taking profits at that price level. Holding short positions appears to be much better because further weakness is likely if gold and silver decline further. The situation is clearly not bullish today. The miners, metals and stocks all appear quite vulnerable at this time.
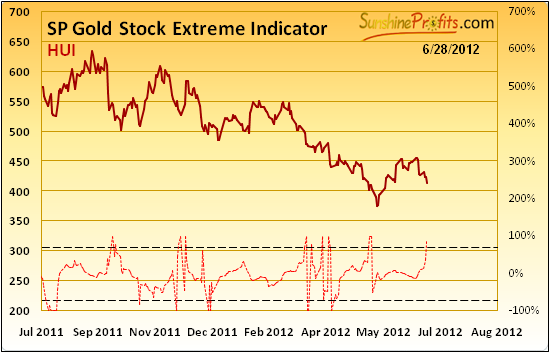
We have just seen an extreme reading in our SP Gold Stock Extreme Indicator and based on that caution is required. This signal has bullish implications, however the implications here may be short-lived based on everything else that we wrote in today’s update so far.
While this indicator has been very reliable since 2008, it didn’t mark the final bottom earlier this year – only a short-term consolidation (which is one of the reasons we believe that the precious metals market is not in the normal “bullish mode” now), please note that it still may “work” this time.
So, based on the above chart, a small rally seems likely – but metals have already moved higher on Friday based on euro’s rally. Consequently, the rally that the indicator suggested may already be after us or at least most of it. Naturally, we are writing this before markets open, but since gold is $26 higher than yesterday, then it’s quite certain that miners will open higher (unless gold declines in a few hours that is).
Summing up, the outlook for miners remains bearish and it seems that holding short positions in the precious metals mining stocks would prove profitable in the weeks ahead. The most important reason here is the massive head-and-shoulders pattern in the TSX Venture Index. However, a temporary move up on Friday will not surprise us.
Letters from Subscribers
Q: I have my own ideas as to why gold is currently falling, and I think this is not very evident from a technical analysis standpoint. We have a situation of lower GDPs, ineffective Central Bank liquidity (stimulating only a relatively small global financial sector), and monetary easing as the only game in town (i.e. not addressing structural fiscal problems). This all means that the safe haven aspect of gold (so far conspicuously absent), will kick in. When it does that will rapidly send gold higher, and then the dynamics in gold will shift significantly.
A: Generally yes, we believe that at some point the save haven quality of gold will kick in and the precious metals market (not only gold) will move back into bullish mode. However, we believe this is unlikely to be a sudden jump. It is more likely to be a more or less regular bottom followed by a rally interrupted by corrections. At some point the parabolic upswing will start, but still, that's not something that we expect to see very soon. In the meantime, the technical analysis will provide us with ability to enter the market close to local bottoms and exit trades close to local tops.
Q: I think that the USD Index despite making a breakout needs to consolidate and trade in a range for a certain period of time. A negative trend may continue if there is no consolidation.
A: We respect your opinion; however we believe that a 50% correction of the previous rally (as we have seen this month in the USD Index) is sufficient for the market to gather strength for another move up. Please note that in 2008 and 2010 the USD Index rallied significantly without significant corrections.
Q: Can you explain why silver in particular is rising while stocks are falling? Your previous updates indicated these two are correlated. Also, silver has formed a triangle. Is that a bullish development or bearish? Thanks.
A: A single day can rarely be explained. Actually, technical analysis is something that doesn't really focus on the "why" aspect. In the short term, markets move lower because someone is selling or nobody is buying, and they move higher because someone is buying. We could try to guess about the events that happened on the day that silver rose and stocks declined, but that's just not very informative and doesn't imply anything going forward, so we won't do it.
The correlations that we analyze imply what is likely to take place on average, not necessarily each and every day.
Summary
The Euro Index moved lower this week and appears to be on the verge of significant further declines. A strong move to the upside will likely be seen soon in the USD Index. This combination has significantly bearish implications for gold, silver and the mining stocks.
The technical indicators across the precious metals sector are unfavorable at this time, especially for silver. It seems best to be mostly out of long-term precious metals investments, and betting on lower values seems to be a good idea today.
Once we have the expected breakdown in gold and silver prices, (silver below $26 and gold below $1,500) and these breakdowns are confirmed, we will likely suggest increasing the size of your short positions.
This completes this week’s Premium Update. There will be no Premium Update next week due to your Editor’s upcoming travel schedule. Our next Premium Update is therefore scheduled for Friday, July 13, 2012.
We, at Sunshine Profits will not be taking the next week off, however. We will continue to watch the precious metals markets closely and publish/send our Market Alerts or Mid-week Updates if the situation requires it. As is always the case, we pledge to keep you “covered”. Our own short, speculative position has not been closed, and it will not be closed until you are notified about a change in our views on the market.
Thank you for using the Premium Service. Have a profitable week and a great weekend!
EDITED: With gold at $1,592 and silver at $27.75, we continue to believe that the precious metals market is in the medium-term downtrend. The main reason is that today's rally was ignited by weakness in the USD Index, which was driven by an increase in the value of euro. As the key support levels in the USD Index remain intact, the situation remains bullish for the dollar and today's moves should be viewed as counter-trend pullback (of course when we're talking about the medium-term trend). We will keep you updated, should this change.
EDITED #2: One more comment for today's session. USD Index moved to 81.5 and gold moved to $1,595. When USD Index was close to this level in mid-June, gold was trading around $1,630. So, with USD at approximately the same level, gold is $35 lower, which is actually a bearish phenomenon.
Przemyslaw Radomski

