Gold futures closed higher edging past the $1,600 mark Wednesday, extending their advance to a fourth session - perhaps traders considered prospects for further quantitative easing by the Federal Reserve and other central banks, including the Bank of England, the European Central Bank and the Bank of Japan.
Thursday Comex gold futures prices ended the U.S. day session near unchanged in subdued trading and today Gold edged up extending its winning streak to a sixth session as sluggish U.S. data boosted hopes for monetary easing.
With an agreement last weekend to bail out Spain’s struggling banks, Europe again avoided financial chaos but it still faces far bigger challenges that threaten the Continent and with it, the world economy, namely Greece, the tail that is wagging the dog. It’s the old “domino theory” that has European leaders up at night.
Greece, a country that represents less than 2% of the eurozone (in terms of GDP), prepares for elections in two days that could lead to its withdrawal fromthe eurozone with financial repercussions across the globe. According to the IMF, Greece’s gross domestic product will contract this year by 4.7 percent. The country is so dysfunctional that the employees who run the elections are threatening to strike if they are not given more pay. Things are quickly disintegrating in the country that gave the world the concept of democracy with incidents of violence and vigilantism. If you want to see how sad it is, watch this horrifying video of the televised debate among representatives of the seven Greek parties, including the neo Nazi “Golden Dawn” party. In Germany in the 1930s, economic hardships contributed to the rise of a murderous government in Germany and the death of democracy in Europe.
A lot of private money has already fled Greece, while its deeply depressed economy and dwindling tax revenues threaten to sink the country even deeper in the hole. Even if Greece elects a government willing to try to live up to the terms of its 130 billion-euro bailout deal, there are very strong doubts if Greece is capable of fulfilling its obligations. There are plenty of reports about how Greek citizens avoid paying taxes, retire at the age of 50 with full pensions and how fraud and corruption are endemic.
It is hard to calculate the costs if the new Greek government reneges on the bailout Greece negotiated with its European lenders a few months ago. Europe’s big fear is contagion — a virus of financial panic that could spread far beyond Greece. Spain’s leaders have long blamed Greece’s problems for having caused the conditions that helped undermine Spanish banks.
In an op-ed published on the Financial Times website Friday, economist Nouriel Roubini and historian Niall Ferguson wrote that the current approach to bailouts in the eurozone only makes matters way worse. They ask “It is one minute to midnight in Europe?”
The European Union was created to avoid repeating the disasters of the 1930s, but Germany, of all countries,has failed to learn from history, they said. As the euro crisis escalates, Berlin should remember how the banking crisis of 1931 contributed to the breakdown of democracy across Europe. Action is urgently needed to stop history from repeating itself.
The failure of German public opinion to grasp the dire state of affairs in Europe today is inviting a repeat of precisely the crisis of the mid-20th century that European integration was designed to avoid.
With every increase in the probability of a disorderly Greek exit from the monetary union, the pressure on the Spanish banks increases and with it the danger of a Mediterranean-wide bank run so big that it would overwhelm the European Central Bank. Already there has been a substantial re-nationalization of the European financial system. This centrifugal process could easily continue to the point of complete disintegration.
We find it extraordinary that it should be Germany, of all countries, that is failing to learn from history. Fixated on the non-threat of inflation, today's Germans appear to attach more importance to the year 1923 (the year of hyperinflation) than to the year 1933 (the year democracy died). They would do well to remember how a European banking crisis two years before 1933 contributed directly to the breakdown of democracy not just in their own country but right across the European continent.
The way out of this crisis seems clear, say Roubini and Ferguson.
First, there needs to be a program of direct recapitalization – via preferred nonvoting shares – of eurozone banks, in the periphery and the core, by the European Financial Stability Facility and its successor, the European Stability Mechanism.
The current approach of recapitalizing the banks by the sovereigns borrowing from domestic bond markets – and/or the EFSF – has been a disaster in Ireland and Greece: it has led to a surge of public debt and made the sovereign even more insolvent while making banks more risky as an increasing amount of the debt is in their hands.
Europe also needs to prevent a run on its banks with an EU-wide system of deposit insurance.
The other major item missing from Europe's plan to clean up the euro mess, according to Roubini and Ferguson, is a change of stance from Germany and the core on moving closer to fiscal union in the form of eurobonds or some other mechanism.
Meanwhile, reflecting a growing weakness in the global economy, the price of a wide array of commodities has been pushed down as a result of the Eurozone crisis and the slowdown in China, India and the United States.
Oil prices have declined by about 12 percent over the last month while corn, copper, lead, cocoa and coffee have all dropped by more than 5 percent. The prices of many other commodities, among them corn, cocoa, oats, cotton, rubber, coffee, aluminum, silver, zinc and nickel are all more than 20 percent lower than they were a year ago.
According to some estimates, investors took nearly $3 billion from commodities listed on American and European exchanges in May and put the money into Treasury bills and other government debt. That followed a $1 billion withdrawal in April.
But gold, normally a commodity that soars with economic uncertainty, is higher, but so far this year, only by about 3 percent over the last year. But that can change, and fast. The question is what type of medium-term move will follow.
Let’s turn to this week’s technical part with the analysis of the US Dollar Index. We will start with the long-term chart (charts courtesy by http://stockcharts.com)
USD and Euro Indices
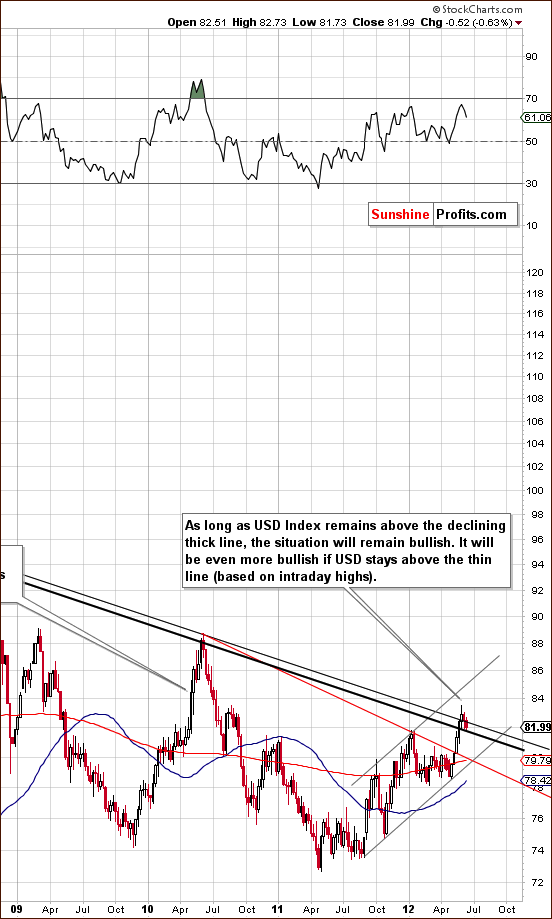
We begin this week with a look at the long-term USD Index chart (please click the above chart to enlarge). There is little to comment on here this week, as the index is still above the declining support line. The breakout is still being verified and the index appears to be gathering strength for additional moves to the upside. The chart remains bullish.
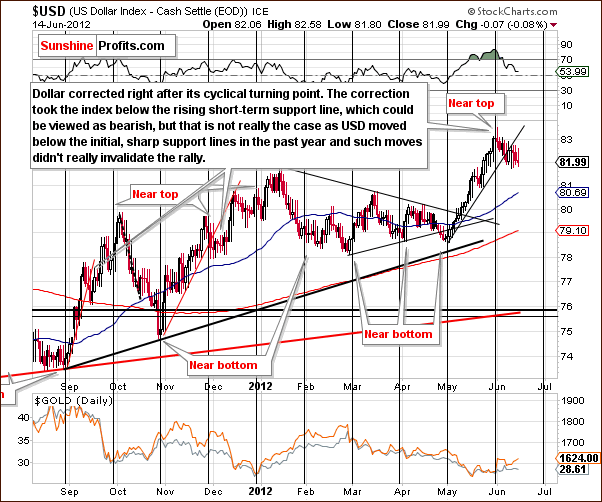
In the short-term USD Index chart, we see that a period of consolidation began just after the cyclical turning point was reached. The consolidation is still underway and we note that in previous rallies (last September and also November-December 2011), periods of consolidation two weeks long are not uncommon. Even after the index broke below the initial rising support line here, the bullish trend was not be invalidated and we don’t really see the breakdown as a true invalidation here either. The breakdown by itself is therefore mildly bearish on the short-term picture.
The initial breakdown being seen now could very well be followed by another rally as we have seen in the past. Remember that when the long-term and short-term outlooks conflict, long term rules, so the outlook remains bullish for the dollar this week.
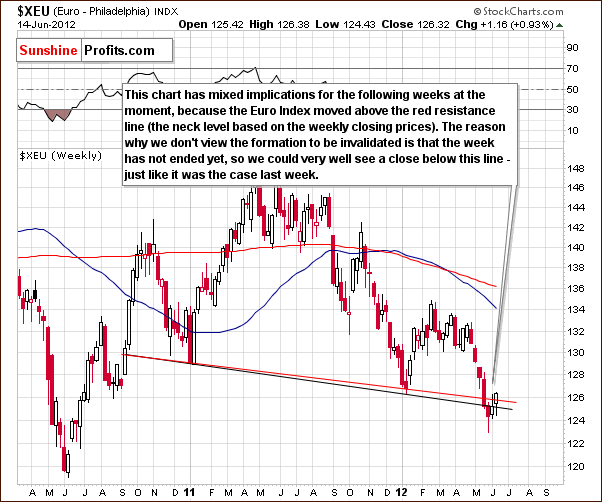
In the long-term Euro Index chart, we see the index has moved above the neck level of the head-and-shoulders pattern. It may seem that the pattern is being invalidated, but since it is based on weekly charts, a weekly close above the neck level is required for invalidation. Much depends on where the index closes the week on Friday. This applies to the USD Index as well.
Summing up, a lot can happen given the Greek elections, but at this point, the outlook based on the technical picture is still more bearish than not for the Euro Index and, conversely, bullish for the USD Index.
General Stock Market
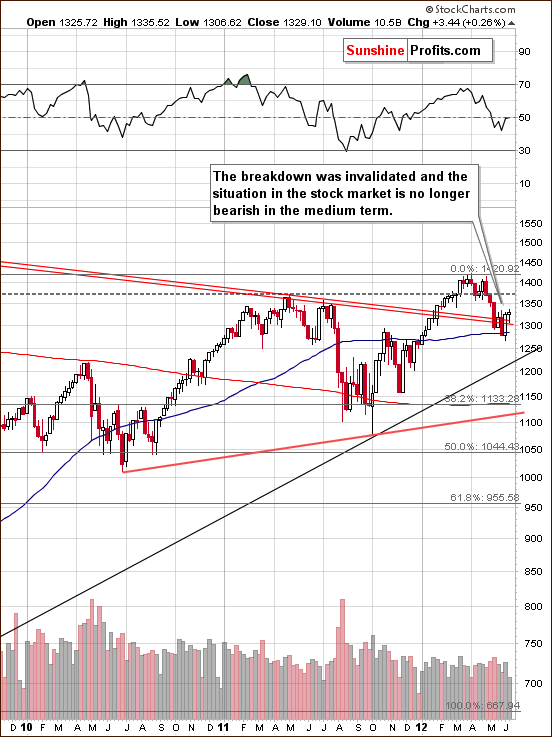
In the long-term S&P 500 Index chart (please click the above chart to enlarge), the situation improved somewhat this week. Stocks rallied and moved above the declining support line and invalidated the recent breakdown. This is a bullish signal. We are cautious however, as different signals are seen in our other stock charts this week.
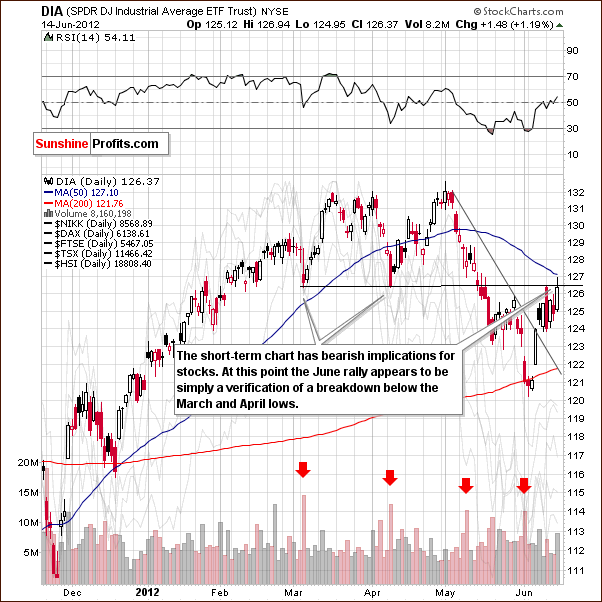
In the short-term DIA (a proxy for the Dow Jones Industrial Average), we see higher prices this week. However, when viewed from this perspective, the recent rally is a verification of the May breakdown, since prices are still below the level of the March-April lows. The situation is clearly not as bullish as it first appears.
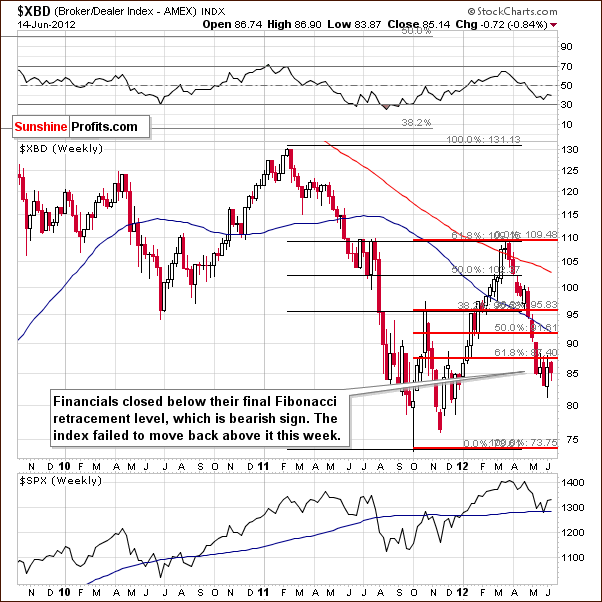
In the Broker Dealer Index chart (a proxy for the financial sector), we have no invalidation of the recent breakdown. Verification of the move below the lower 61.8% Fibonacci retracement level continues. This is a bearish development for the financials as well as for the whole stock market.
Summing up, the situation for the general stock market is mixed with a small bullish bias. Further analysis of strong vs. weaker companies is not encouraging. For example, this week Apple, a fundamentally strong company, has really not done much whereas Facebook (much weaker) has rallied. Situations such as this contribute to the mixed outlook for stocks which seems to prevail at this time. The long-term chart has bullish implications, but that’s it as far as bullish case is concerned.
Crude Oil
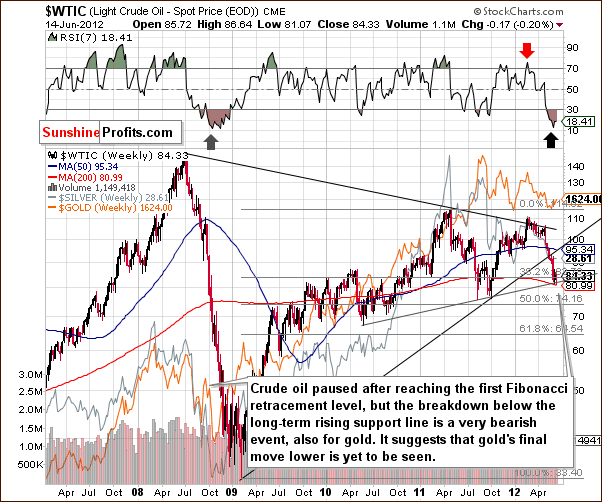
We now look at the crude oil price chart which consolidated a bit this week after prices moved below the long-term rising support line. Prices declined to the first Fibonacci retracement level which was also close to the medium-term support line and the 200-week moving average.
The consolidation seen here is not really surprising and the breakdown below the rising support line is more important. The short-term trend for oil prices is likely to remain to the downside, and this is also bearish news for precious metals as the actions seen in two markets resemble the 2008 pre-plunge consolidation. This further suggests that gold’s recent rally is probably just a counter-trend phenomenon rather than a sign of strength.
Precious Metals Correlations
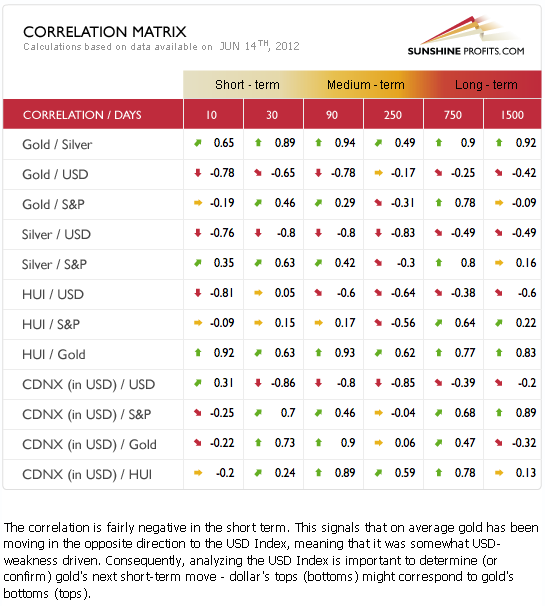
The Correlation Matrix is a tool, which we have developed to analyze the impact of the currency markets and the general stock market upon the precious metals sector. No significant changes are seen this week. The traditional relationship of precious metals moving in the opposite direction of the USD Index remains in place. The general pattern of the metals moving in tune with stocks also continues, however to a smaller extent.
Gold prices are more closely linked to the currency markets than to stocks at this time. The bullish outlook for the USD Index therefore has bearish implications for the precious metals and is clearly the biggest threat to any rally in gold, silver, mining stocks or platinum prices at this time. The coefficients between gold and the general stock market deteriorated a bit this week. Our focus is and should remain on the currency markets.
Gold
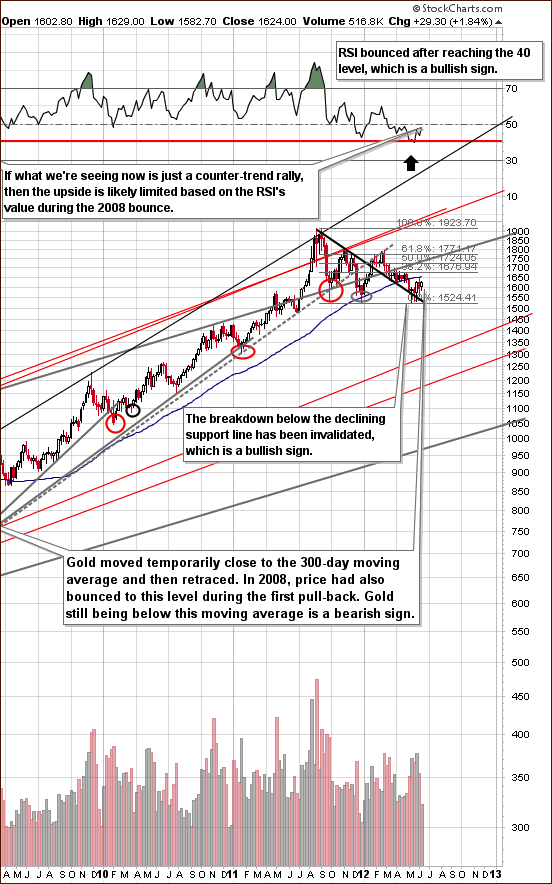
In the very long-term gold chart, there are almost no new developments this week. One exception is the RSI level which has moved higher and is now close to the 50 level. This is quite similar to the 2008 bounce in terms of the size of the rally. The decline back then was sharper and so was the bounce. Since the decline was milder this time, the same could be the case with the pullback and it could actually be over already or close to being over.
The jury is still out as to whether the bearish scenario prevails from here. More comments on this topic will appear later in this week’s Premium Update. Other than that, the situation appears quite mixed with a bullish breakout above the declining support-resistance line being followed by a quick bearish turnaround once the 300-day moving average line was reached.
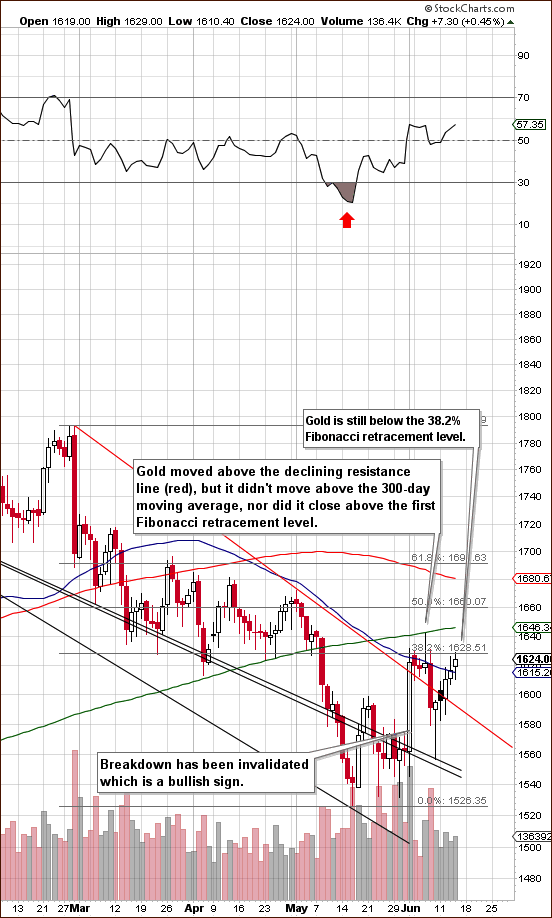
In gold’s short-term chart, we see that prices are once again close to the Fibonacci retracement level. Note that previous attempts to move above this resistance level failed and, in fact, prices immediately retraced.
Generally, the recent up-and-down price movement reflected the opposite of the move seen in the USD Index. Precious metals investors and traders appear to be monitoring the index with great precision. This seems to be magnifying the move to a considerable extent. This is actually quite interesting as it shows that investors and paying attention to the technical picture in USD Index. Once USD appears to be breaking below the 82 level or so, gold rallies visibly (even though the moves in USD are really small). Whenever USD appears to be confirming the breakout and moving higher, gold declines.
Therefore, it is important to note that the medium-term outlook for the USD Index is bullish which clearly implies a bearish situation for gold.
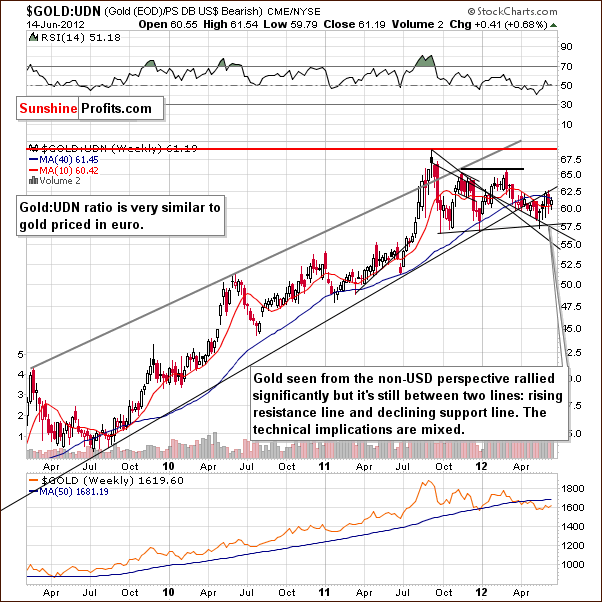
In this week’s chart of gold from a non-USD perspective, there is little to comment upon. Gold prices continue to waver between the long-term rising resistance line and the medium-term declining support line. Overall, the picture remains rather mixed here.
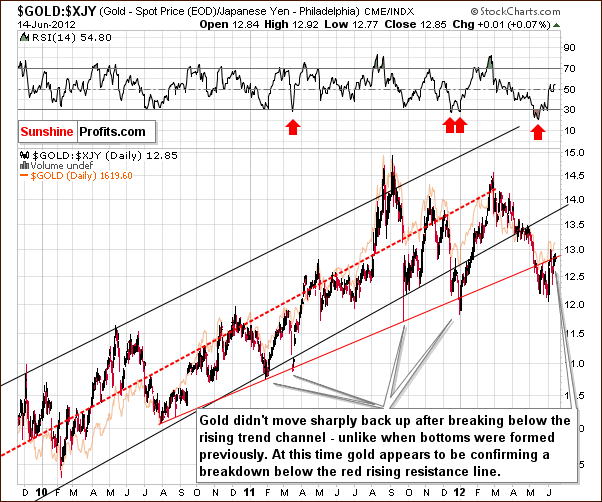
Looking at gold from the Japanese yen perspective, the implications remain bearish as prices have still not moved back into the trading channel. In fact, prices appear to be confirming the May breakdown below the rising red resistance line.
Recent price patterns have not been in tune with previous bottoms seen over the past couple of years. Unless a quick move is seen back into the trading channel, the signals suggest that a period of declining prices will likely be seen from here.
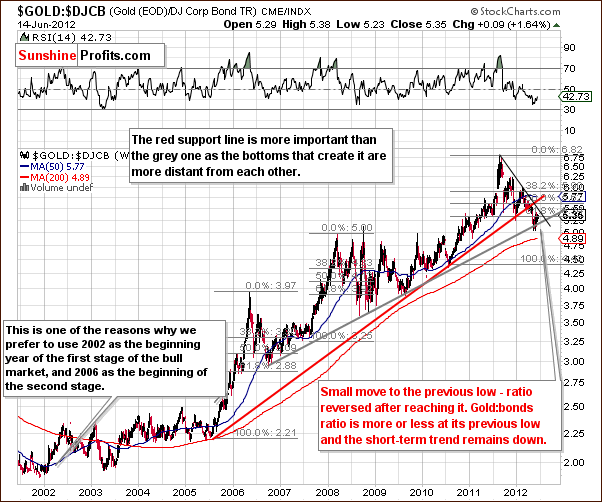
In the gold to bonds ratio chart, we see that the ratio is still close to the level of the early 2012 low. The short-term trend is definitely down, as it seems likely that the breakdown below the rising support line will hold. Overall, the implications from this chart are bearish this week.
Summing up, not much has changed this week with respect to the overall outlook for gold. Things still appear to be more bearish than not for the medium term. It does not seem that things are bad enough, however, to warrant exiting long-term positions at this time. Finally, the short-term situation is best described as a bit unclear at this time.
All-in-all, in the long term, it still appears to be 55% probability as to whether bigger declines will be seen.
Silver
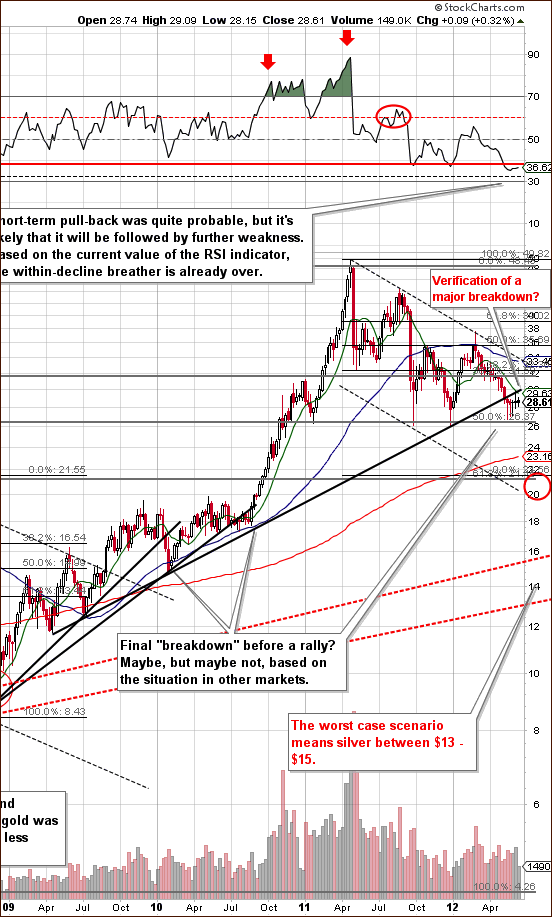
In the very long-term chart for silver (please click the above chart to enlarge), we see that the recent breakdown is being verified. Prices are below the rising support line and a noticeable change is seen this week in the upper part of the chart. The RSI level has moved close to the red horizontal line which indicated the confirmation of a breakdown in 2008.
Also, please take a look at the shape of the recent bottom and compare it to the major 2011 bottoms. Previous lows were immediately and sharply reversed, but this has not been the case this time. The breakdown is well-confirmed and along with the change in RSI level this week creates a situation which is quite similar to the period in 2008 which preceded the bigger part of the decline in prices. The technical picture for the white metal is worse than that of gold from a long-term technical perspective.
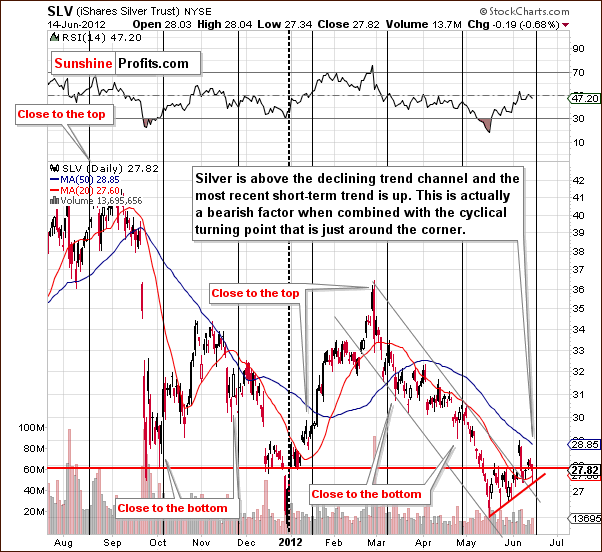
In the short-term SLV ETF chart, the outlook is bearish as well even though we have seen a breakout above the declining resistance line. This move was followed immediately by a sharp reversal to much lower price levels which are below the horizontal red resistance line – and silver is below this line also at the moment of writing these words.
The short-term trend since mid-May has been up (as indicated by the rising red support line on the above chart) but this actually has bearish implications since silver is approaching a cyclical turning point. Since the direction of the trend generally changes when a cyclical turning point is reached, more moves to the downside are likely ahead (within a week or two).
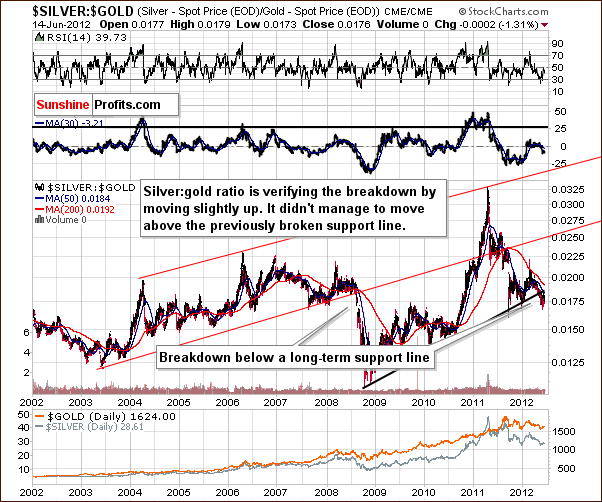
In the silver to gold ratio chart, we continue to see a clear confirmation of the breakdown below the long-term support line. Simply put, the outlook here is bearish.
Summing up, the situation for silver is quite bearish at this time and its technical picture more bearish than gold’s. It appears that staying out of positions in the white metal with long-term capital is a good idea today.
Gold Mining Stocks
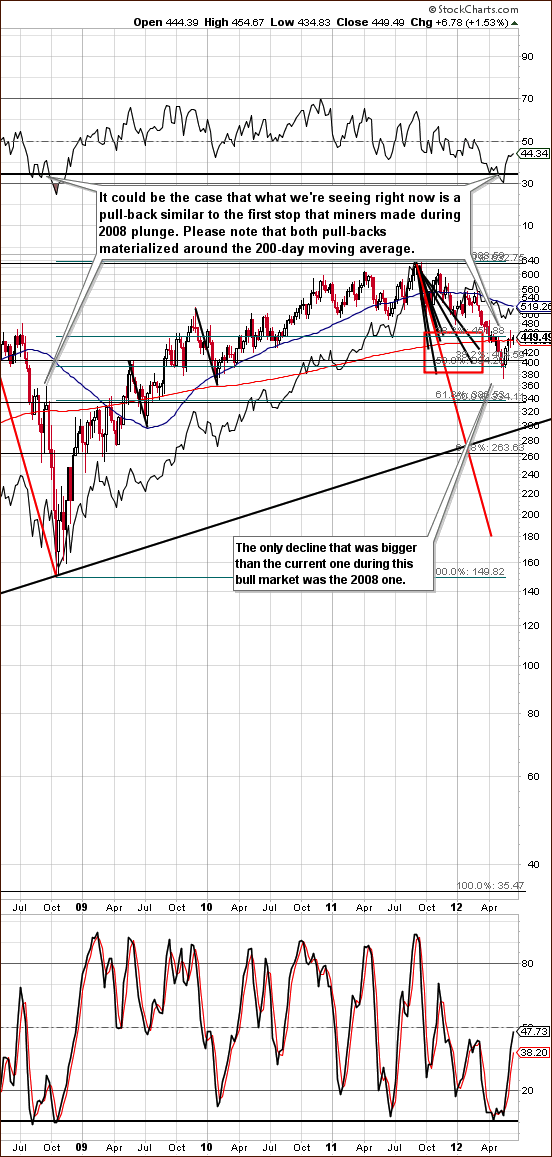
In this week’s long-term HUI Index chart, not much has changed for the gold stocks. This week the miners did not reach last week’s highs as they generally traded close to the 200-week moving average. This is more or less where the consolidation took place in 2008. Back then a major plunge followed and this could be seen once again. The size of the current bounce suggests that the period of consolidation could be over but – as it is the case with metals - much depends on the situation in the currency markets.
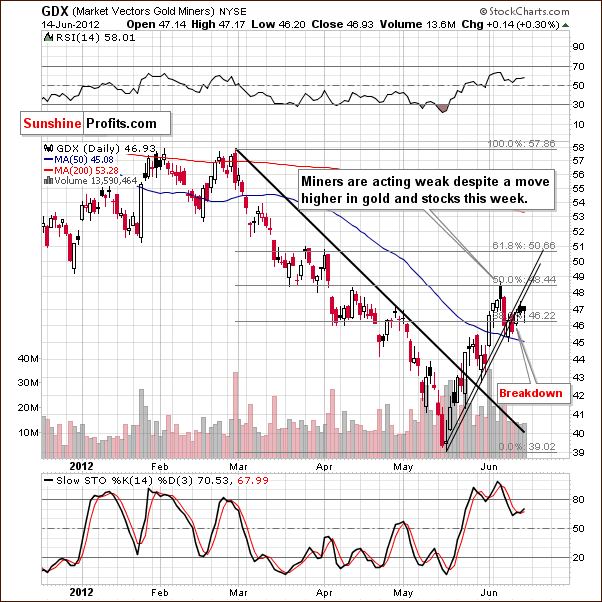
In the GDX ETF chart, we see a breakdown below the rising support line and this is a short-term bearish factor. Taking into account the negative seasonal tendencies, betting on lower mining stock prices appears to be a good idea right now. Our short-term downside target is $42 in the GDX ETF (400 in the HUI Index). Naturally, if a medium-term decline materializes, miners would likely move much lower than that.
Additionally, please note that miners corrected about half of the most recent short-term decline (early June) while gold corrected more than 80% thereof. Consequently, miners are once again underperforming gold – and this is taking place while S&P 500 is rallying. This is not a sign of strength in the mining stock sector.
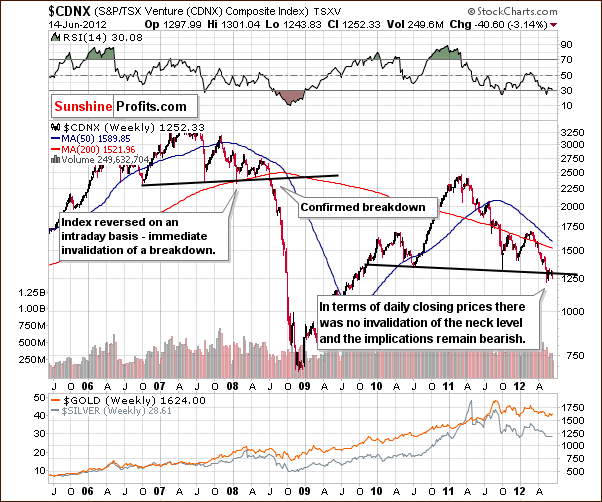
In the Toronto Stock Exchange Venture Index (which is a proxy for the junior miners as so many of them are included in it), we see that the head-and-shoulders pattern appears to have been completed and verified. A pullback to the neck level has been seen and declines from here are likely.
The situation is bearish and so are the implications to other stock markets. The TXSV Index can be considered as somewhere between gold and the general stock market and implications at this time are clearly bearish, especially for mining stocks.
Summing up, lower mining stock prices appear to be a good bet at this time and opening positions (if you don’t have them yet) with short-term speculative capital appears to be a good idea today.
Letters from Subscribers
Q: With the bailout of the Spanish banks this weekend, China starting to ease and the increasing chance of QE3 I think there is more risk being out of both stocks and precious metals.
A: On the one hand yes; but on the other hand, the market's reaction to the announcement of the bailout was quite weak. It wasn't even enough to push the Euro Index above the neck level of the head-and-shoulders formation (thus invalidating it). The only thing we saw was a verification of the breakdown below it. The technical picture didn't improve and lower values of the Euro Index are still the most likely outcome from here. It seems the resulting dollar strength would take precious metals lower. Also, please note that precious metals didn't move much higher after the announcement.
Q: What change would occur to credit card debts if the Fed devalued the dollar by 40%? I have utilized the extremely low or no interest rate offers on fixed credit card promotions to buy precious metals for almost a decade now. I’m aware of Ben Bernanke’s speech claiming his last move in a depression would be devaluing the dollar. I’m thinking the time is at hand.
A: From the nominal point of view (which would apply if you simply held these dollars at the time of the devaluation), nothing would change - the debt would still be there. From the real point of view (which is more applicable since you own precious metals) the value of the debt would decline because precious metals would likely soar after such a devaluation. Therefore, the value of the debt relative to the value of precious metals would decline. From the dollar (nominal) point of view, your investments would make a lot of money and therefore, it would be much easier for you to pay off the debt.
Q: Could you comment on this scenario: Romney wins in November and the Republicans take both the House and Senate. Romney has promised to fire Bernanke. The scenario: we have a change to a more conservative monetary policy coupled with significant deficit reduction. Wouldn't this trigger a huge recovery in the dollar (perhaps a termination of its long term decline)? Wouldn't this also see an end to the long term gold bull market (at least in the US relative to the dollar)?
A: Yes, such a scenario is possible and it is bearish for gold especially from the USD perspective. As we move closer to the elections and this scenario becomes more probable and the media talks about it more, people will take that into account while deciding whether or not to purchase gold, which is why gold may decline in the medium term. In fact, this is one of the more important bearish fundamental factors for gold (there are not many bearish fundamentals, though).
However, this does not have to stop the entire secular bull market in gold; in fact we doubt it, for two main reasons. The first is that such a move would likely be temporary. If the whole world starts devaluing their currencies and the US adopts a "strong dollar policy", the effects on the US economy in the medium term will be disastrous as exports will become uncompetitive. Unemployment would likely soar. Sooner or later people would probably want government to do something and that something would be inflationary. The bull market in gold would resume (if people had not already turned to gold by that point because of the economic turmoil).
The second reason is that the demand for gold from the rest of the world could well make up for the bearish bias resulting from a stronger dollar. The bull market would continue, but at a smaller pace.
All in all, we don't view the "US austerity scenario" are something sustainable given the situation in the rest of the world. We could see promises of that and even some moves in that direction, but we think this would only be a temporary phenomenon. Still, the threat of this scenario is something that could contribute to lower gold prices in the medium term.
Q: Since the year 1900 the real purchasing power of the USD has eroded massively. It appears today to have lost 99% in its purchasing power. This is staggering if correct. Assuming it is true, has the corresponding real purchasing power of gold over this time increased by more than, less than, or equal to 99%?
To what extent has gold kept track with the fall in the real purchasing power of the USD? Of course gold also acts as a safe haven, making a perfect calculation is difficult. But the answer to this question is perhaps useful to better understand why gold has been behaving more like a risk asset of late.
A: Before 1971 gold was exchangeable for the USD so speaking of USD's purchasing power until that time is similar to speaking of gold's purchasing power. In order to compare the differences, we will focus on the move in both of them (purchasing power and gold) from 1971. The answer to your question will depend on what inflation numbers one decides to use. If we use the higher of the official numbers and the shadowstats.com numbers (in which the way inflation was measured was not changed), we get cumulative inflation of approximately 1900% since 1971. So, if gold was fairly priced at $35 back then, it should be fairly priced at about $700 right now. Therefore, gold is not oversold relative to its inflation-adjusted 1971 price.
The question is if gold was fairly priced back then - gold moved higher right after it was allowed to float and it topped far above the "fair" $35. The inflation-adjusted 1980 high would be over $8,000 in today's dollars if we use shadowstats.com inflation numbers.
Consequently, gold is within the trading range that is reasonable relative to the inflation-adjusted prices from the previous bull market. The trading range ($700 - $8000) by itself does not imply a move in either direction in our view.
Summary
In the currency markets this week, the situation remains bullish for the dollar and is now mixed for the euro. If the euro closes the week below the next resistance level, the situation will be clearly bearish for both the euro and the precious metals. This would also likely have a positive influence on the dollar. A lot can happen based on the outcome of the Greek elections, but what we have written in today’s update is what currently appears most probable in our view.
In the general stock market, the situation is rather mixed as some bullish implications are seen but only in the long-term chart. Since the long-term outlook is more important, the overall picture for stocks is best described as mixed. The implications of stocks upon the precious metals are less important now. The focus for investors and traders in precious metals should be on the currency markets.
The situation for gold has not changed very much this week and remains bearish. However, it does not appear that long-term gold positions should be exited at this time. The silver market appears more bearish and being out of this market with long-term capital seems appropriate today. The same goes for the mining stocks. Additionally, the mining stocks outlook is clearly more bearish for the short term than the one for gold and betting on lower mining stock prices for the short term appears to be a good idea right now. The probability of lower prices for mining stocks appears to be about 65%.
This completes this week’s Premium Update. Our next Premium Update is scheduled for Friday, June 22, 2012.
Thank you for using the Premium Service. Have a profitable week and a great weekend!
Przemyslaw Radomski


