The bears are having a field day. As in previous gold meltdowns, they are gloating that this time the bull market in gold is over. We know that you are not happy with the prices of gold right now as gold didn’t manage to hold on to last week’s gains. Neither are we. Our money is also on the line. There are two things to keep in mind. 1. Nothing goes up in a straight line. 2. Investing comes with risk (unfortunately.)
We sent out two Market Alerts this week and in the second, which arrived in your in box on Wednesday, we suggested that it is now justified to hedge or sell at least a part of your long-term precious metals investments. It looks like the move back above the declining support/resistance line failed and gold was clearly below it. (At the time we wrote the Alert gold was trading at $1,550. Right now it’s trading at $1,563.)
We also mentioned opening speculative short positions in the precious metals with only a small amount of capital. We suggested putting a stop-loss order at $1,585 in case of gold. In the Alert we discussed both the bearish and bullish signs and right now the bears have it.
The reasons for decline given in the press were a case of “round up the usual suspects.”
There were concerns that China’s economy is slowing and that European leaders may fail to stem the debt crisis. As expected, the new French President Francois Hollande challenged Germany's deficit-cutting stance. The euro hit a near two-year low against the dollar on Thursday after dismal German economic data suggested that no country in Europe is immune from crisis. The German data for May suggested the growth in Europe's economic engine that has so far helped the currency bloc dodge recession, may be starting to slow. The euro dropped sharply to $1.2515, its lowest level almost two years. All that boosted the dollar driving the greenback to the highest since Sept. 13, 2010, against a six-currency basket.
It is likely that the confidence in the U.S. dollar will turn out to be medium-term-lived. It won’t be too long before the people will turn to the tried and true source of true wealth preservation—gold. Global economic turmoil is likely to continue over the next few years as we lurch from one economic crisis to the next and gold will be the beneficiary of this. We have no doubt for the long term. Those who invest in gold for long-term wealth preservation don’t feel the bumps as much along the way.
There is all the talk of Greece leaving the eurozone and we are already seeing a slow-motion runs on Greek banks. The Financial Times reports that €5 billion has left Greek banks in just the last two weeks and the more that Greek citizens feel it is possible that their country will leave the euro, the more incentive they have for pulling their money out and sending it abroad.
There are no rules in place for a country to leave the eurozone and it is anybody’s guess as to how severe the impact of such a move will be. These are uncharted waters and the sailing could get very rough. If Greece were to leave the eurozone, gold could initially fall on euro weakness and a flight to cash but the precious metal might then bounce due to a policy response of quantitative easing from central banks.
No one can predict how big the systemic contagion will be for Spain, Italy and their banks. In Spain, 16 banks and four regions have just been downgraded by Moody’s Investor Service. The point of no return may be approaching faster than anyone anticipated. Spain and Italy are too big to bail out if panic ensues after a “Greexit,” which is why European leaders would prefer that Greece, with all its problems, remain. A Greek departure is likely to be seen as the beginning of the end for the whole euro zone project. Greek voters still need to produce a functioning government in new elections on June 17.
New York Times columnist Paul Krugman compared the choice of Greece staying in Eurozone to the situation of Italy, where the north has had to subsidize the poorer south for many decades. He writes:
Italy’s currency union held together because the north made, and continues to make, large fiscal transfers to the south. Economists reckon these transfers to be around 4-5 per cent of Italian GDP. A flow of subsidies towards the south has had evil consequences: incomes have been maintained at uneconomically high levels, fostering unemployment. Large infrastructure and development projects have fuelled corruption, sustaining southern Italy’s criminal societies. Fiscal transfers helped Italy maintain its political unity but the cost has been enormous. From an economic perspective, the Mezzogiorno (Italy’s south) would probably have done better if it had stayed out of Italy’s monetary union.
Today, Greece stands on the brink of an exit from the euro. To avoid further sovereign contagion, the remaining eurozone members may find themselves pushed rapidly into a more complete fiscal and political union. The markets would doubtless applaud such an outcome. But if Italy’s example is relevant, the northern eurozone members could find themselves paying indefinitely a large tribute to the south. Economic divergences within the single currency area could become entrenched. Viewed from this perspective, a clean-break divorce might bring more immediate pain but in the end prove less costly than an unhappy marriage Italian style.
Meanwhile, central banks continued to buy bullion in April as Turkey raised its reserves by 29.7 metric tons and Ukraine, Mexico and Kazakhstan also increased their holdings, according to International Monetary Fund data.
Let's begin this week's technical part with the analysis of the US Dollar Index. We will start with the very long-term chart (charts courtesy by http://stockcharts.com.)
USD and Euro Indices
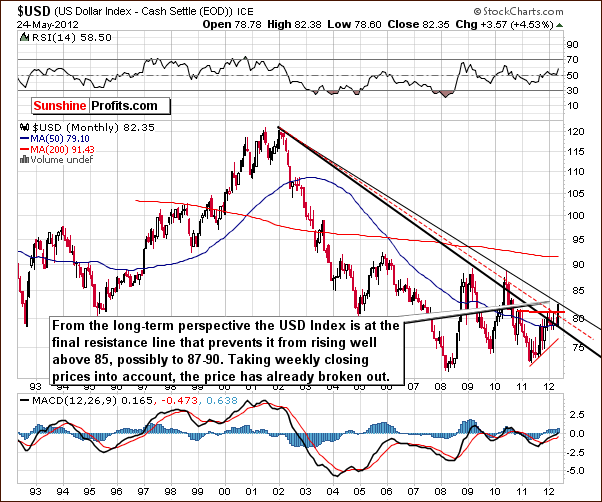
The index has rallied in spectacular fashion for the past few weeks and the move is clearly visible even from the very long-term perspective. Three resistance lines have been surpassed and the index is currently at its last one based on intra-day highs. Once broken, if the breakout above the 82.5 level is confirmed, much higher values will likely be in the cards. A move to 87-90 would not be surprising in this case.
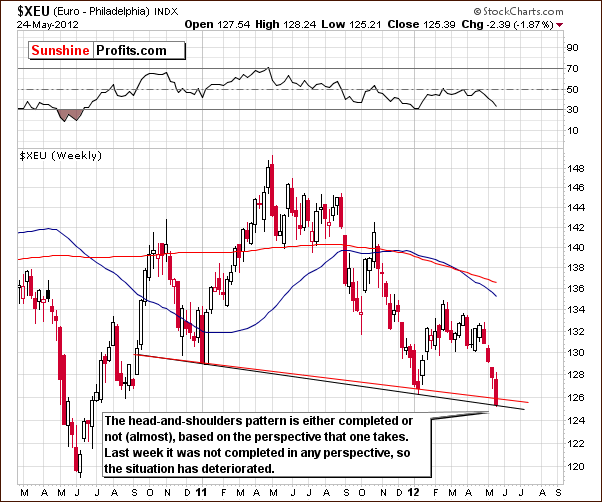
The euro decline is quite likely responsible for most of the positve upswing seen in the USD Index. If the breakdown is seen here - below the black neck line of the head-and-shoulders formation - if we see the index close below this line for three consecutive days, the Euro Index will likely move much lower and the dollar much higher.
In fact, we have already seen a breakdown in the euro based on weekly closing prices (red line) and this is being verified right now. Whether or not the breakdown is in is a bit unclear, but the situation in the Euro Index has surely deteriorated this week.
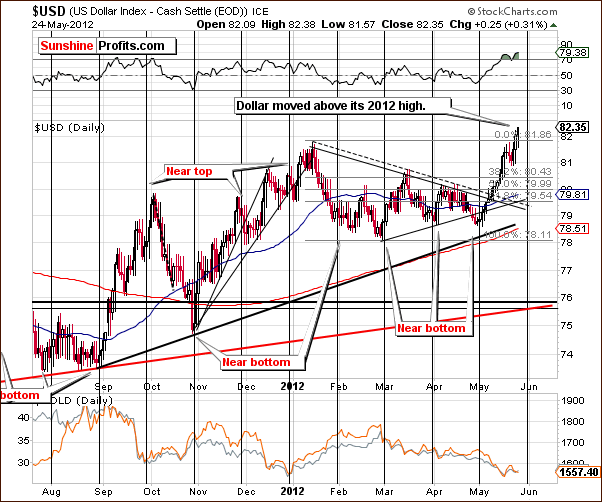
In the medium-term USD Index chart, the index appears overvalued based on the previous significant rally but it may still rise further without any major declines – just like it was the case in September 2011. Pretty much only a small decline has been seen recently and this is similar to trading patterns seen last September.
Back in September gold moved slightly lower at the beginning of the USD Index rally but its price has truly plunged in the second half of the rally. Although significant declines have just been seen, this pattern in gold prices may be repeated if the USD Index continues to move higher. In this case, it would mean even more sharp declines in the following weeks.
The index is close to a cyclical turning point and may top relatively soon. This would be bullish news for gold; however, momentum appears strong and it seems that the dollar could move above the 82.5 level and correct at or slightly after the cyclical turning point – thus verifying the breakout.
Summing up, all-in-all, the long-term picture appears quite bullish for the dollar and bearish for the euro. The short-term situation for the USD Index is rather mixed with a bullish bias.
General Stock Market
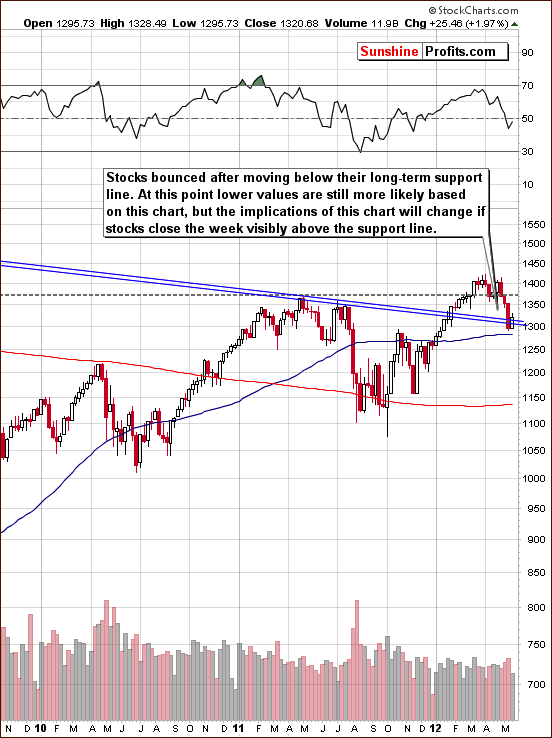
In the long-term S&P 500 Index chart (please click the above chart to enlarge), stocks are at some important support levels now. Last week, stocks moved below the long-term support line and today are trying to move back above it. We have seen some sideways trading around it and stocks are slightly above the support line based on intra-day highs. It’s important to see where they close this week, as this chart alone does not give decisive information.
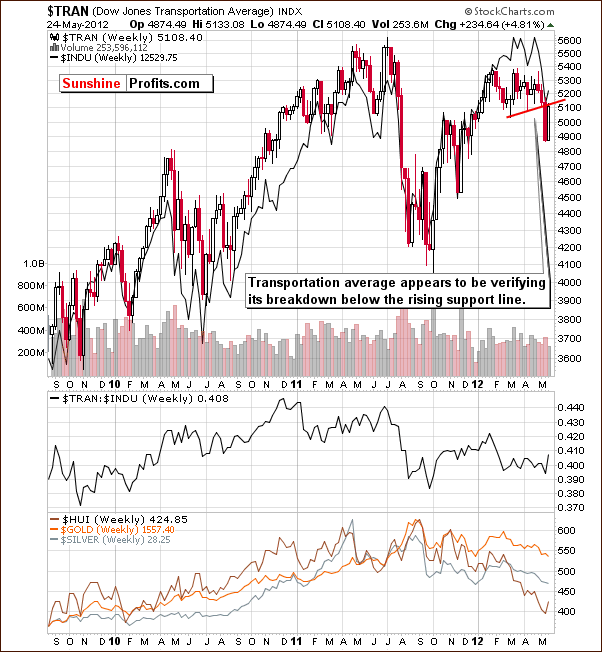
In the Dow Jones Transportation Average chart, we see a significant breakdown last week, which was is currently being verified by a move back to the resistance line. If the index closes the week below this level, the breakdown will be verified.
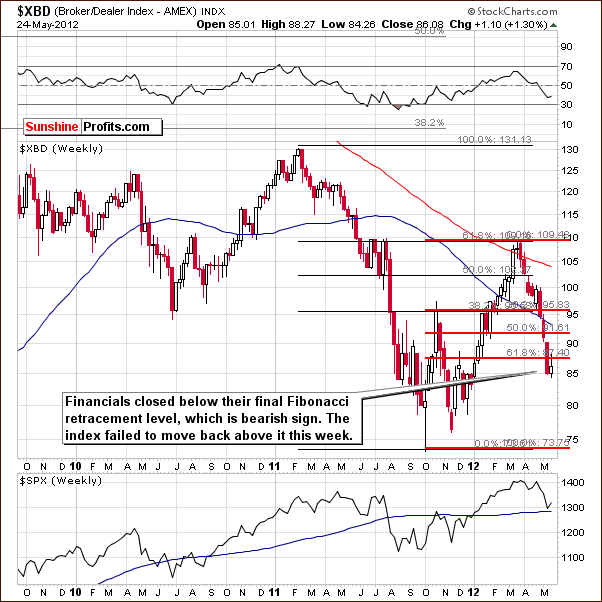
In the Broker Dealer Index chart (a proxy for the financial sector), we saw a move below the final Fibonacci retracement level last week. Attempts to move back above this line have been unsuccessful and the index is still visibly below this resistance line. This can be viewed as a verification of the breakdown, which is bearish not only for financials, but also for other stocks.
Summing up, the situation in stocks is a bit indecisive for the S&P 500 but other markets show signs that lower prices are to come. In addition to these charts, a note about fundamentals seems valid here. Companies which are strong generally act weak before periods of market decline, whereas those which are weak fundamentally can be seen to thrive during the final part of a rally. Apple, seen as a strong company moved lower on Thursday, whereas Facebook (seen as weak from the valuation approach) has moved higher in each of the past two days. If the “strong-weak” theory holds, lower stock prices would be in the cards.
Crude Oil
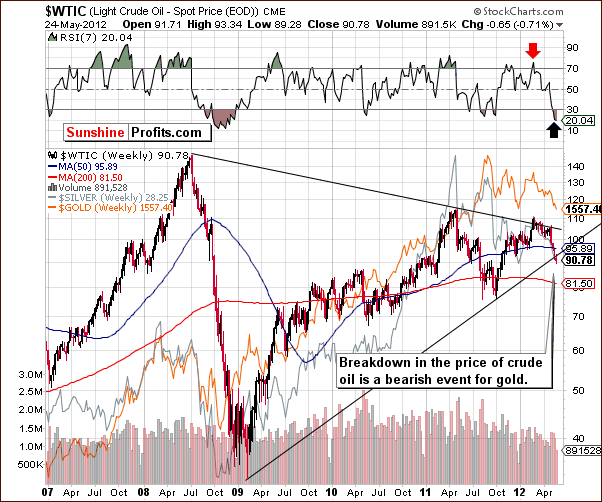
We now look at the crude oil price chart. Last week we mentioned that gold’s price is often aligned with these prices in the short term. This week’s breakdown in oil prices therefore has bearish implications for gold.
Precious Metals Correlations
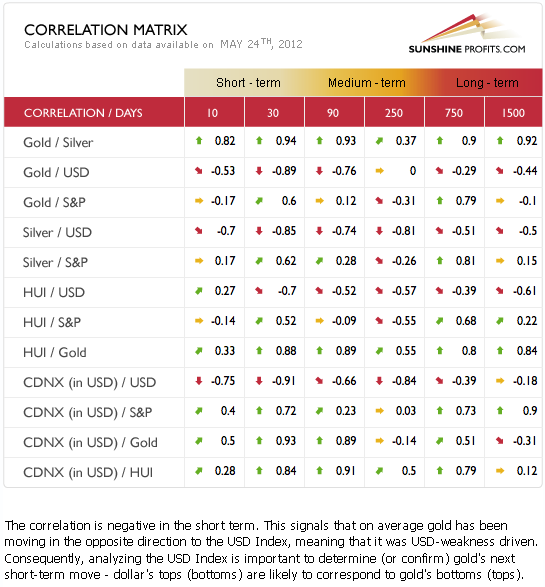
The Correlation Matrix is a tool which we have developed to analyze the impact of the currency markets and the general stock market upon the precious metals sector. This week, the coefficients are classic as gold and stocks are positively correlated and gold is negatively correlated with the dollar.
A key factor this week has been how moves in the USD Index have been immediately reflected in gold’s price. It appears to be very important at this time to watch any move in the dollar and act accordingly. Based on the short-term trend, the USD Index seems likely to be headed above 82.5 even if it has to temporarily correct first (please note that there can be no such correction before the breakout). Lower precious metal prices will probably be seen following such a move.
Gold
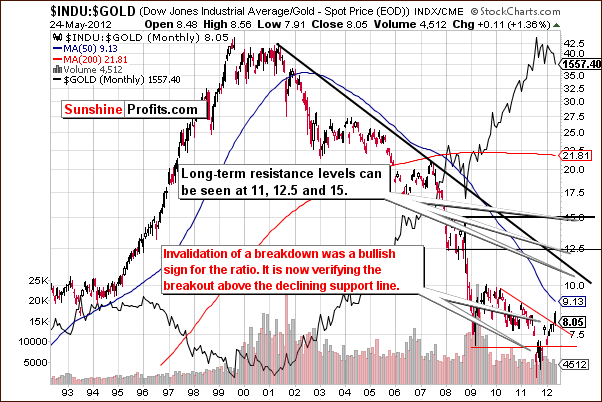
In the dow:gold ratio chart, we see that the ratio moved lower for a ten year period as gold prices rose. The ratio tried to move below the lows of 2009 in 2011 but the breakdown has been invalidated and a rally followed. In fact, this rally took the ratio above the medium-term declining resistance line (the declining red line on the above chart) and this breakout is now being verified.
There are some bearish short-term implications for gold here but these are limited since the breakout in the ratio has not yet been verified.
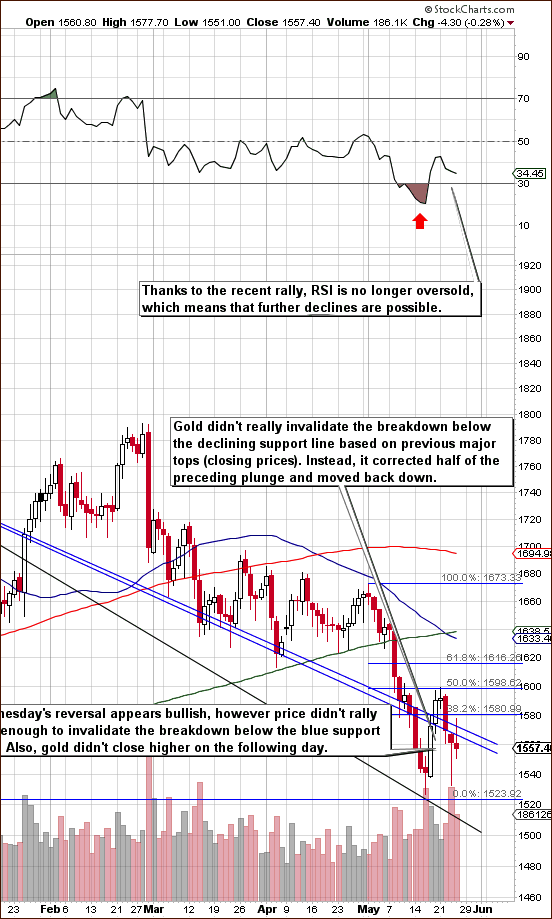
The long-term chart was basically unchanged this week so we have not included it in this week’s Premium Update. Turning to gold’s short-term chart (please click the above chart to enlarge), we see that RSI levels here are no longer oversold as they were when gold prices broke through the declining support line. Gold’s price did bounce but is once again below this line and RSI levels do no imply any reversal in the near term. A possible bullish hammer pattern which normally signals a reversal was seen on Wednesday but was nullified by declining prices on Thursday and the failure for gold to move above the resistance-support line. Gold has corrected one half of its previous decline and now moved lower once again.
A double bottom pattern could be forming similar to what was seen last October. Then again, previous double bottoms have seen an immediate rally following the second bottom and this was not the case now. Gold seems to be playing out differently now and it is most important to note that prices are still below the declining support line.
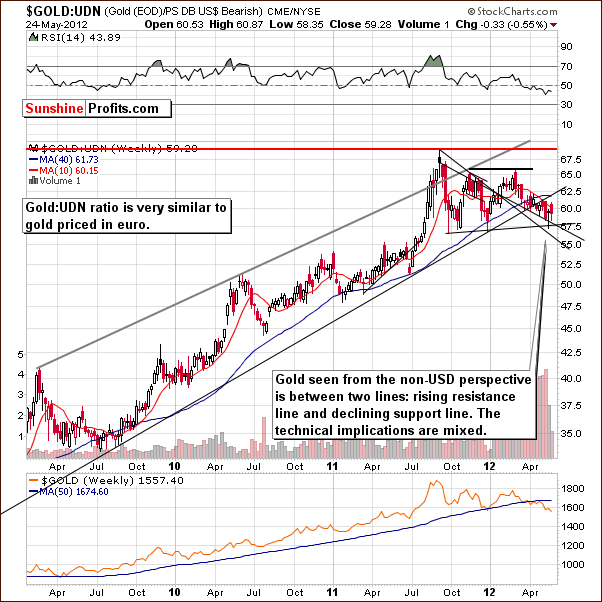
In this week’s chart of gold from a non-USD perspective, not much happened this week and prices traded sideways for the most part. In last week’s Premium Update we stated that we see that the index bounced after the support line was reached. The situation is mixed here since a breakdown was seen below the rising support line but not below the declining support line. The technical implications are mixed here since the index is between these two important support-resistance lines. These comments are still valid based on the lack of any change here this week.
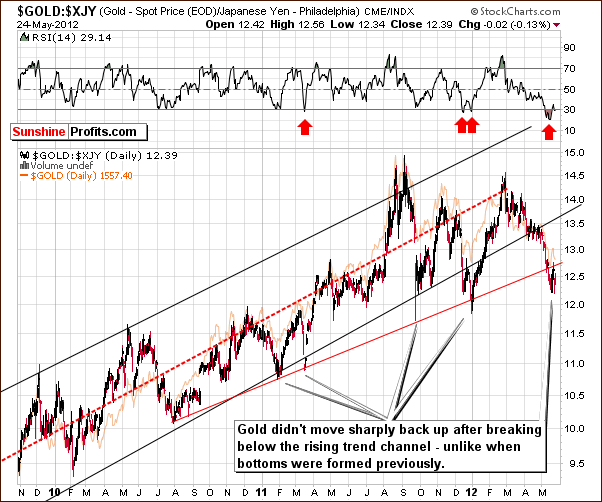
Looking at gold from the Japanese yen perspective, no sharp pullback was seen back to the previously broken support line. This is different from what we have seen in the past so it seems that history may not be repeating itself here. This is a bearish development and the implications are that precious metals prices may very well move lower in the days and weeks ahead.
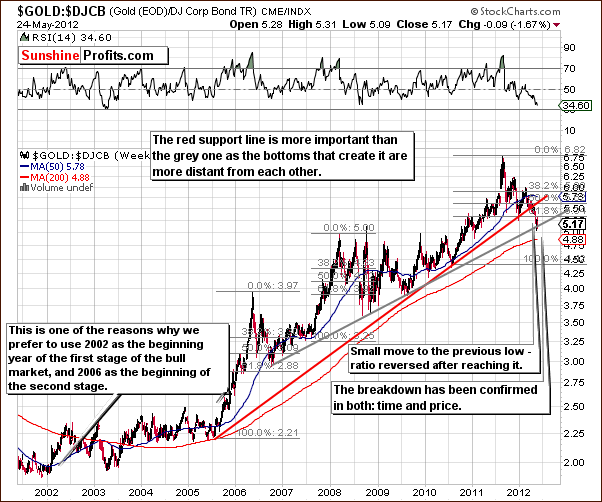
In the gold to bonds ratio chart, we see a clear move below the rising red line in the chart and a gray support line based on shorter time periods with bottoms closer together is also in play here. The red line is more important since it is based on a longer period of time. The breakdown is in and this chart appears to be more bearish than not. The ratio has corrected to its previous lows and moved back down again. This could be viewed as another verification of the breakdown.
Summing up, the situation for gold is extremely tense. Intraday volatility has been significant as investors appear to be monitoring the USD Index and quickly placing opposite trades. A small move in the dollar is resulting in price moves for gold almost immediately. If the USD Index rallies, gold prices will likely move below the support line adding significant selling pressure as investors “run for the hills”. This is why we suggested getting out on Wednesday when it appeared that the downward move had resumed. Although a move to the upside was seen later that day, prices are still below the declining resistance line and the odds favor more declines from here. The major downside target for the significant plunge is close to $1300.
Silver
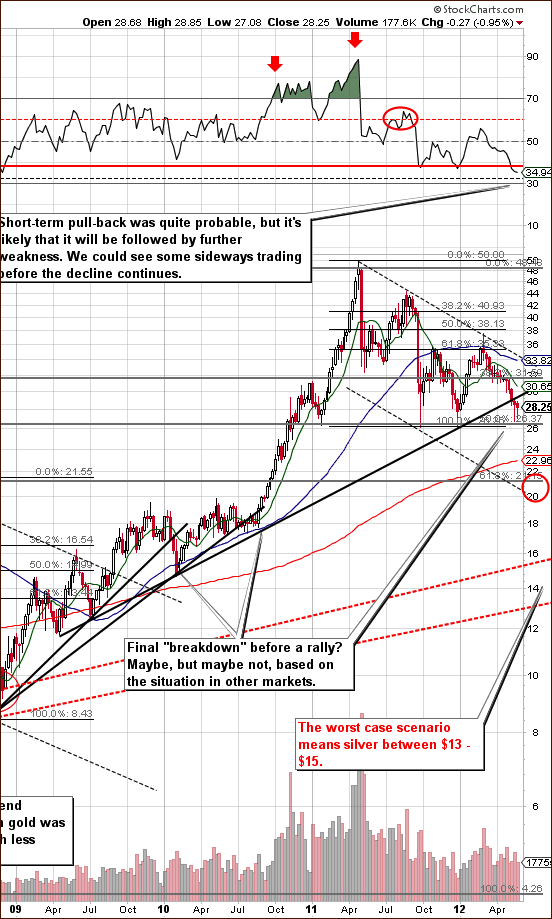
We begin this week’s silver section with a look at the white metal’s long-term chart (please click the above chart to enlarge). The RSI level indicated that silver’s price could move a bit higher before any plunge materializes but if stocks and gold decline, it’s unlikely that silver will move higher. (Note: the silver to gold ratio chart, which will be covered later, also does not favor silver outperforming gold in the medium term right now.)
A red ellipse has been added this week and indicates our first target level for silver if prices decline below the previous low. This target is in the $20 to $22 range. If a breakdown does occur, sharply lower prices are expected and know that silver can move lower very quickly based on historical trading patterns.
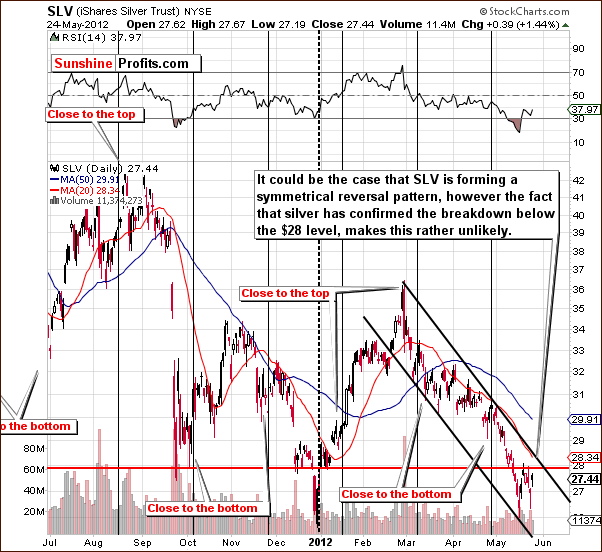
In the short-term SLV ETF chart, we see that the breakdown below the $28 level has been confirmed. This has not been seen before as previous attempts were immediately invalidated. This time the prices moved lower and then back to the line but not above it.
SLV’s consolidation below this level has been seen and this makes subsequent declines more likely. RSI reflects this situation as it is no longer oversold.
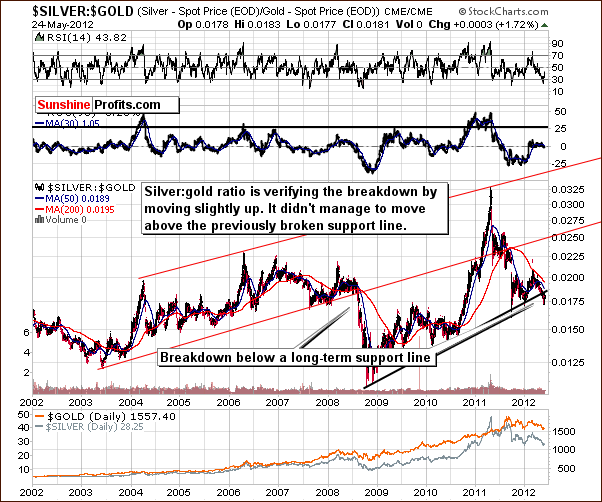
The silver:gold ratio is now below the rising support line and the previous breakdown was a result of plunges in the metals, especially silver and also in the mining stocks, especially juniors. We have not seen an immediate move to back above the support line – which was the case during the last two major lows of 2011.
The RSI level is no longer oversold so lower ratio values could very well continue. Technical analysis of the ratio chart suggests that silver is unlikely to outperform gold in the weeks and months ahead.
Summing up, the situation appears rather unfavorable for silver.
Gold Mining Stocks
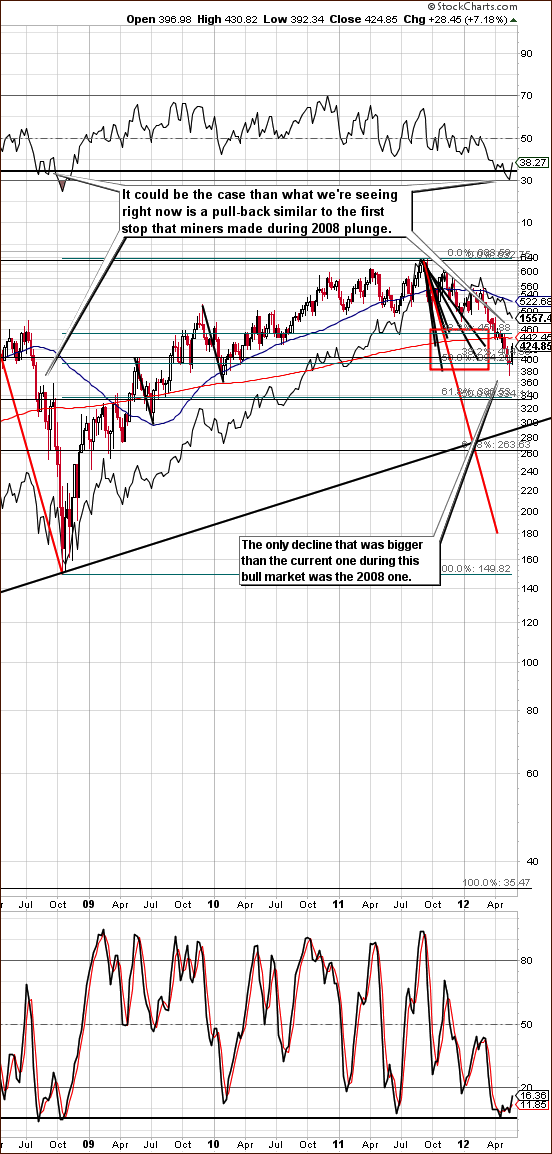
In this week’s long-term HUI Index chart (please click the above chart to enlarge), we see that once again a rally has caused the RSI levels to no longer to be oversold. It could be that the final bottom is in or that gold stocks are consolidating after a severe plunge. They could possibly be taking a breather with more significant declines to come. This would be similar to what was seen in 2008. Much depends on how the situation plays out for gold and the USD Index. Not that much can be seen from this chart alone.
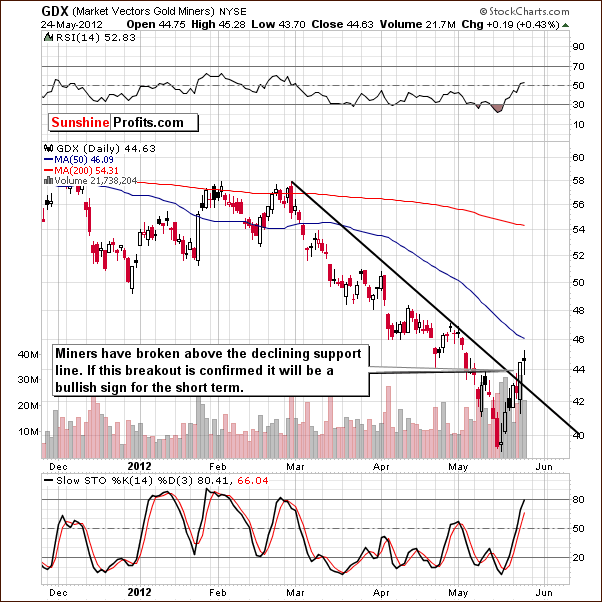
In the GDX ETF chart, we’ve seen a breakout above the short-term resistance line but it has not been confirmed. If a line were drawn based on March and April lows, the late April breakout has been invalidated. The outlook could be bullish here if the breakout is confirmed but this does not appear likely. Also, there has been no analogous breakout in gold.
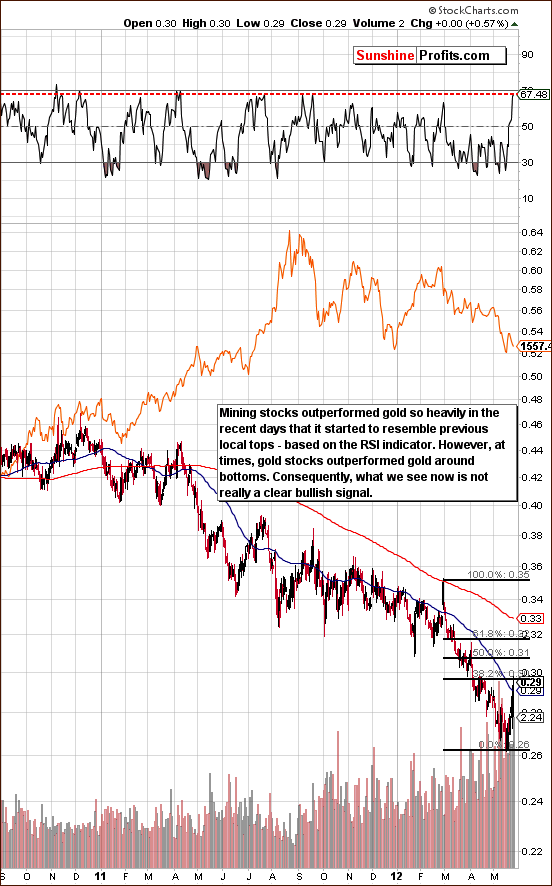
In the miners:gold ratio chart (please click the above chart to enlarge), the overall situation is very interesting as mining stocks are now outperforming gold and the rally in the ratio has been very sharp. There were times in the past when miners' outperformance heralded higher prices for the whole sector. However, that was mostly the case when gold stocks actually outperformed the yellow metal on average. This has not been the case for more than a year, and during this time there were several cases when sharp rallies in the ratio (that were in fact counter-trend moves) marked local tops. The final top in September 2011 and the final top at the end of February 2012 were both preceded by a similarly sharp counter-trend move. So, should we really view the current outperformance of miners as a bullish sign? Not necessarily.
We are not really viewing strength in the miners as a bullish signal without gold moving above its declining resistance line. Outperformance of the miners over gold is simply not enough.
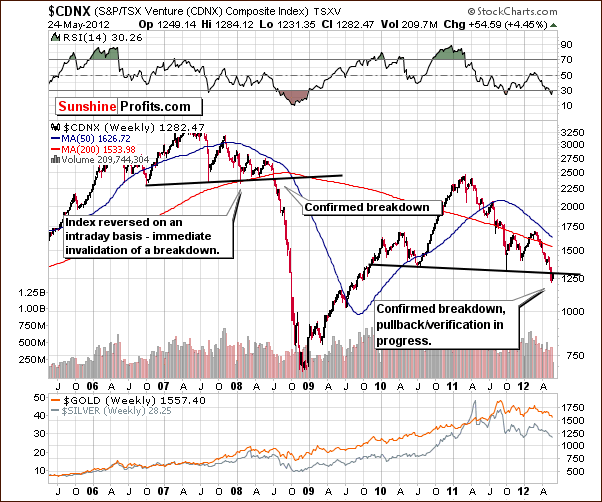
The Toronto Stock Exchange Venture Index (which is a proxy for the junior miners as so many of them are included in it) is especially important this week because of a clear, long-term head-and-shoulders formation. The breakdown below the neck level of this pattern has been verified by three consecutive closes below it. A small pullback to the neck level is also verifying it and once the index moves finally lower, a much bigger decline will likely emerge. In fact, a decline to the level of 2008 lows is now possible. This would likely be devastating to juniors, seniors and precious metals overall.
Summing up, the situation in the mining stocks is quite ambiguous. It seems bullish and favorable from a short-term point of view, until you factor in the analogy to September 2011 and February 2012 tops. A closer look shows that the picture in no longer so favorable as a breakout in mining stocks for the short term has not yet been confirmed. The Toronto Stock Exchange Venture Index chart already shows verification of a recent breakdown. Lower prices, possibly much lower prices are expected for mining stocks in the following weeks. A confirmation of the move above the short-term declining support line will not be really meaningful without analogous move in gold.
Letters from Subscribers
Q: Since the price of gold is so close to your targets,which market do you track? I follow spot on Kitco.com.
A: This question is no longer relevant in terms of timing, but for the record, we generally use the prices that you can see on stockcharts.com as we use this website to create our charts. Generally, intra-day prices seen there are very close to what you see on kitco.com.
Q: Are you still bullish on platinum if this rally does indeed materialize? It still seems to be underperforming the other metals even as it moves up, and still takes bigger hits on the way down. Has there been a fundamental change that has affected platinum and a reason for it to stay below the value of gold?
A: Yes, we are still bullish on platinum relative to gold for the long term. However, if stocks decline from here, we could see more damage to industrial metals like platinum in the short term. Then again, since platinum was meant to be bought for the long run, we suggest being at least partly out of the market at this time.
Q: Picture this: The G-8 announce some grand coordinated effort to guarantee that all of the troubled PIIGS will be guaranteed low interest rates as long as they make their principal payments. Some would still need more help but the problem would be solved for a very long time. Printing in unison would not cause currency problems as long as all of those who are able joined in. That would cause a huge run for gold. They are all getting together this week.
A: The problem for the monetary authorities would still be that non-G-8 countries that would see their currencies appreciate relative to G-8 currencies would likely devalue their currencies as well in order to keep their imports competitive. Such a global currency war would be extremely inflationary and positive for gold. In fact this scenario is not that unlikely in the following years, but it doesn't have to happen immediately. The problem with PIIGS might be solved by providing them with virtually unlimited financing, but the problem with the stability and credibility of the financial system would become much bigger. This is not something the powers that be want, so they will likely be careful about making hyperinflationary promises such as the one that you mentioned. So, if that is to take place, we expect that it will be announced only after stocks, commodities and metals decline, so that all this printing can be “framed” as “fighting deflation”, “saving the economy”, “creating jobs by stimulating growth” and similar.
Q: Out of great respect for your previous calls I have taken your advice, but must tell you that I’m dying to buy back in and am extremely nervous about being in any sort of cash. I want to call your attention to the $2 billion loss JP Morgan just took on their derivatives exposure a few days ago. They have a $70 trillion derivatives exposure and 4 other big banks have $50 trillion in derivatives exposures (including BofA and Citibank) totaling over $400 trillion combined.
Pastor Lindsey Williams says "the dollar will be dead before the end of 2012" and a deliberate detonation of the "derivatives time bomb of mass destruction" will be set off by these criminal banking collaborators to bring the whole system down. Anyone holding or invested in any sort of cash will see its value vaporized. You can probably see that there is mathematical truth to the possibility and likelihood this could occur. I’m hoping you will figure this all-important factor in future calls.
A: We do take that into account. This or something like it could happen at any time, that's why we suggest having part of holdings in physical bullion.
Q: I do not agree with the bleak outlook in silver! The US is toast, like Greece. The smart money from Europe will buy mining stocks (due to the very high VAT of up to 25%).
Silver has not picked up as the miners have in the past 2-3 days (smart US & EU buyers? A friend has reported from Frankfurt that buying is up in the silver stocks, resulting in higher prices). The summit in Camp David is all about "easing in unison." This is very bullish! Thank you very much.
A: "Easing in unison" is bullish - in the long term. In the short- and medium-term, it's not that clear. Perhaps the monetary authorities have agreed to increase the money supply globally but only after a more severe plunge in stocks, commodities and precious metals? That's what Bernanke indicated recently and what sounds reasonable from the political point of view. People will be much more likely to believe that it was necessary when they get scared about their savings first. VAT in Europe is not a new development so it’s not a reason for a short-term move in any direction in our view.
Q: Can you also provide a list to short the markets? For example, SDS. ETNs and ETFs to short the markets on the TSX would also be useful. Thanks.
A: Unfortunately we have not examined general stock market ETFs/ETNs enough (after all, SP is about precious metals at least at this point) to provide a ranking.
Q: As long as gold holds 1525 doesn't this represent more of a buying opportunity? Do you really think that Greece is stupid enough to leave the euro? I think they are just doing this to extort more money and concessions.
A: Good point about Greece, however until markets get more direct signals, they could continue to view any new development in the area as bearish for the euro and bullish for USD Index. The momentum in the USD is strong and it has corrected mildly. It could be starting another major wave up.
Q: [Editor’s note: this question was received before suggesting to get at least partly out of the long-term investments] If a 2008 scenario were to play out, most of us would lose significantly in the time it would take for you to recommend, and us to act, in closing out long-term investments. If the risk of a substantial decline is real (in fact, as you say, more likely) and the breakdown has already been confirmed, please explain why you have not recommended closing out long-term investments.
I am also concerned by your conclusion that "the probability of a rally is a bit less than 50%.” It seems that with a “confirmed breakdown,” the probability of a decline should be much higher than that. Is “confirmed breakdown” a term which has any real meaning, if you can suggest that the next 3 days (above 1580) could invalidate it? My point is, if you had said on Thursday, “the breakdown is confirmed, there is now a bit less than 50% chance of a rally,” most of us would have reacted differently to what you did suggest, which was, “the breakdown is confirmed (thus likely) and gold could go as low as 1000.”
Was your language in Friday's update designed to temper “confirmed breakdown” based on the strength gold showed both Thursday and overnight into Friday?
Perhaps you have not recommended getting out of long-term investments because the breakdown is not truly confirmed? But by the time it is confirmed, we will have taken losses far greater than in the spec capital.
No, we don't want to read the same thing everyday, but it seems like we are more and more. We all know this is difficult stuff, and nobody gets it right even 80% of the time. The bottom line is, in the end, you are giving us your best educated guess, and we know that.
I think gold/silver will be going up next week, maybe 1625-1640. It might be a good idea to tell us on Monday what you feel could invalidate the breakdown, as at one point you suggest 3 closes over 1580 while at another you say a “substantial rally.”
A: The breakdown below the declining support line was something that would make a quick rally above $1900 unlikely - at least unlikely enough not to bet on it with one’s speculative capital.
However that alone was not bearish enough to get out of long-term investments. We think that one should be invested in the precious metals market with one's long-term investment capital almost at all times and get out during the least favorable circumstances.
Gold's inability to stay above the declining support/resistance line combined with all the other factors mentioned 2 days ago was a very bearish set of events. That's why we decided to get out of the long-term investments.
Generally, here’s how the approach differs between short-term speculative capital and the long-term investment capital.
The first part is simply dedicated to trading. The benchmark here could be the risk-free rate, which is almost 0 at this point. We realize that some investors set the benchmark at very high levels, for instance by expecting that every move up or down will be captured (effectively requiring the rate of return well above 100% on a yearly basis), but that would likely lead to dissatisfaction with any methodology, technique, or advisor. On a short-term basis, the secular trend in the precious metals is not the most important factor. In this case we will usually bet on smaller moves that are more than 70% probable or so.
The other one is almost a buy-and-hold strategy. The benchmark that we are trying to beat with the long-term investment capital is the buy-and-hold strategy. The goal here is to maintain invested almost at all times because we are in the secular bull market in the precious metals and this is the most important factor. We focus on not missing out on the long-term growth of the prices of precious metals. In this case we will be only out of the market when we see the probability of a major (!) decline above 70% or so. In a way, long-term investments are designed as a hedge against bad trades in the speculative part of the portfolio and at the same time speculative trades are designed as a hedge against a long-term decline in the investment part.
So, if we have a situation when the probability of a short-term move up is not above 70%, and at the same time the situation is not bearish enough for the probability of a major decline to be above 70%, then we will likely stay out of the speculative trades and remain invested in the long-term part of the portfolio.
It might be the case that if a short-term rally is likely, but a risk of a severe plunge after the short-term move higher is above 70%, we would suggest betting on higher prices with one’s speculative capital while at the same time staying out of the market with one’s long-term capital. You can read more about diversification between strategies here: “The Universal Investor. Speculation and Investment.”
Q&A: We received another question about position sizing. What should one do if, because of a previous unsuccessful trade that was done with a significant amount of speculative capital (90%), one's capital is now only a tiny fraction of its starting value (10%)?
Speculative bets should be small enough so that no single unsuccessful trade (or even several of them in a row) will make one emotional about one’s trades. Excessively large trades will destroy capital. This will happen regardless of our (or anybody else’s) making good or bad market calls. You can read more here: "The Universal Investor. Speculation and Investment."
If one trade took 90% of the capital, then it was clearly many times too big. If one is determined to adjust the sizes of particular speculative trades, then we suggest starting "all over again," which in this case means once again dividing all capital into speculative and investment positions. The more capital there is, the more can be used for speculation. Let's say you choose to use 30% of your capital for speculation. In that case, each trade could take only a few percent of the capital if leverage is used. If not, then not using the whole speculative capital for a position is still suggested. Especially since positions were too big previously. In fact, we suggest starting “all over again” with very small position sizes (say, 1/3 of what you think is low enough) and then slowly increasing it from trade to trade until you get emotional about your trades. Then remember to use less than this amount percentagewise for all future trades.
We discourage increasing position size (like borrowing money to “get back on track quickly”) even further. This would increase the emotional tension and would likely lead to losses if not immediately then after a few trades.
We have also received a few other interesting questions this week, but unfortunately we will not be able to reply to them in today's update, as we spent too much time monitoring the market and we are working to create the update to deliver it to you in a timely fashion.
Summary
The short-term outlook for the USD Index is quite positive. The general stock market situation is rather negative but much depends on where they close the week. Overall, implications are bearish for the precious metal sector especially for the long term. The short-term situation is less clear.
The situation for gold is overall bearish as its price is below the key support line based on important tops. The gold to bond ratio and gold from the yen perspective (which failed to move back to the resistance line) support this bearish outlook. The overall situation for silver does not provide us with bullish signals. The short-term chart suggests that prices could move a bit higher, but the silver:gold ratio chart makes the picture bearish for the following weeks.
Mining stocks have rallied a bit but it could be just a bounce based on previous weeks when they were oversold and are now correcting. This is similar to what was seen in 2008 after the first phase of the decline. The Toronto Stock Exchange Venture Index suggests that the bigger part of the decline is still ahead.
This week we have suggested exiting long-term positions with at least part of one’s capital. Being speculatively short still appears to be a good idea, as the following decline could be very sharp once it starts and it might be difficult for one to enter a trade during it. This time a stop-loss (for the speculative trade) for gold at $1,585 appears appropriate just in case gold moves above the resistance line and a temporary rally occurs thereafter.
This completes this week’s Premium Update. There will be no Premium Update next week as your Editor will be traveling to take his (hopefully) final CFA exam. We will not be taking time off this week though. We will continue to monitor the markets and report to you of any changes to what we have commented on this week. Our next Premium Update is scheduled for Thursday, June 7, 2012.
Thank you for using the Premium Service. Have a profitable week and a great weekend!
Przemyslaw Radomski


