
Gold, traditionally a safe-haven asset, has been moving in tandem with riskier assets such as equities, industrial metals and oil this year, as investors for some reason which is difficult to fathom, have turned to the supposed “safety” of the dollar.
All eyes are on Greece which is heading toward national elections six weeks after the last vote. Many feel that a Greek euro exit would be a chance to cauterize a festering wound and move on. There are also those that feel that Greece could be the first of several dominoes to fall, much larger economies such as Spain, Italy, for example.
Meanwhile, Spain’s 10-year borrowing costs had hit as much as 6.5 per cent on Wednesday with the risk of the country paying astronomical prices to borrow in the future. Spain has now issued more than half of its total debt needed for this year, yet concerns that Madrid will struggle to meet its deficit reduction targets for this year and next have pushed therisk premium between German and Spanish 10-year bondsto the highest in the history of the single currency.
What is the most likely scenario if Greece exits the Eurozone? It isn’t pretty for Greece.
The Greek government (if one is formed soon) could legislate that all corporate and personal savings in Greek banks will be denominated in Drachma. The Drachma would swoon so that almost immediately Greek consumers will need more Drachmas to buy one Euro.
A run on the banks would be most likely followed by a run on the Drachma, with Greeks constantly converting their drachmas into Euros, or other currency. The drachma constantly plunging against foreign currencies could cause a new crisis of hyperinflation.
Of course, there are examples of other countries that have left what's effectively a common currency zone without suffering hyperinflation. A Greek exit could stimulate the same growth dynamic that's recharged Iceland and Argentina. Greece will once again become a cheap country, attracting tourism and with attractive exports.
Writing this week in the Financial Times, Bill Gross, manager ofPimco, the world`s largest bond fund, was ripe with metaphors. He compared the world’s larger economies to the mighty whale which depends upon plankton (the smaller economies) for its survival. He called the troubles in the Eurozone a localized tumor which threatens to spread.
The time where investors are no longer willing to accept negative yields on US Treasuries is near, warned Gross.
"With the US suffering a credit downgrade to AA and offering negative 200 basis point policy rates for the privilege of investing in Treasury bills, the willingness of creditors - as opposed to debtors - to support the existing system may soon fade," Gross wrote in a Financial Times editorial published on Tuesday.
"With dollar reserves widely dispersed in China, Japan, Brazil, and other surplus nations, it is fair to assume that there will come a point where 2% negative real interest rates fail to compensate for the advantages heretofore gained in buying sovereign bonds," he added.
Gross recently cut his exposure to Treasuries, reflecting his negative outlook for US government debt. His USD 252 billion Total Return Fund held 32% in US Treasuries and Treasury-related securities as of the end of March 31, down from 37% as the end of February, according to Pimco’s website.
In his investment outlook for May, Gross warned that inflation in the US, which currently stands at 2.7%, is set to climb and further erode returns on government debt. (Needless to say, inflation is a boom for gold.)
Gross wrote in the Financial Times:
“Now the tides may be turning as once minuscule global economies find themselves in possession of a plethora of reserves. The hunted may be turning into the hunter and the global monetary system, which has evolved and morphed over the past century – but always in the direction of easier, cheaper and more abundant credit – may have reached a point at which it can no longer operate in the same way. Major changes to our global monetary system may lie on a visible horizon.”
Gross is not alone in his warnings regarding US Treasuries. Investors such as Peter Schiff and Jim Rogers have also voiced concern.
Peter Schiff, CEO of Euro Pacific Capital, said earlier this month that the US bond market and dollar were headed for a collapse due to the inability of the Federal Reserve to service the nation`s debt with "artificially low" interest rates. Then again, it was said also years ago.
Now for some encouraging news, demand for gold in China during the first quarter of 2012 rose to a record 255 tons, according to data released by the World Gold Council on Thursday.
In its Gold Demand Trends Report for Q1 2012, the council writes, "Although the pace of growth in demand is slowing, gold continues to benefit from rising income levels, increasing urbanization, economic growth and the high inflation environment."
Of the 255 tons total, 98.6 tons was attributed to investment demand, also a quarterly record.
With so much happening in the precious metals markets, let’s begin this week's technical part with the analysis of the US Dollar Index. We will start with the very long-term chart (charts courtesy by http://stockcharts.com.)
USD and Euro Indices
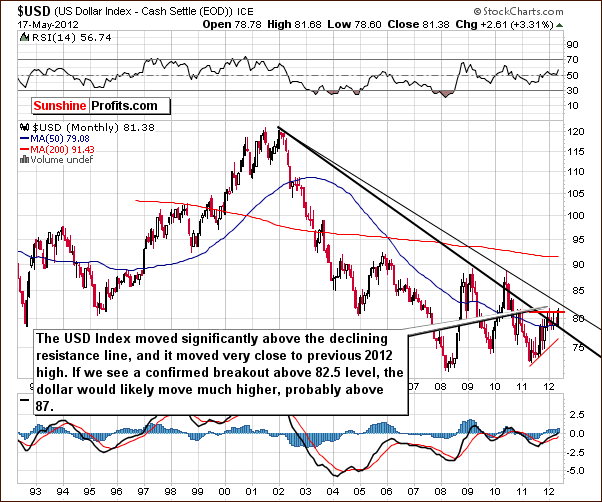
We begin this week with the very long-term USD Index chart. The index continued to rally this week and the move is visible even from this perspective since the index level is considerably higher than it was last week. The 1.3 point, 1.6% increase seen in the USD Index since last Thursday has seemingly ended the narrow trading range anomaly which we have commented on in previous weeks. The move to the upside brings the index close to its 2012 high but, more importantly, above the lower long-term declining resistance line.
It seems quite possible that the rally will continue although a short pause is possible first. If the index moves above 82.5, the next resistance to be encountered will be in the 87 to 90 range, which is considerably higher than where we are today. Such a 5% to 9% move to the upside in the USD Index could be devastating for precious metals prices.
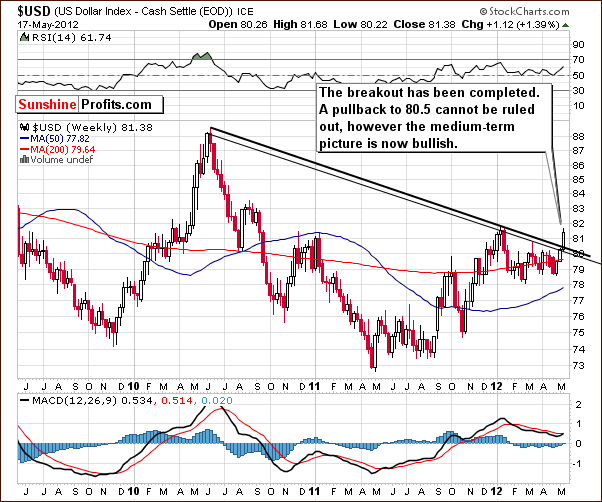
In the medium-term USD Index chart, it does seem that a period of consolidation or sideways trading could be in the cards. This would further confirm the recent breakout which has, of course, already been confirmed by three consecutive closes above the 80.5 level. If a period of sideways trading is seen now, this will increase the bullish potential for the index in the days and weeks to follow.
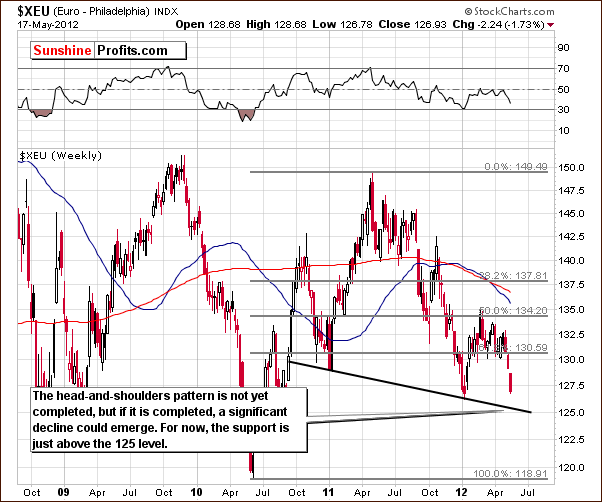
In the long-term Euro Index chart, we see quite the opposite picture. In fact, if the Euro Index moves lower from here, it could complete the bearish head-and-shoulders pattern. This would likely lead to further significant weakness for the Euro Index and additional USD Index rally.
Summing up, the recent moves to the upside and the bullish outlook for the USD Index have bearish implications for precious metals sector overall.
General Stock Market
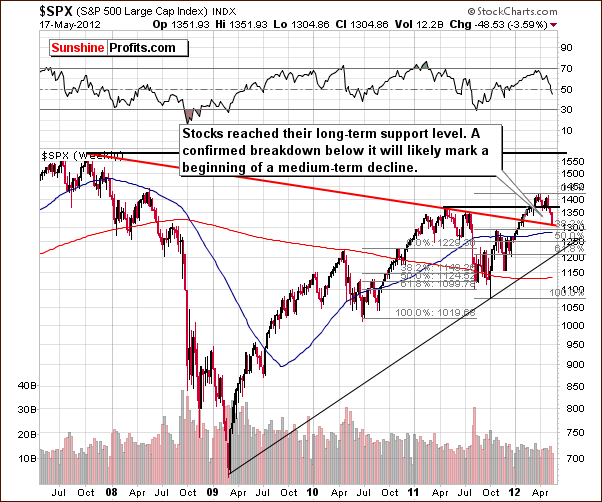
In the long-term S&P 500 Index chart, we see that prices moved lower this week and are at the long-term support line. This is the long-term support line based on previous highs and if it holds the decline, higher prices could be seen for the short term.
If the support line is broken, however, significantly lower prices are likely. In other words, stocks would be expected to begin a medium-term decline. The next support level is slightly above $1,200 for the S&P 500 and is a long-term support line based on previous lows.
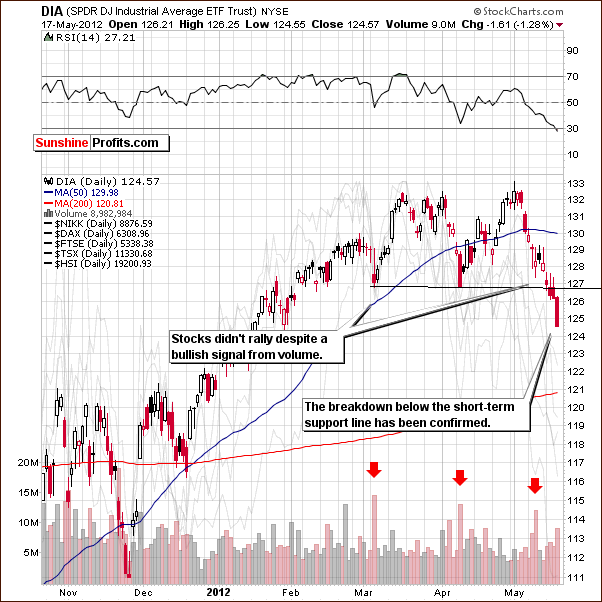
In the short-term DIA (a proxy for the Dow Jones Industrial Average) chart, a breakdown has been seen and it has been confirmed in both time and price. No rally developed last week even though volume levels were significant. This was generally a bullish signal when seen on days when prices moved lower after a considerable decline – at least in the past several weeks. Based on this chart alone, it seems that an additional move to the downside is likely although a small bounce may be seen first.
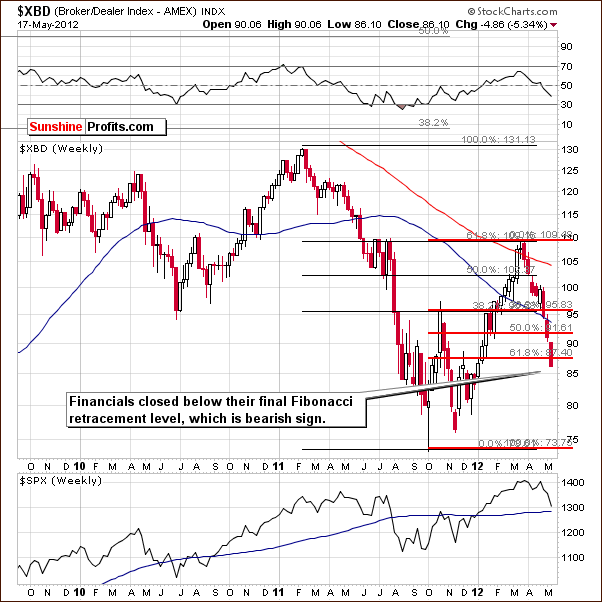
In the Broker Dealer Index chart (a proxy for the financial sector), we see that the financials are below the lowest Fibonacci retracement level. Further weakness and additional moves to the downside appear likely.
Summing up, the continuation of the decline appears unlikely based on the long-term support line. However, since we have bearish signals from the short-term DIA chart and the financial sector, the situation is mixed for stocks and there are no specific implications for the precious metals sector at this time.
Crude Oil
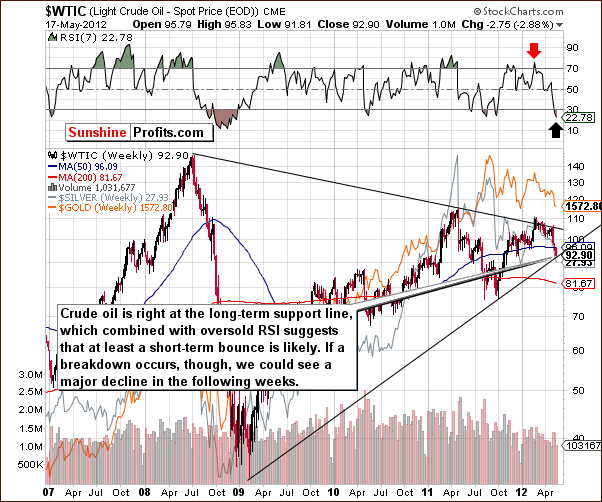
We now look at the crude oil price chart where we see that prices did not yet rally. We may see a bounce in the price of crude and gold prices in turn could move a bit higher as well on a short-term basis. On the other hand, gold’s short-term rally may already be over or crude oil prices could move lower.
At this time, it appears most probable that oil prices will move higher and gold will follow, so the implications for precious metals from this chart are bullish for the short term.
Correlation Matrix
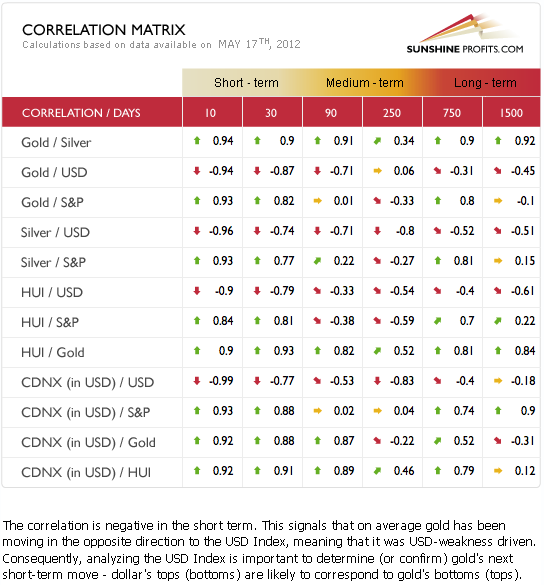
The Correlation Matrixis a tool, which we have developed to analyze the impact of the currency markets and the general stock market upon the precious metals sector. This week’s coefficients confirm points made earlier in this week’s Premium Update.
The bullish outlook for the USD Index has negative implications for the precious metals. The correlation between stocks and the precious metals is positive, but since the outlook for stocks is mixed, this is not very meaningful. Overall, there is a general bearish outlook for gold, silver and the gold mining stocks based on the medium-term breakout in the USD Index.
Gold
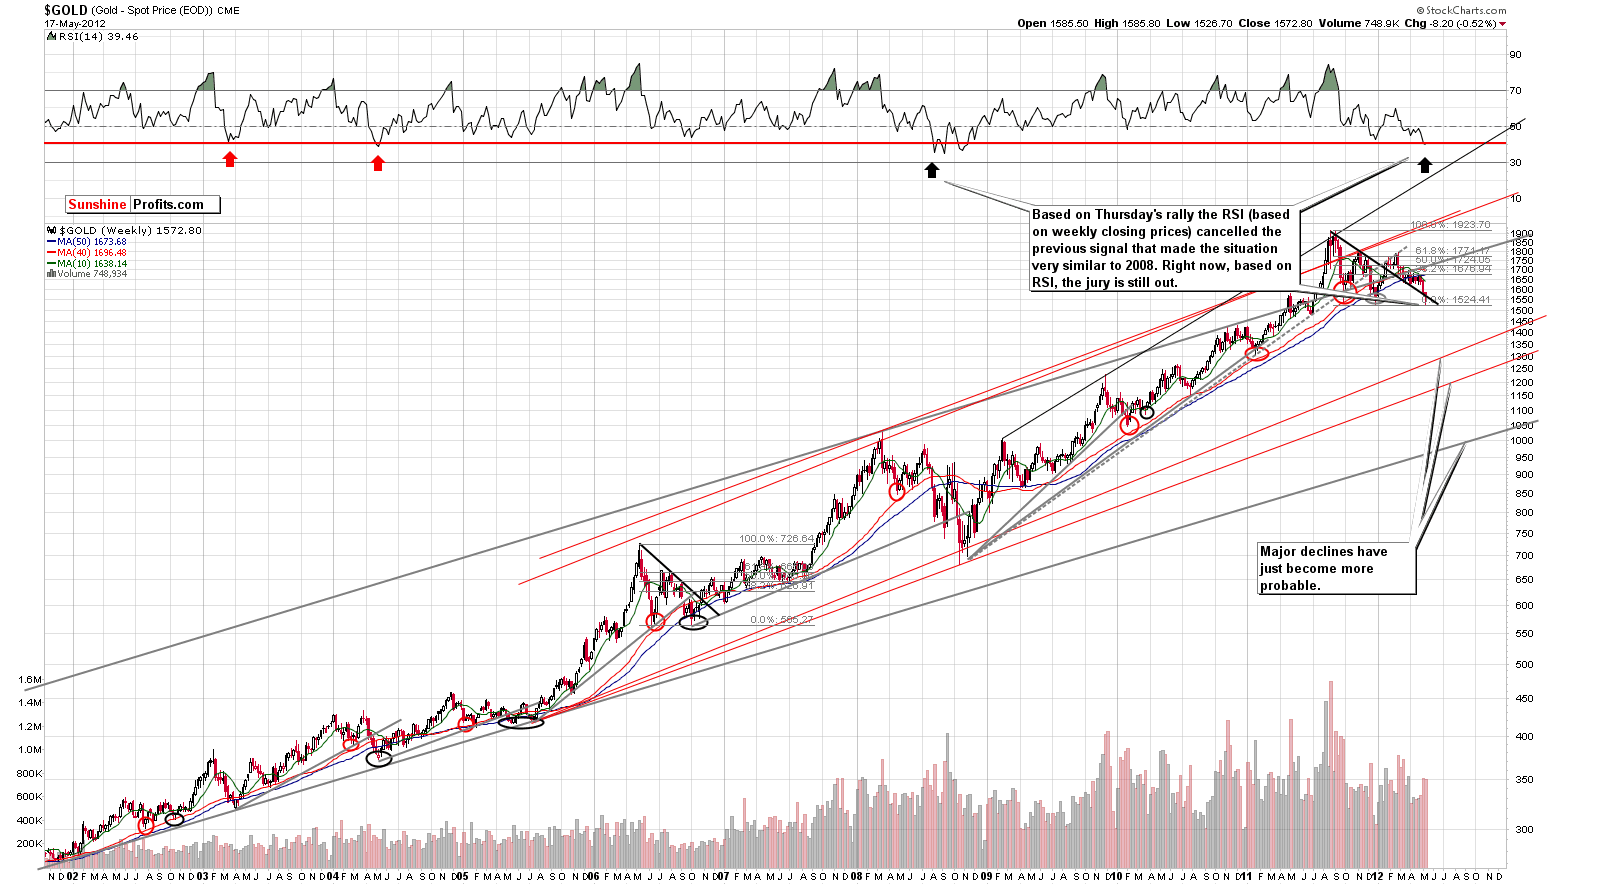
This week we begin our gold section with a look at gold’s long-term chart (please click the above chart to enlarge). From a long-term perspective, we see that gold is more or less at its support/resistance line and no decisive call can be made from this chart alone as it’s not clear if it’s above or below it.
RSI levels on this chart are based on weekly closing prices. On Wednesday, the RSI level moved lower and thus RSI was lower. However on Thursday, the final value of the indicator moved right to the horizontal red line in our chart. This is in tune with previous bottoms and no longer necessarily similar to what was seen during the 2008 decline. There is some hope here for a rebound in RSI levels, and the implications from this chart are best described as mixed.
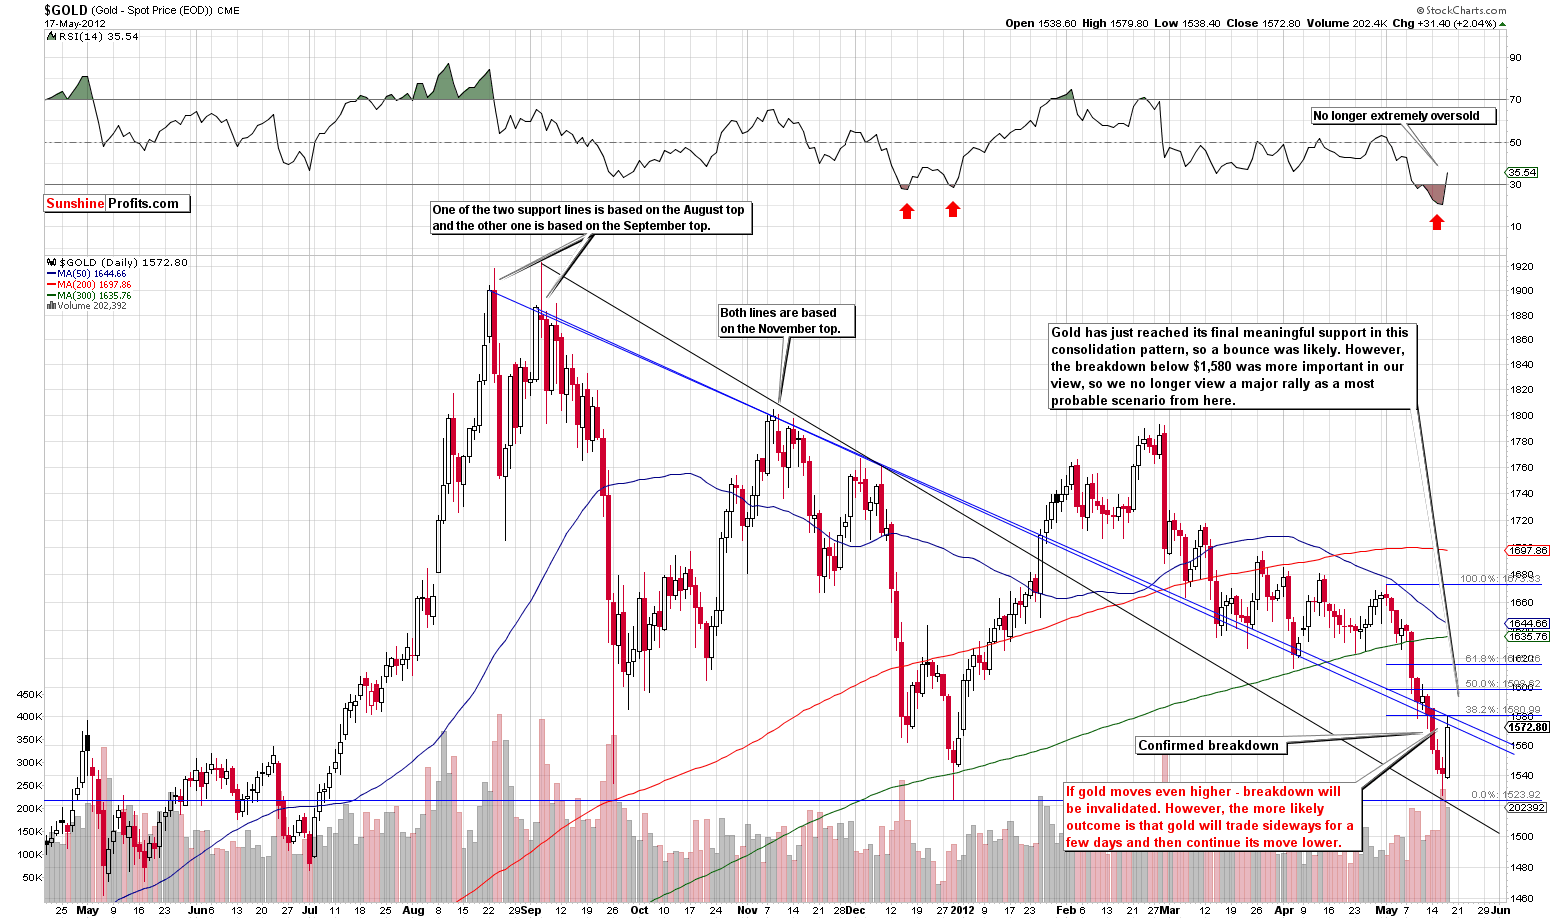
In this week’s short-term GLD ETF chart (please click the above chart to enlarge), we see that gold has provided us with a short-term bounce but not above the previously broken support line (actually right to the area indicated in Wednesday’s Mid-week Update), so the breakdown has not been invalidated. If prices move lower from here, the breakdown will be verified and closing long-term investment positions to some extent in precious metals could then be justified.
The RSI is no longer oversold and further declines in gold’s price are possible from here. There are many fundamentals reasons which point to the possibility of higher gold prices. However, from the technical perspective, the probability of a rally seems to be a bit less than 50%. If the breakdown is invalidated, betting on higher gold prices would seem to be justified. The outlook now, however, is a bit more bearish than not. Gold recently corrected to the first Fibonacci retracement level, so the short-term bearish trend is still in play.
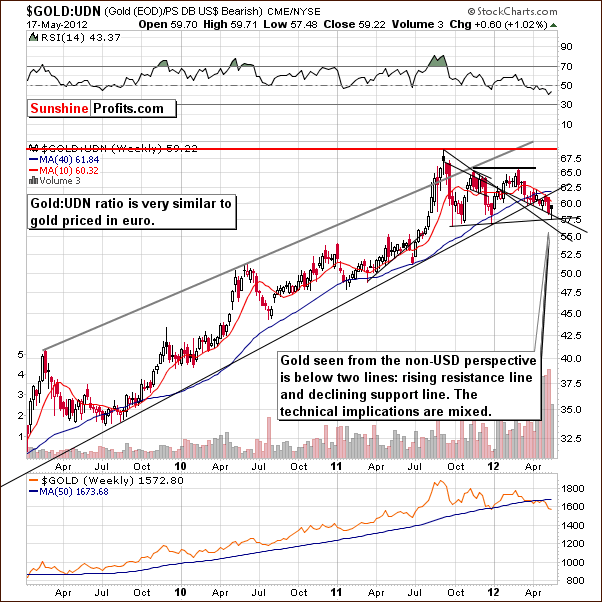
In this week’s chart of gold from a non-USD perspective, we see that the index bounced after the support line was reached. The situation is mixed here since a breakdown was seen below the rising support line but not below the declining support line. The technical implications are mixed here since the index is between these two important support-resistance lines.
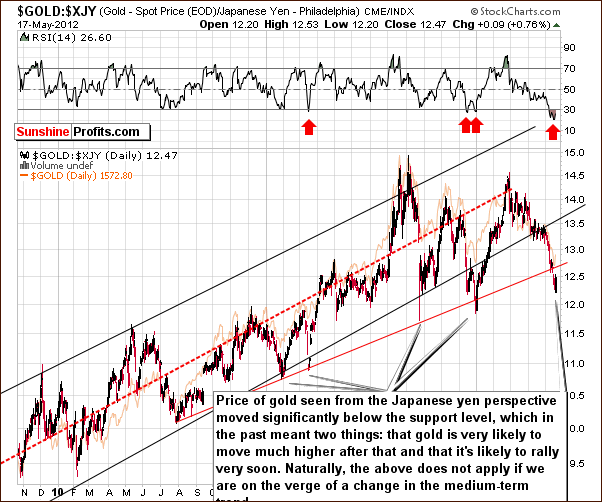
Looking at gold from the Japanese yen perspective, we see that there was little change this week and based on the trends of the past two years, the situation looks quite bullish. The problem however is that the analysis of the past two years may no longer apply. If the trend of the past two years is broken, which several other charts suggest, the initial signals here may not be appropriate. For this reason, this chart is not overly bullish but simply more bullish than not, nothing more.
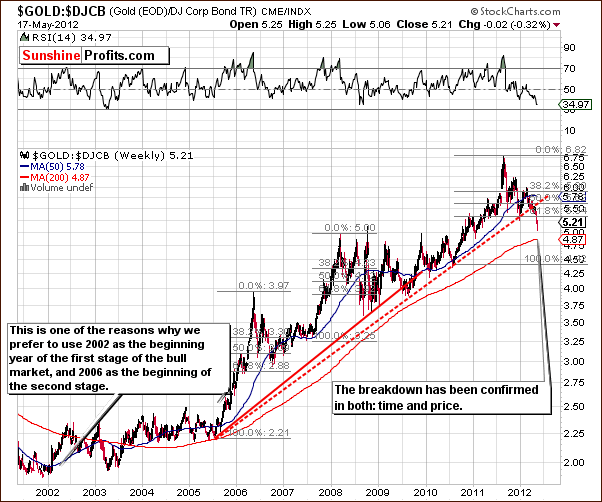
In the gold to bonds ratio chart, we have a situation which makes us concerned about the long-term precious metals picture. This ratio used to do a great job in smoothing out the short and medium term upswings and downswings, putting the whole trend into a nice perspective. It also allowed us to distinguish between the first and second stages of a bull market.
The bearish signal here is from the significant breakdown below the long-term support line. Gold has never previously broken below this line. This alone is very concerning for long-term investments and is a strongly bearish factor.
Summing up, the situation for gold now is rather mixed for both the long and short term. Since the long-term risk is to be out of the market, it appears best to stay in at this time with long-term holdings. The risk from a speculative perspective is to take a position and it seems best to remain out at this time. The next several days should clarify whether gold will move above previous broken levels, consolidate, or decline. Anything short of a sizable rally will likely lead to further declines.
Silver
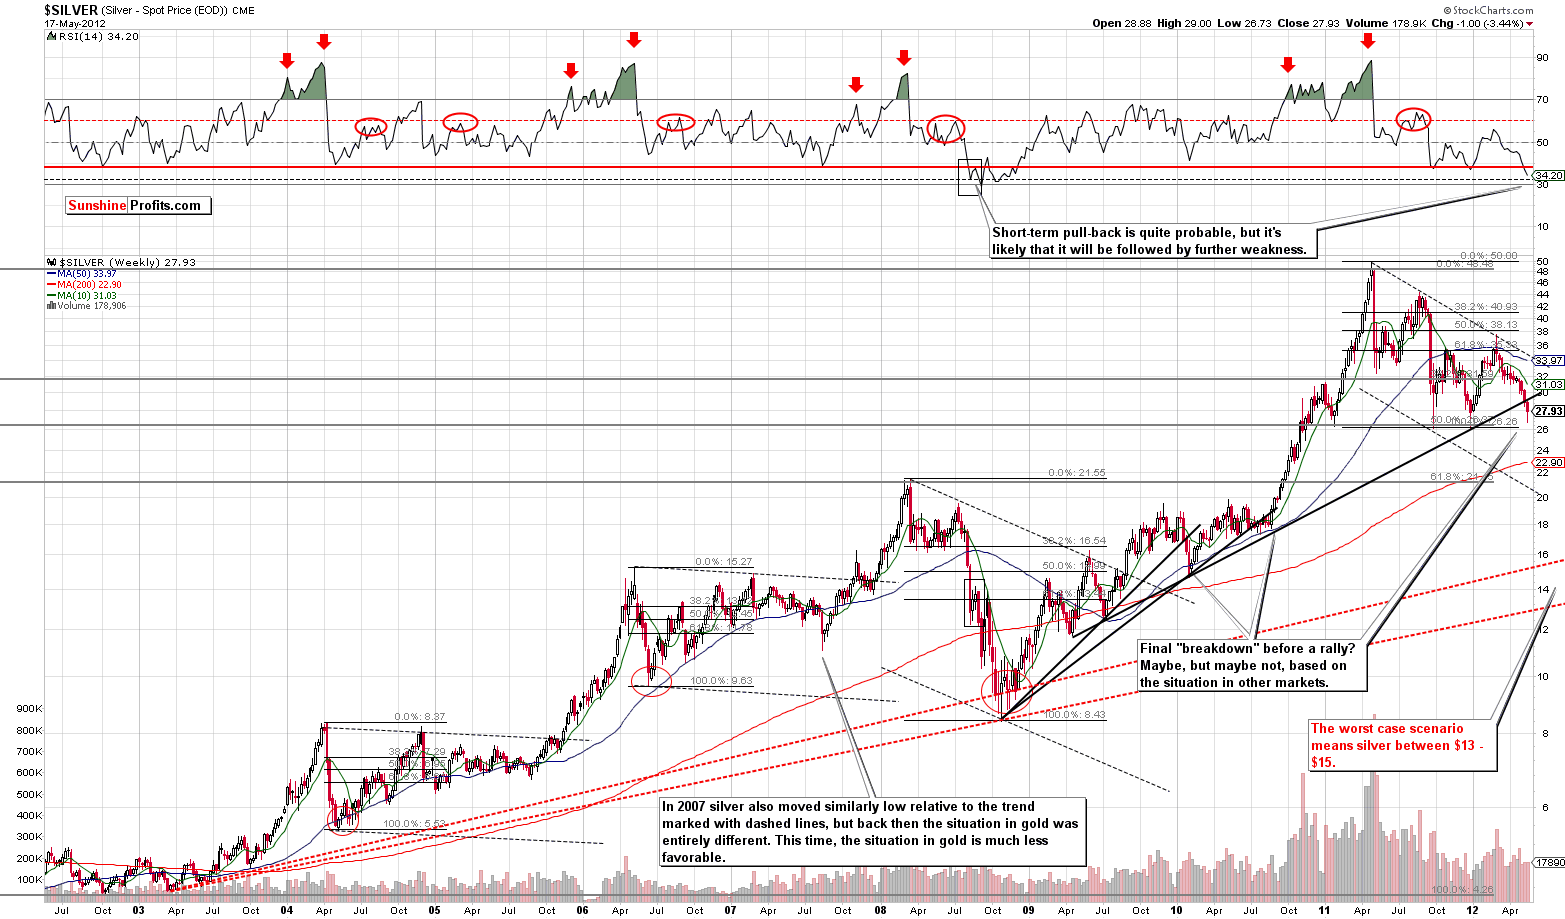
We begin this week’s silver section with a look at the white metal’s long-term chart (please click the above chart to enlarge). What has been invalidated for gold has not been for silver even with Thursday’s intra-day rally. The RSI level is still in tune with 2008. This is simply a bearish factor. After a small bounce or consolidation, declines which may be significant appear possible.
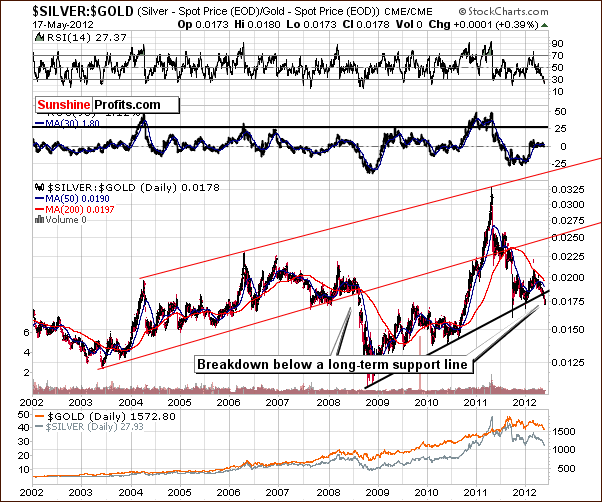
In the silver:gold ratio chart, we see that the breakdown below the rising support line is much more visible than in previous cases in 2011. The last time silver confirmed a breakdown below a similar support line, in the latter half of 2008, it was the start of huge declines in the prices of silver, gold and mining stocks. This is of great concern for the entire precious metals sector.
Summing up, the short-term situation for the white metal appears mixed at this time and so does the long-term technical picture. Long-term positions should be held for now and speculative capital should remain out of the market.
Precious Metals Mining Stocks
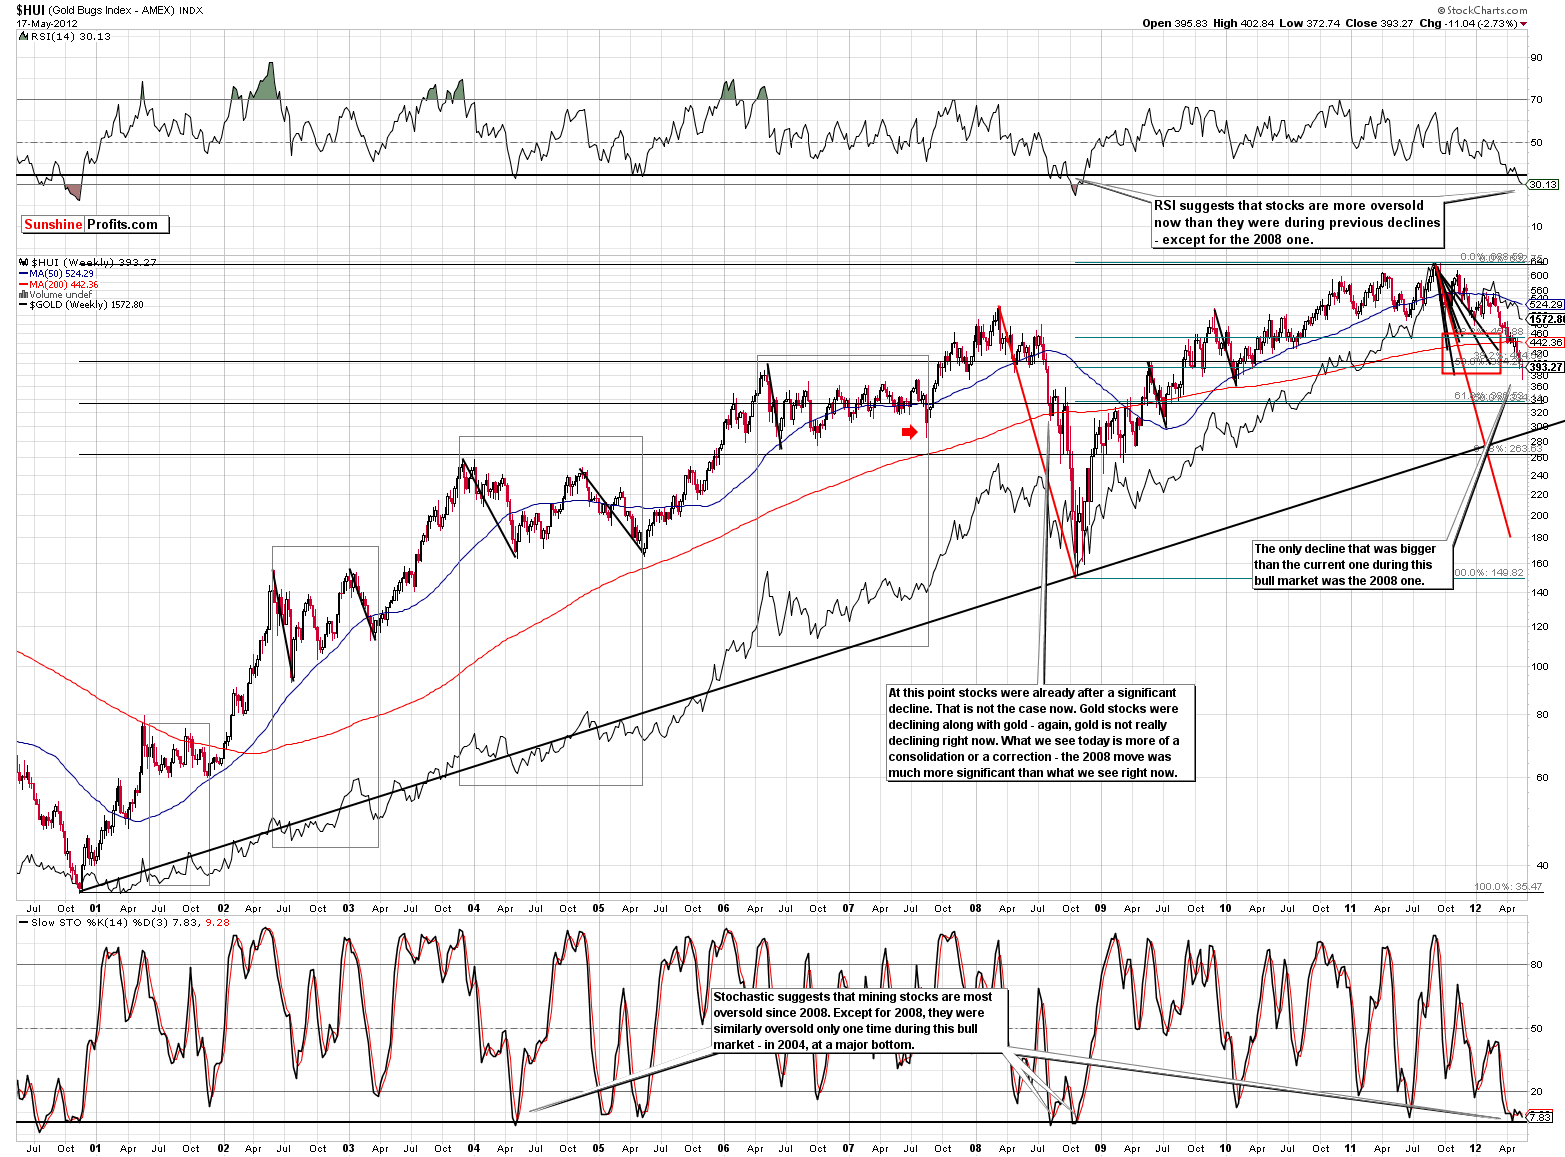
In this week’s long-term HUI Index chart (please click the above chart to enlarge), we see that the current decline has been more significant than previous ones. Only the decline of 2008 was greater. At this point we can no longer say that the current decline is very similar to other declines and that it’s not similar to the 2008 one. This is a bearish development and the RSI levels also suggest that a major decline might be underway. This is concerning, because once the RSI level moved below the thick horizontal line in the chart, downside momentum has increased in the past.
It now seems that after a sharp consolidation, further similarities to the 2008 decline may be seen. This is something which has become apparent only in the past few days. Based on other charts this week, the RSI level here, and the HUI confirmed move below the 395 level, the outlook here has changed considerably this week.
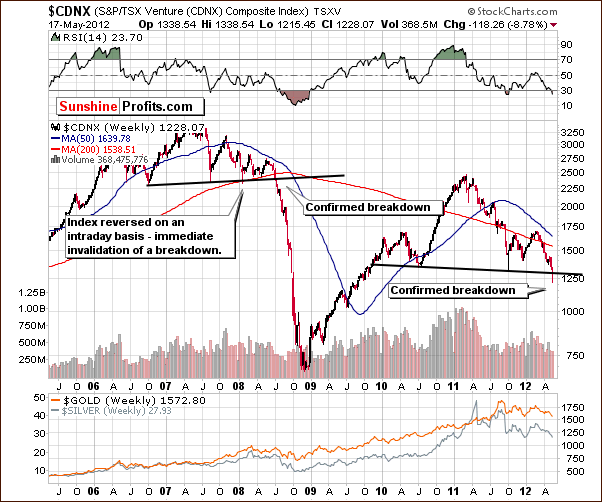
The Toronto Stock Exchange Venture Index (which is a proxy for the junior miners as so many of them are included in it) is the third long-term chart which gives us particular concern this week (in addition to gold:bonds and silver:gold ratios). A breakdown below the neck level has been seen and confirmed by three consecutive closes. In the past, this type of move was followed by significant declines.
This is of concern for both short term and long term investments. A small bounce followed by continued declines would confirm a clear “run for the hills” signal. Juniors and the whole precious metals sector pretty much plunged together in 2008.
There may be a Market Alert soon to comment on closing particular long-term positions or - preferably - hedging. This is not a sell signal yet but rather a “get ready” warning.
Summing up, the situation in mining stocks is mixed for the long and short term, much the same as it is for silver and gold.
Letters from Subscribers
Q: You were bullish until two days ago and now you turn bearish! What is the use of your recommendations?
A: We do not make any recommendations. Investment recommendations require for instance taking into account one's willingness to accept risk, ability to take risk, liquidity requirements, legal/regulatory requirements, investment time horizon, other assets in the portfolio, and other issues that are specific to each investor or trader. This is not something that can be done through a newsletter, so we provide our analysis, keep you updated, and provide ideas on how to best approach the market at any given day - of course in our view. We distinguish between investors and traders and sometimes we answer questions regarding specific given assets (like providing detailed call option characteristics two days ago), but we cannot simply suggest an action that will suit everyone - it's simply not doable via a newsletter. That's why we do not make investment recommendations.
Having said that, we are rather unsure what the ideal scenario would be - an analyst who always says the same thing? That would not be too useful in our view - after the first day of service you would know what you'll read on each following day, so there would be no point in re-reading it over and over again.
Actually, we are not really bearish on precious metals at this point. We view the situation as mixed and we think that it is probable that we will become bearish in the near future.
Q: Mr. Radomski's article on Kitco.com today has the heading "Political and Economic Factors Bode Well for Gold."
I believe this same statement could have been made back on March 12, 2012 when both the HUI and the XAU broke below their resistance levels and things have gotten considerably worse since then. Why do you think things may change at this particular time? I feel that the big U.S. money managers have gold in a rout at this time and will continue to drag it down as far as they can with the fear in the markets. They're basking in the glory of the U.S. dollar right now and that's probably good from a political/election point of view. Do you actually foresee an improvement happening in the gold market before the Oct.- Nov. timeframe?
A: That free article referred to the "long term." In this case long term is years away. The article didn't say anything about short- and medium-term declines that could be seen despite a strong fundamental outlook. For instance, in 2008 we saw metals move much lower even though fundamentals remained positive. While we are promising to keep you – our subscribers – up-to-date with the latest market developments, we are not promising that to those who read our free essays only. Actually, our essays that are posted on other websites might have been edited, so they might even be misleading). The essay that you are referring to didn’t include the discussion of the technical picture which at this time is not too favorable.
At this point it's a tough call to say when metals will finally rebound. There is still a chance that they will move much higher right away (although less than 50% in our view). If they decline, it seems that they would rebound close to the end of this year. Whether that would take place before or after the elections is a tough call. On one hand, the powers that be will want to keep gold low before the elections to "prove" that everything is ok and high metal prices were just a speculative bubble. On the other hand we could see additional QE before the elections that would likely make gold and silver move higher.
Q: I noticed that on 5/9 and 5/11 there were EXTREME/EXTREME signals for the HUI. But how often are they correct, and is there a time difference between the signals and when the HUI marks a low?
A: All in all, the indicators that were exceptionally reliable for many months - one of them had 100% accuracy when moving above the upper dashed line - have recently failed to provide a good entry point. The mechanism behind these indicators is very likely still in place, so this by itself is an indication that something in the precious metals market has changed in recent months/weeks. The same can be said about the long-term buy signal from the SP Gold Bottom Indicator - another exceptionally reliable tool that didn't mark a major entry point recently. This is odd and it should make us alert to any signals suggesting that something is in the works. In this case, we have seen several bearish signals including a confirmed breakdown. This is a subtle clue that the medium-term trend could change here.
Starting from the 2008 bottom the SP Gold Stock Extreme Indicator flashed extreme signals (breaking the dashed line to the upside) 20 times out of which 17 were correct, giving us 85% reliability. SP Gold Stock Extreme Indicator #2 was right 21 out of 24 times, which is 87.5% reliable. If you don’t count the recent few weeks, these numbers become much higher.
You can see all the signals and monitor them on a daily basis in our Premium Charts section. Also, click each chart to expand it.
Q: Do you believe there is any similarity in gold's recent price movements to the period of
September - December 2011? Is it possible that the $1520 level will hold again?
A: It is certainly possible, but not that probable. Practically this entire update is a reply to this question, so we will not go too deep into it here. As for a similarity between now and Sep-Dec 2011, we don't see it as too similar in shape. But the most important thing is that the Sep-Dec move was preceded by a powerful rally and this time a consolidation preceded the decline.
Q: Greetings, Win, Lose or Draw you guys are clearly working your tails off. We all get excited and greedy. Placing too much risk capital on the line is likely to lead to the most dissatisfaction with one’s advisors. Maybe you should advise those who can’t help but risk more than SP has recommended to go with shares over options. This way in a washout they at least have their shares that don't expire. Just a thought as the comments you shared are not likely from subscribers who followed your advice on position size. If someone must go "all in" a dividend paying major would certainly satisfy the urge to participate with the downside risk limited and a dividend payment if the slump is prolonged. Blessings!
A: Thanks. Actually, we haven’t worked more in the last two weeks - we have just been working more on the current issues and less on new features (tools, instructional videos, etc. - for the new website). On a personal note, your Editor planned working a bit less at this time and focus more on the CFA material (your Editor's CFA exam is on June 2nd), but since the situation on the market has been critical, we worked a lot anyway.
At this time we are not so sure about investing in major miners, but we agree that paying attention to position size is extremely important - especially when leverage is involved. Naturally, when using futures, options or other derivatives, one should use a much smaller amount of capital for each trade.
Q: What is your projection for the gold miners low index (GDX)? I am in a heavy losing position at this time. Is it best to allocate the whole gold miner stock position to the long term and wait through the pain, or like you say, sell the speculative now?
A: Whatever we held as a speculative trade was sold yesterday (naturally, after - ! - sending out the Market Alert) and we suggest doing the same. We will likely suggest opening another position quite soon, but at this point it is a tough call whether it will be short or long. The former is a bit more probable at this point.
Q: Thanks for the update.Something interesting I have noted on the GLD ETF:If you subtract the low of approx. $150 from the high of $185.85 in the current correction you get almost the same answer as if you go back to 2008 and subtract the low of about $67.50 from the high then of about $101: $33.50 vs. $35.85. I am only using approximations of both declines in GLD. About the same decline. Does that seem significant in any way?
Also,on the GLD using the400-day MA line it looks like June of 2009. It touched that line before a small move up then a much larger move up. I use Stockwatch.
A: On a linear scale chart your observation would have quite bullish implications as it would suggest that the current decline is very similar to the 2008 one and that it is likely over. However, for long-term comparisons we prefer the logarithmic scale, which puts everything in relative terms, i.e. in percentage terms. Please note that when gold was at $400, then a $20 move was quite a big deal as it meant a move of 5%. Back then that would be something exciting. Right now, a $20 move is something seen on a daily basis and is nothing to call home about by itself, being slightly more than 1%. Currently, we would need to see a move of $80 to have a similar rally/decline in percentage terms. Since technical analysis is based on the fact that markets are emotional, we should focus on the perspective that allows us to compare different emotional states. In this case we prefer to focus on percentage-wise comparisons.
The 400-day moving average has indeed been hit and it has likely contributed to the small rally that we just saw - similar to the 2008 action.
Q: Thanks for the update. Gold just touched the same level as late December 2011 (~$1520s). Why not consider the probability of a double bottom?
A: Actually, including the September 2011 low, that would even be a triple-bottom. It could be the case that we are seeing this pattern, but it's not that likely. Gold didn't used to correct in that fashion, the declining support line has been breached, USD confirmed a breakout and juniors have confirmed a breakdown. These are the technical reasons that make us more bearish than not for the medium term. Additionally, gold declined in recent weeks despite several signals that used to be very reliable in the previous months and years, which is a subtle indication that things may work differently this time.
Q: Which level do you use as the closing level?4:00 or 5:30?$1581 at 4:00 on Stockcharts; $1578.55 at 5:30 on INO; and $1580.40 - 1581.40 at 5:15 on Kitco.
A: In short, we would use Stockcharts values (4 PM ET). They will correspond to closing values from finance.yahoo.com for instance. However, when it comes to confirmations, we would use all of them. Put another way, we will not view a breakdown to be confirmed if gold closed $0.10 below the support level (or $0.05 for silver or so). If the price is not clearly below a certain price level, then the breakdown is not confirmed. Again, the price was clearly below the price level recently, and thus the breakdown was confirmed.
NYSE, NYSE MKT and NYSE Amex Options are open from Monday through Friday, 9:30 a.m. to 4:00 p.m. ET (source: https://www.nyx.com/holidays-and-hours/nyse)
Q: 90% of commentators on KITCO are bullish on gold. However one writer on 321 gold editorials had a very convincing report that all this bullish action is very bearish. He proves that gold will soon plunge several hundred dollars. Gold has hung around in bargain territory too long. Something is wrong. Too many are sure gold is turning up and that is not a contrarian move. Gold is doing the opposite.
A: We agree that most precious metals analysts are now bullish. However, we are not so sure about using that as a contrarian indication. Declines become likely when the investment public (not necessarily the pros) is extremely bullish. That is not necessarily the case right now. Yes, analysts are humans and are emotional even though they try to control their emotions when it comes to analyzing markets, and with everyone on the same side, the situation starts to look bleak. However, we don't view this as a strong signal.
On a side note, the change in our attitude toward the precious metals market in the medium term might be seen as a bullish sign to some as well. It's up to you to decide whether we have likely acted on emotions or on facts and analysis.
Q: We like Sunshine Profits. As friends, we wanted to offer a bit of feedback for your consideration. Although you lead off each premium update with a tour of world events, you seem to ignore them when you look at market patterns. We would like to submit the thought that it only takes one Black Swan event to completely blow away all charts and patterns.
In today's world, Black Swans seem to be circling in flocks. If you would consider looking up from the charts and note that the sunshine is a bit dimmer than usual for all the Black Swans circling above, it will become less likely that you will submit an 80% probability of a rally at a time when Greek and French Socialists are poised to win and launch another euro spiral down and subsequent dollar rally. Our hope is that you will temper future assessments of rallies with a sober look at the events that have a high probability of being game changers. Thanks for listening.
A: Thank you for your feedback, we are always happy to read anything that could help us better analyze the markets or to provide a better service for you in general.
We generally don't mix the fundamental picture with technicals. We analyze them separately and then combine them at the very end of our analysis. The point is that fundamentals have been favorable for precious metals so the long-term impact is similar on a week-to-week basis. That's why our timing analysis focuses on signals coming from charts. Events that we comment on at the beginning of the update are generally already in the price, which means that we do analyze them - through the analysis of price patterns and charts.
"Black Swan events" refers to generally unforeseen events that are characterized by very high impact and very low (!) probability. These events include things like default on COMEX/NYMEX that would send the price of silver to the moon, destruction of the financial system, and Bernanke's acknowledgement that printing money out of thin air is wrong. Also, the outcome of French elections is not one of the Black Swan events as it was a highly probable event. The euro-down-gold-down link is not always obvious and since Hollande's victory was quite likely, it was not necessarily likely to decrease the euro's value as it could have already been "in the price."
The bottom line is that we include Black Swan events in our analysis at all times - by suggesting keeping some assets in physical precious metals. By definition, it is highly probable that Black Swan events will not be seen, so we focus our analysis on what is likely and make speculative suggestions based on that.
Again, please continue to provide feedback. We love to read it and appreciate it even though we can't guarantee to implement each and every suggestion.
Q: This has always bothered me: 80% of the time the dollar and gold move in opposite directions; but not 100%. There have been times when both went up at the same time. Today, there was a significant breakout of the dollar and you saw this, and other factors, as the reason to turn bearish on gold.
The European Hedge Fund groups (rumor has it) are thinking of parity between the dollar and euro. I think that the euro will dip to the 1.10 to 1.20 zone sometime in 2012. That might put the dollar between 85 and 88 (far above the current 81.30 level) later this year and I am betting this might happen.
But if the dollar is 85-88 and super strong, then American exports will take a swift and sharp downturn. The US government will not permit this, especially in an election year. But the euro is "going down lower."
Today Yahoo news reported a "Bank run in Athens" and 700 million euros were removed last Monday, May 14th. This will continue and the quantities withdrawn will increase. Contagion will follow and the Spanish, Italians and Portuguese may follow suit and withdraw. Spain and Italy have THREE TRILLION euros in deposits. If but 10% is withdrawn, where do you put the 300 million euros? Buy wine? No, the Europeans will put a large percentage into gold and silver and that will "move the market" in gold and silver and discourage the market in the value of the euro. QE3 both European and US style will pour more funds into this "financial situation" and into gold bars and coins in Europe. Mr. Russell calls China the synthetic put in that at low prices the Chinese and many other nations will be buying gold and silver.
I am working with the premise (unlike yours) that gold and the dollar will both advance to some point at which the US government will intervene and say that exports are more important than a strong dollar and gold will be even stronger. I am working with the understanding that QE3 and QE4 etc. are inevitable (according to Bill Gross of Pimco).
A: We generally agree with the above to the extent that the presented course of action is quite probable. We would like to point out that there are alternatives to gold and silver. For instance, people could turn to… the US dollar as they have been doing in the past few weeks especially when they see that "precious metals are now declining" and "USD is rallying." Again, they could turn to metals, but that's not a sure bet. Most likely they will eventually turn to metals, but not necessarily soon.
Q: How can one sell when literally ALL the miners and gold and silver bullion are "well UNDER RSI 30" the sign of being oversold and the time to buy? How can you, who insist on value, write “sell”? AEM and AUY are now paying dividends of around 2.5% which never existed before 2008 (unless you go back to the 1930s). In 2008 the markets went down hard but there was NO QE3. There is now and it is coming.
A: We admit that we personally don't like selling into a market that is already oversold. Most times when markets are oversold and trade at favorable P/E, P/B ratios, it is indeed a good time to buy. At least it probably is a good time to buy if you only care about making a profitable trade that will take several years to complete and you don't mind riding out any major declines that might happen along the way.
However, at times the situation can go from oversold to extremely oversold. One of our favorite sayings about the market is that "the trend is in place until it's not." Sounds obvious, but it's quite complex. The point is that until we have reliable signals that the trend has reversed, it pays to bet on its continuation after each pullback. That's why we emphasized the importance of the breakdown and its confirmation. Since it was seen (along with a few other important signals), it is now quite probable that the markets will enter a period of decline. It will not be based on fundamentals, but rather on emotions. It was likely that such a correction would be seen eventually (note our comparison to the previous bull market posted just a few days ago) and it seems that this is it. The situation is not bearish enough to justify selling long-term holdings, but it is about to become like that.
The point is, buying undervalued assets is a good thing, but buying extremely undervalued assets is even better. Based on the size of the expected decline, it seems that most investors should indeed consider temporarily adjusting the size of their precious metals exposure (selling or preferably hedging), but if you are fine with riding out a decline that could be somewhat comparable to the one in 2008, then that's perfectly fine with us.
Summary
The precious metals situation has changed dramatically this week. Breakdowns have been seen and confirmed below key support levels. The USD Index moved decisively above 80.5.
Additional important breakdowns have been seen in the gold:bond ratio, the silver:gold ratio and the Toronto Stock Exchange Venture Index. These ratios and indices provide major long-term bearish signals this week. Continued declines in prices for gold, silver and gold mining stocks are a bit more likely than not in the medium term. Some sideways trading or a small rally is possible but will likely be short-lived. At this point, it does not appear probable that prices will move higher for anything more than the very short term.
The thing that we would like to emphasize here is that the situation may still change to bullish if precious metals rally heavily. If gold moves back above $1,580 (it is at $1,590 at the moment of writing these words) and stays there for 3 consecutive trading days and the situation improves in gold:bonds ratio, silver:gold ratio and TSXV index, when we will likely get back to the bullish camp. In a way, we would want that to take place, but our wishes have nothing to do with reporting what’s likely, and at this point the situation simply doesn’t look too good.
Keeping long-term positions intact appears best at this time and avoiding opening speculative positions seems justified.
On a side note, we referred to hedging as being superior to selling of long-term holdings. We feel that this may be a bit unclear to some, so we decided to provide you with more information about it. Instead of simply writing it, we will provide it as a document that will tell you something about the direction in which the new website will take us. Here’s the link. The middle part is a dialog between Eric and John – which you may „know“ from the video on our homepage.
This completes this week’s Premium Update. Our next Premium Update is scheduled for Friday, May 25, 2012.
Thank you for using the Premium Service. Have a profitable week and a great weekend!
Przemyslaw Radomski

