
We’re getting whiplash from all the political changes in Europe, neo-Nazis in an unstable government in Greece and a changing of the guard in France-- "adieu" to Nicolas Sarkozy. We see plenty of reasons for holding on to our gold positions despite the clobbering the yellow metal got on Wednesday down to a four-month low. The euro tumbled this week against the dollar in the worst run since 2008. There is an intense resurgence of political risk in Europe and a couple of months of weak jobs numbers in the U.S. All that has put stimulus back on the table. Another item on the table is the risk of a Greek euro exit, which has risen to as high as 75 percent; according to Citigroup Inc. We also see a rising anti-austerity tide gaining ground in Europe and the abolishing of a gold excise duty in India, all favorable for gold.
Francoise Hollande has been elected France’s president, the first socialist president in almost two decades, on the promise that he would deliver an alternative to the austerity diet. The French have been wondering who had moved their high-calorie cheese. They have become tired of the message reiterated by Nicolas Sarkozy that painful choices and belt tightening will bring jobs and growth. Hollande takes power at a critical juncture for both France and Europe and he will have to deliver fast --no honeymoon vacation. France has a ten per cent unemployment rate and its labor costs are among the highest in the OECD. With a budget deficit for almost 40 years, France lost its triple A credit rating this year. The day after Hollande takes power next Tuesday, France must raise €12 billion on the markets. He then will have to convince German chancellor, Angela Merkel, who was cozy with Sarkozy, to renegotiate the European budget austerity pact to add measures on growth. Investors are worried about potential tension between Germany and France, the two eurozone heavyweights.
It is not likely that Germany will be willing to foot the bill for Hollande’s campaign promises.
So far, 10 European political leaders out of 17 have been ousted out of office like a falling dominos in a little more than a year.
The issue that has angered voters other than unemployment is austerity. We know from personal finances that when we overspend, we must cut back, pay our debts and rebuild our savings. That’s the prudent thing to do and that’s what the austerity school preaches. But what happens if the financial hole is so deep that there is no way to climb out by reasonable cutting back and saving? That’s when you declare bankruptcy and your creditors share the pain. The laws of capitalism decree that if you don’t assess risk correctly, you lose money. The conclusion is that austerity has to come with a mechanism for default, which is not the case in Europe.
The growth club, represented eloquently by New York Times columnist and Nobel Prize winner Paul Krugman, believe that borrowing and spending will spur growth and consumption and that austerity will begat only more austerity. In other words, the European Central Bank (ECB) should print money and then Greece and the others can service their debts with cheaper euros due to the inflation caused by money printing.Is this not a kind of default, since you are paying back your debts with devalued money?
We believe that the massive printing of euros will eventually take place and please keep in mind that unlike Fed, EBC has still room to lower its main interest rate. Once markets believe that this is the likely (or even inevitable) outcome, the gold price will soar not only in terms of euros but also in terms of other currencies.
The ECB recently lent money at concessionary rates to European banks in an effort to co-opt these nearly bankrupt institutions into financing the nearly bankrupt European sovereigns. They offered loans against dubious collateral, to tempt commercial lenders to play the “carry” game, namely, buying Spanish and Italian debt of varying maturities yielding up to 7% while paying a mere 1% for a three year loan. The prospect of a devastating run on banks was avoided, for now.
We wonder if this is not pushing the can down the road.
There are certain things that look to be almost inevitable. The eurozone is in trouble, in particular Spain, Portugal and Italy. (We don’t even talk about Greece, that country is already just about bankrupt in more ways than one.) The longer this crisis will take to play out the deeper it will get with more countries caught in the net, with Belgium, France and Netherlands not far behind. The proportion of young people between the ages of 15 and 25 who are now without a job is 51 per cent in Greece and Spain, 36 per cent in Portugal and Italy and 30 per cent in Ireland. In France “only” one in five young people are out of work.
History has shown over and over again that when there are deep economic problems, the monsters that lurk in dark, dank corners come out brazenly into daylight looking for victims or scapegoats. It wasn’t so long ago when this is precisely what happened in Europe. This week in Greece a Neo Nazi party took 21 out of 300 seats and 7% of the popular vote – the first neo-Nazi party to enter a European assembly since the Second World War. This is enough to give us shivers. The center seems to be falling apart and the extremes of left and right are gaining power.
Even Somali pirates preying on merchants ships are having a hard time due to the economic downturn. On the one hand, things couldn’t be better for them. Shipping companies have reduced ship speeds through the highest-risk area to save on fuel, making the ships easier targets. But the companies have switched to relying on guards, rather than speed, for protection, which will make for shoot outs on the high seas. The math is simple. A single day at lower speeds can save $50,000 in fuel at current prices - enough to pay the guards for the entire journey.
The image reminds us of Europe, a cumbersome ship overgrown with barnacles, trying to make its way in pirate-infested waters. Instead of finding a solution to the problem, and perhaps there is no simple or fast solution, European leaders keep finding stop-gap, make-do, arrangements. So, do you put on speed with the hope of creating jobs and growth and outrunning the pirates, or do you cut back and hire armed guards?
With so much happening in the markets let’s turn to the technical part with analysis of the US Dollar Index. We will start with the very long-term chart (charts courtesy by http://stockcharts.com.)
USD Index
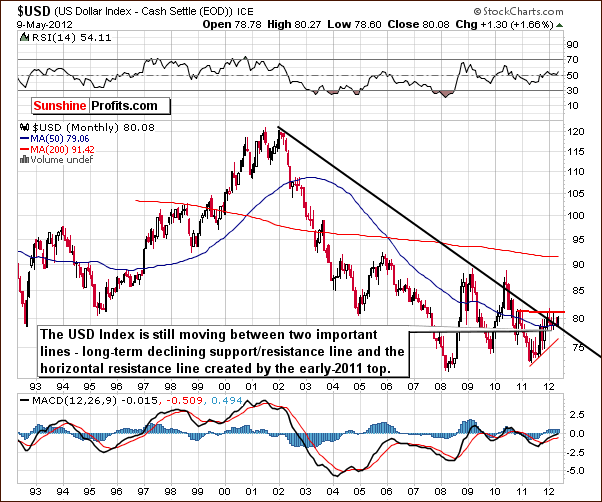
We begin this week with the long-term USD Index chart. Very little has changed from the long-term perspective so remarks made in last week’s Premium Update are still up-to-date:
We see that the sideways trading patterns continue between the two levels which are quite important from a technical perspective. These are the declining long-term support line and the horizontal support line based on the early 2011 high. At this point, the very-long term chart remains mixed with a bearish bias.
To illustrate how small the trading range has been for the USD Index recently, the past six Premium Updates have found the change from the previous week to be as follows: down .41, down .61, up .95, down .79, up .25, down .39, and up .31. So nearly every week saw a change of less than 1% for the index value of a week earlier, and with the good mix of ups and downs, this is a prime example of true sideways trading.
This week, the USD Index rose .95 since last Thursday to its highest level in several weeks, so the difference should be visible from the short-term perspective.
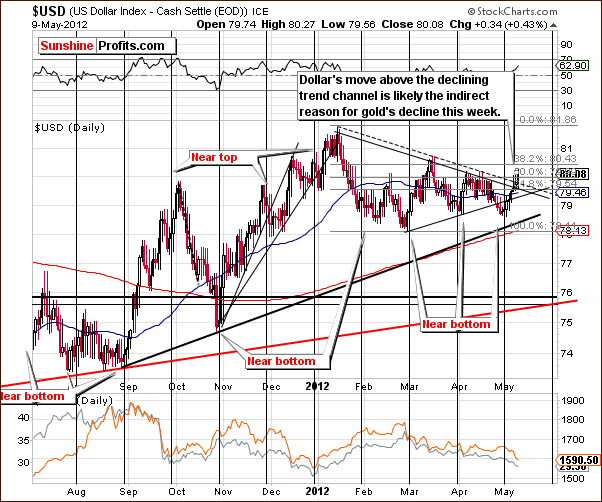
Indeed, in the short-term USD Index chart, we saw some visible and meaningful developments this week. The USD Index moved above the declining resistance line, and this contributed to the lower precious metals prices which were seen this week.
There are likely not many implications going forward, as the index has only closed above the resistance line once. Two additional consecutive closes are needed for this breakout to be confirmed. Such a confirmation would be quite bullish for the dollar and likewise bearish for gold and the precious metals.
It’s important to note that the breakout has not yet been confirmed and invalidation of breakouts and breakdowns are quite commonly seen in the USD Index. The late April breakdown is a recent example, and it’s prudent at this time to wait for a confirmation before making any moves.
Summing up, all in all the situation in the USD Index is mixed and no longer bearish for the short term. We have seen a breakout this week but it has not been confirmed, hence the situation remains mixed at this time and is not really bullish either.
General Stock Market

In the long-term S&P 500 Index chart, we see that prices have moved below the support line created by the 2011 highs, which looks bearish. Taking a relative comparison to the similar rally that we saw in the second half of 2010 with the current price patterns, it seems quite possible that we could have simply seen a correction with a rally now to follow.
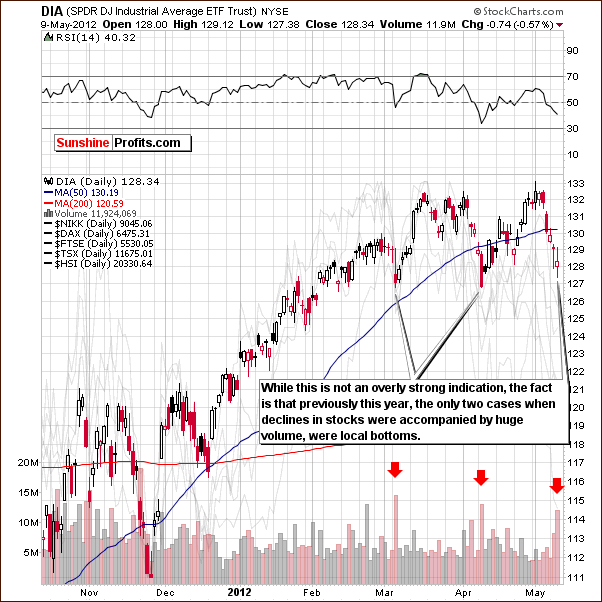
In the short-term DIA ETF (a proxy for the Dow Jones Industrial Average), we’ve seen a decline and an intra-day reversal on significant volume. Twice previously (taking 2012 into account), such a move coincided with a local bottom. Consequently, the situation here is now more bullish than not.
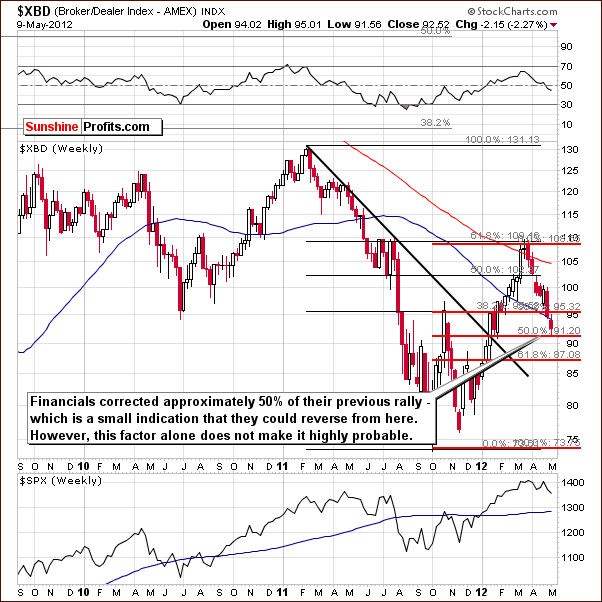
In the Broker Dealer Index chart (a proxy for the financial sector), we do not have any clear “buy now” signals (based on this chart alone) but may have some confirmation here that a bottom has formed in the general stock market. This index bottomed at the 50% retracement level of its previous rally, something that could be expected during a correction (just like a bottom being formed with financial at other Fibonacci retracement levels, so, again, this is not a crystal clear buy signal).
Summing up, the situation in the general stock market is mixed for the long term and bullish for the short term. Overall, it is best described as more bullish than not.
Crude Oil
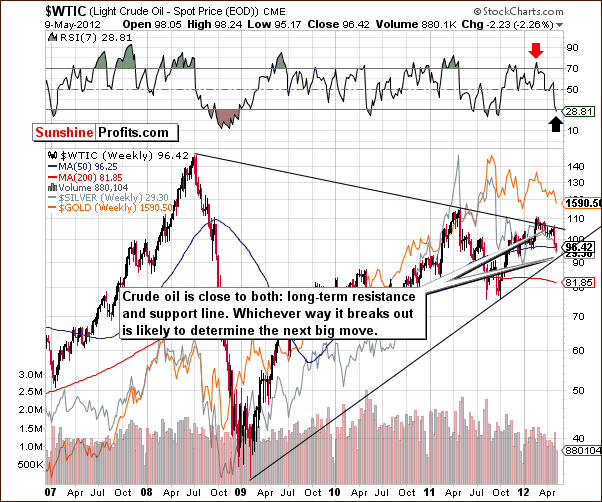
We now look at the crude oil price chart where we see that prices have moved lower after trying to break out above the declining resistance line. Since that attempt, prices have declined and are now actually close to the long-term support line. RSI levels suggest that a rally is likely to begin sooner rather than later. Another small move to the downside may be seen, and a powerful upturn could follow. The situation will become clearer once oil price finally confirms either a breakout or a breakdown.
Overall, the signs here are blurry but favorable for gold in the short term, as the gold market has been generally aligned with the crude oil market this year. This is not necessarily true for the very short term, but the two markets were generally positive correlated lately and their overall directions are similar. The implications from the crude oil price chart this week are a bit more bullish for gold than not as the support line is closer than the resistance line and the RSI says “buy”.
Correlation Matrix
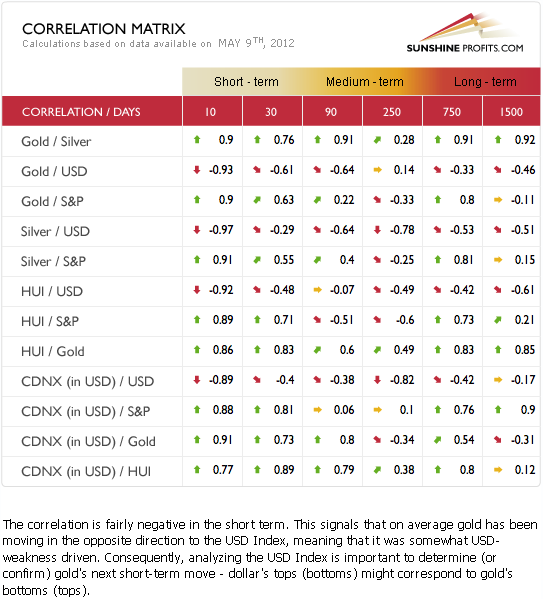
The Correlation Matrix is a tool, which we have developed to analyze the impact of the currency markets and the general stock market upon the precious metals sector. This week we see that precious metals are negatively correlated with the USD Index and positively correlated with the general stock market. With the picture being somewhat mixed for the USD Index, there do not seem to be any major implications for gold, silver and the gold and silver mining stocks. The outlook for the general stock market however is more bullish than not, and the implications for precious metals are therefore more bullish than not as well.
The breakout in the USD Index has not been confirmed, so the situation is mixed without overly bearish implications for gold. If the breakout is confirmed, the impact will change to bearish.
Gold
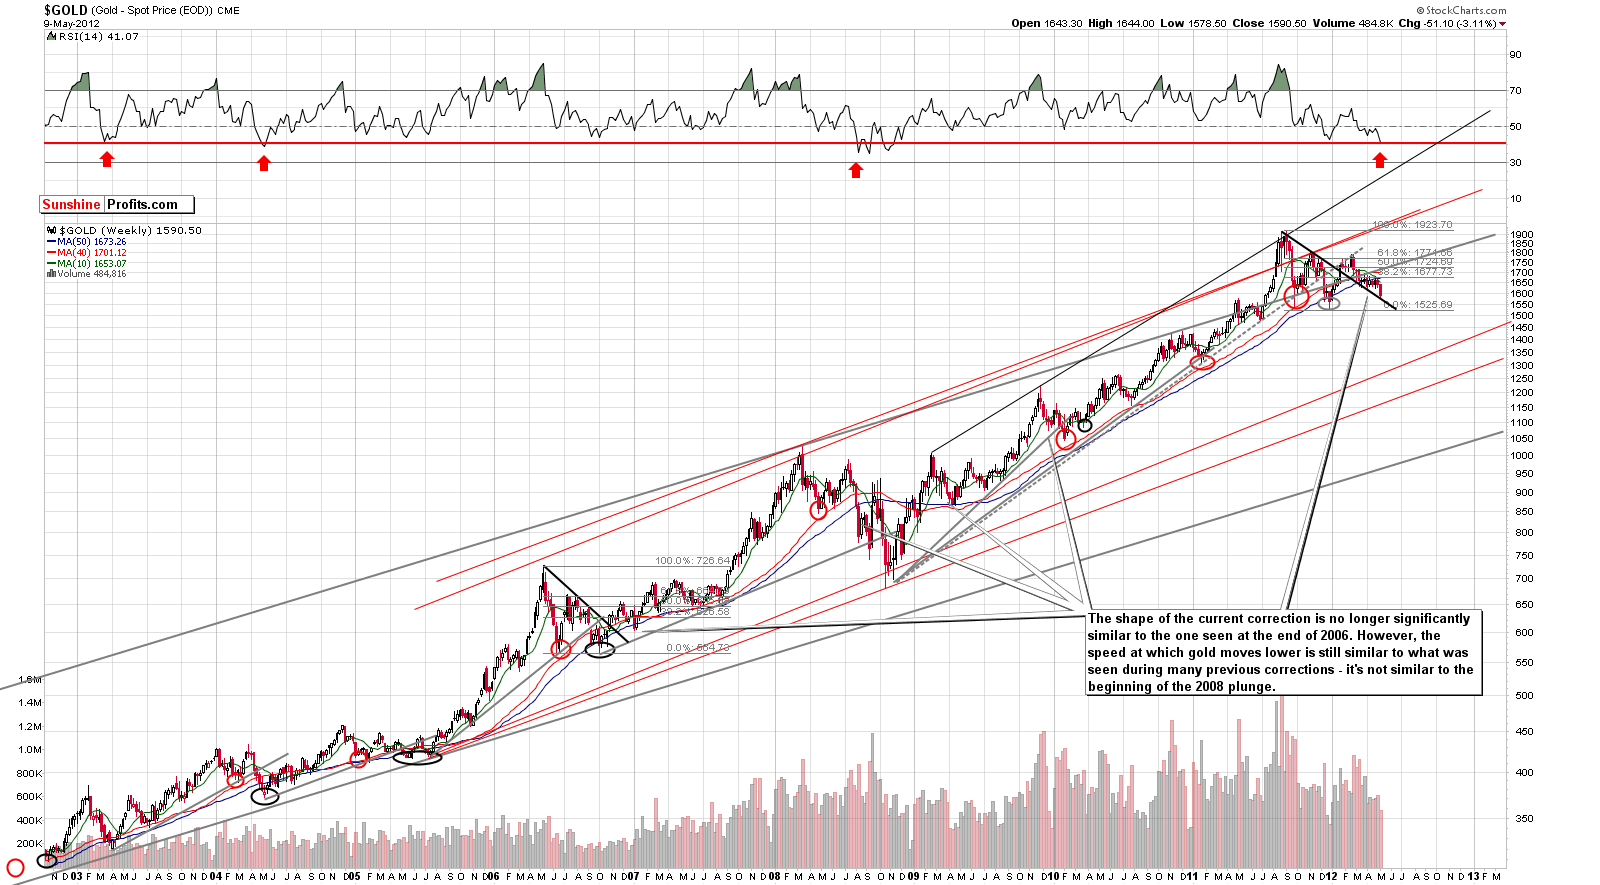
This week we begin our gold section with a look at gold’s long-term chart (please click the above chart to enlarge). Based on this week’s downturn in prices, the shape of the recent decline/consolidation is no longer very similar to what we saw at the end of 2006. The recent price action of gold has been seen in consolidation patterns in the past but is definitely not similar to what was seen at the beginning of the 2008 decline.
Comparing long-term price patterns alone, we actually have bullish implications this week. While the situation is not as bullish as a few weeks ago, the outlook is still positive based on the overall shape and the fact that recent correction has been quite significant in terms of price and time.
RSI levels have only been as oversold as they are today on a few occasions in the past and are the most oversold since the 2008 decline. Except for 2008, lower levels were seen only two times: once in 2003 and once in 2004. Both times, gold was at or close to major bottoms. The implications are therefore bullish at this time, as the current situation is still more similar to corrections other than the 2008 one.
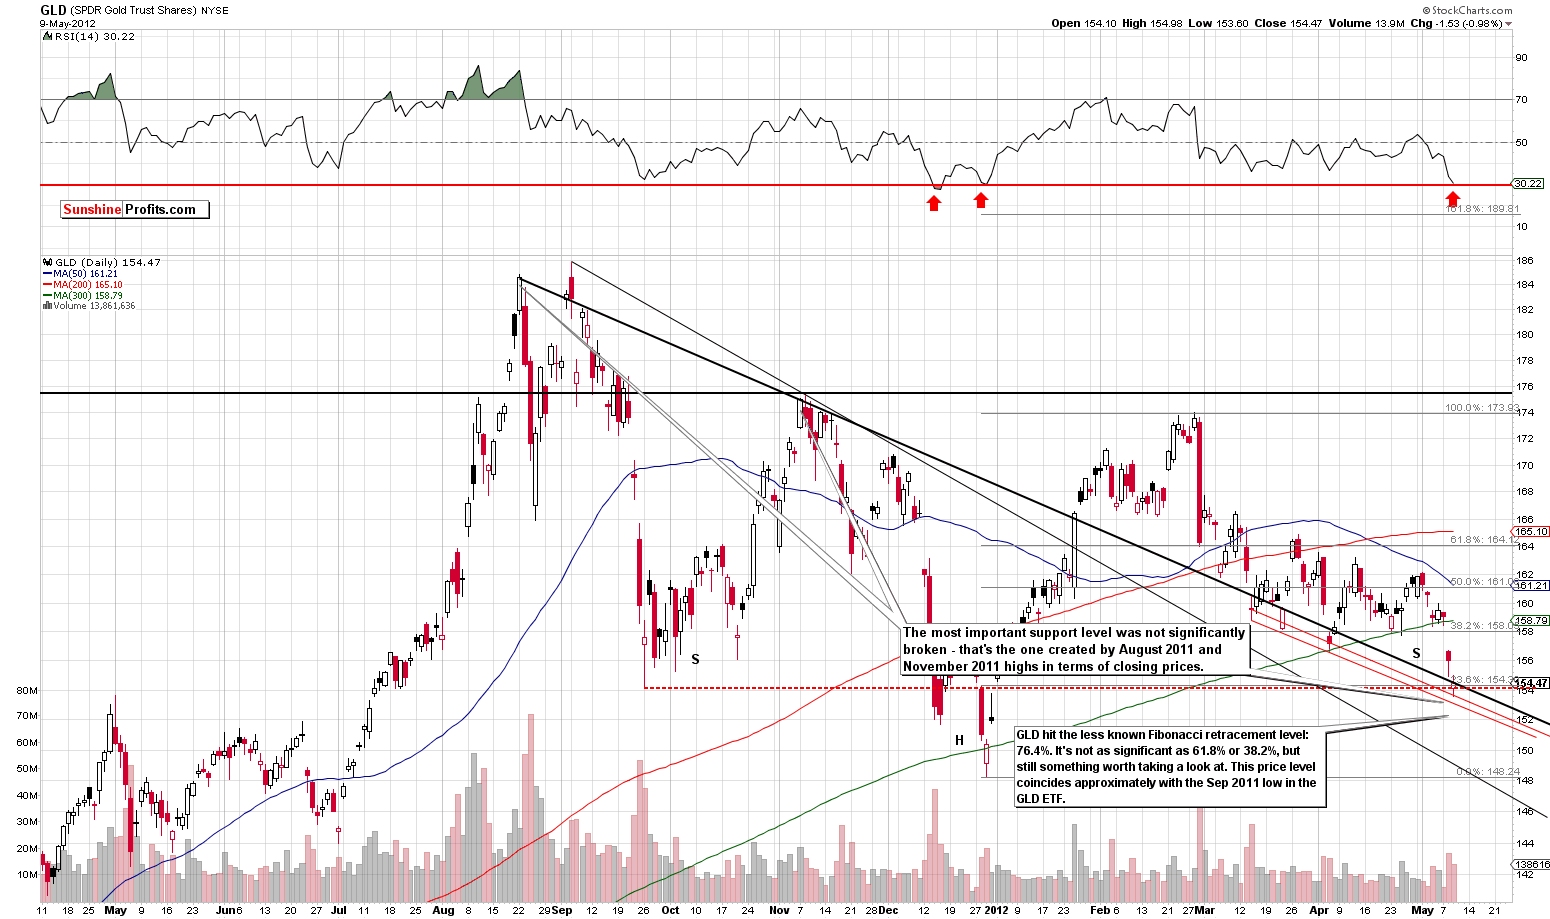
In this week’s short-term GLD ETF chart (please click the above chart to enlarge), we have almost the same low RSI reading, though this chart is based on days as opposed to weeks. Consequently, the situation is very oversold and likely to ignite at least a pullback based on the RSI alone.
Price levels are now of great importance. The question is: has gold’s price confirmed an important breakdown. Support and retracement levels indicate that gold’s price decline stopped approximately at the place where important support lines coincide. Even the move below the $1,600 level has not been confirmed. Two more days of closes below $1,600 are needed and the price is now only slightly under this level.
The key support line indicated in our chart is the declining line based on previous closes during major tops (August 2011 and November 2011). Since yesterday’s move to the downside have not been verified, the situation is still bullish. Previous attempts (two in March and one in early April) to break down below this level have resulted in an immediate price reversal, and this is expected once again. Based on that, the breakdown will likely not be confirmed.
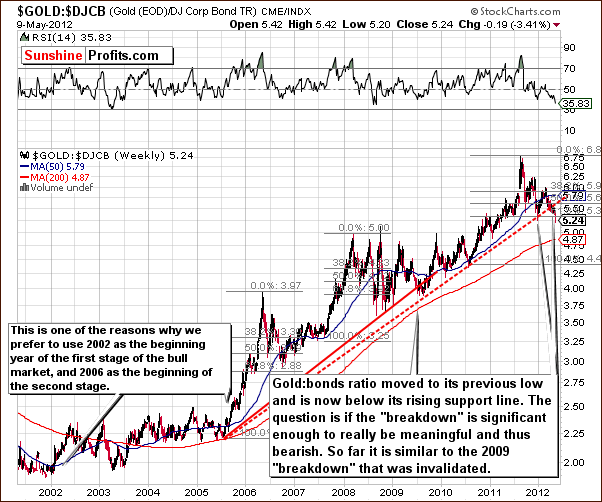
In the gold to bonds ratio chart, we may be quite alarmed at first site as a breakdown is seen. A similar small breakdown in 2009 however was followed by a sharp rally. A similar move below the support line does not necessary mean that bigger declines are yet to come. The situation is now mixed, that is, no longer bullish.
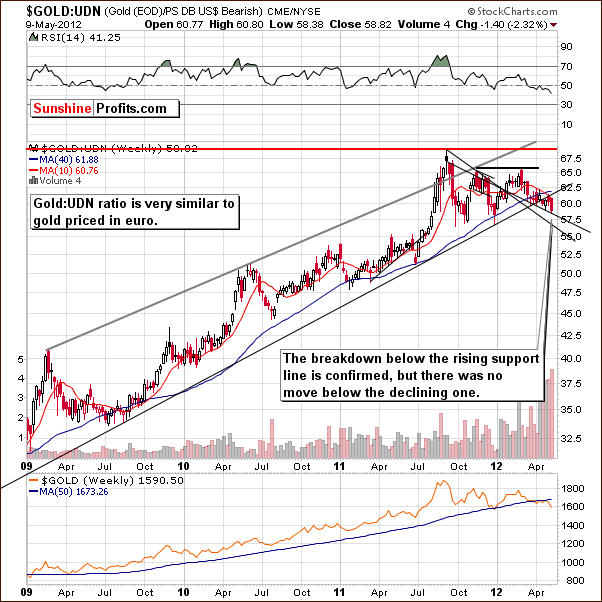
In this week’s chart of gold from a non-USD perspective, the situation is mixed here as well. Prices are below the rising support line but above the declining support line. In short, there are very few changes here this week, and the situation remains mixed.
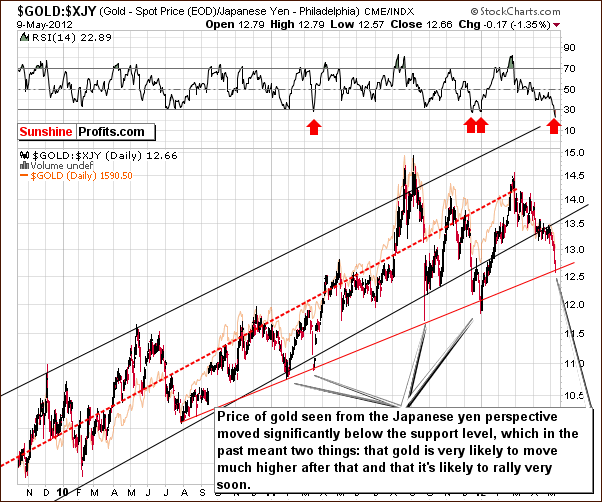
Once again, we have included a look at gold from the Japanese yen perspective, and this week we see a profound move in gold prices. Right now the significant sharp move below the black support line was seen. Contrary to what one might immediately think, this is not really a bearish sign. In the past, similar moves or “breakdowns” have been followed by immediate reversals which ignited a rally in gold’s price – also from a dollar perspective.
RSI levels here are extremely low suggesting an extremely oversold situation in gold. These levels haven’t been seen in years. Such a situation is a very bullish indication, and a look at the rising red line in our chart shows the decline is somewhat in tune with previous breakdowns. So, despite the “breakdown”, the above chart is actually bullish.
Summing up, the situation in gold is critical right now. Gold’s price has moved below $1,600 but the breakdown has not been confirmed. It has not really moved below the key support line either. We also have a buy signal from the gold-in-yen chart – that’s the same chart that made us suggest caution in late February, 2012. Consequently, a major rally appears more likely than significant declines.
Silver
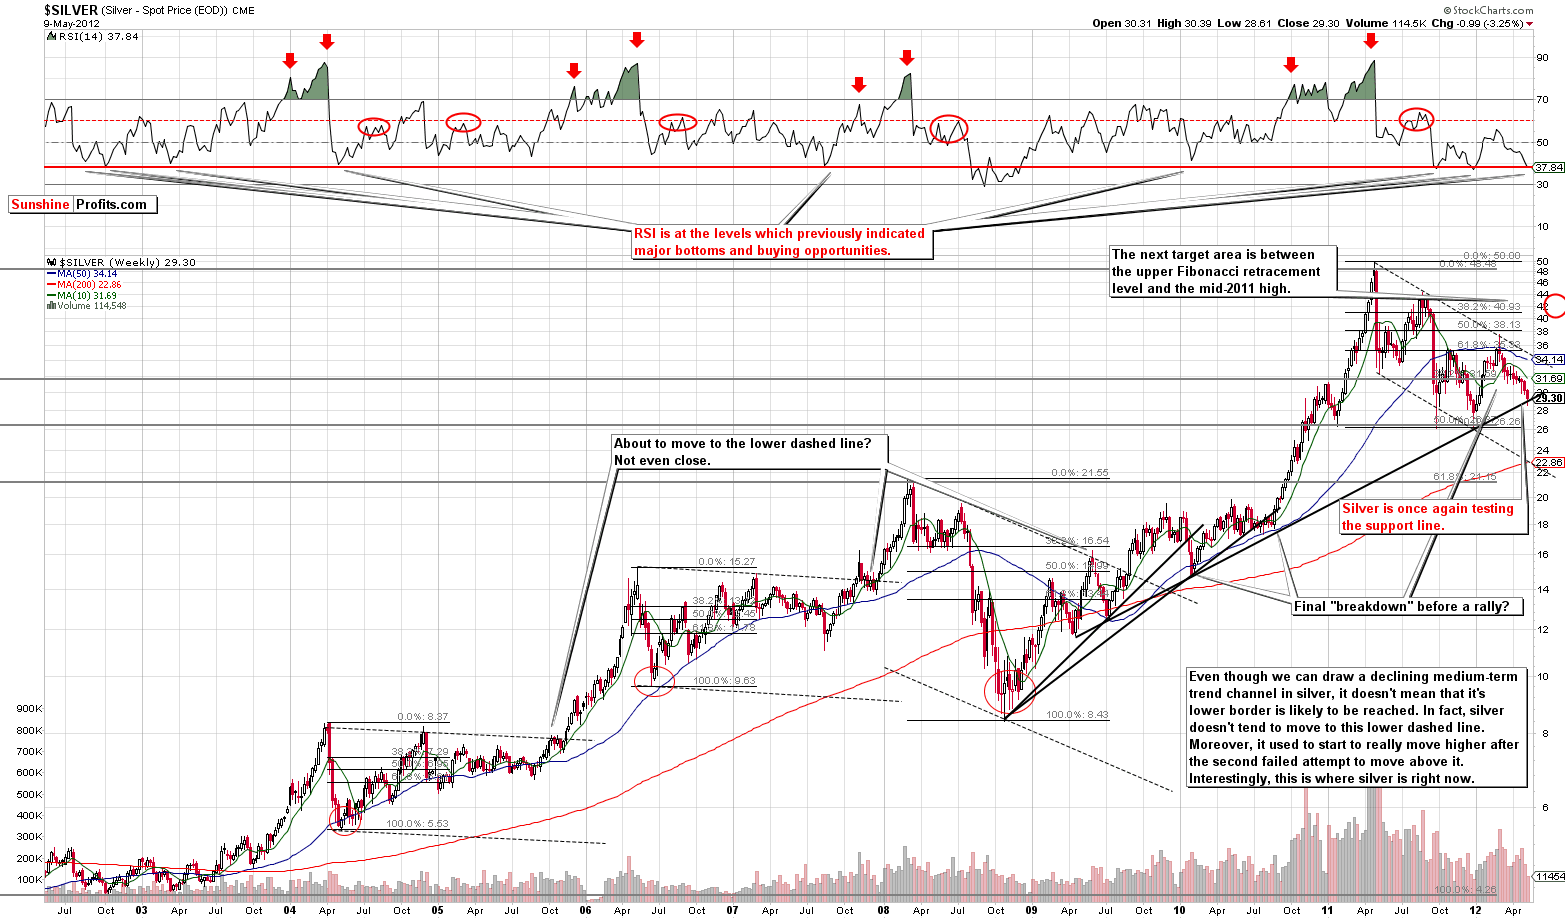
We begin this week’s silver section with a look at silver’s long-term chart (please click the above chart to enlarge). The RSI levels are at their lowest levels since the 2008 plunge. This similar oversold in the RSI makes the situation very much in tune with previous major bottoms. It may be wise to consider this as a factor in support of long positions as opposed to short positions today.
The support line held this week and this line has been adjusted to include the major 2011 bottom. We did this because it seems more important than the late 2010 one. Silver tested this new support line but did not break it.
We now turn to silver’s medium-term chart. The RSI levels are extremely oversold and suggest that the bottom is in or that we are at least close to bottom territory. It seems that it is time for silver to bottom based on this factor alone.
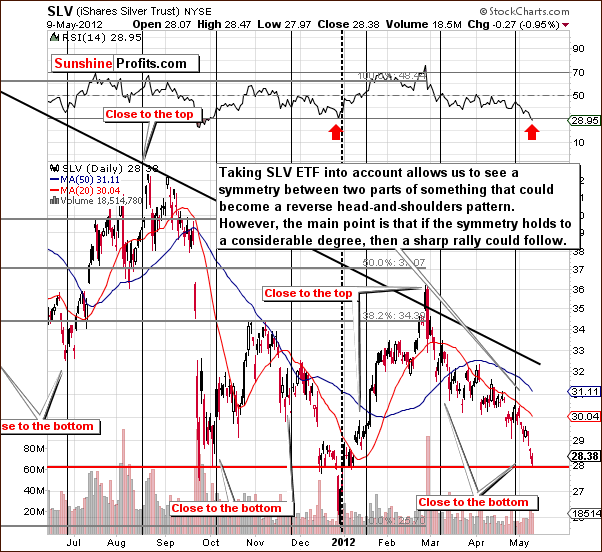
The SLV ETF is now close to where it was in late September 2011. The pattern is somewhat symmetrical and the vertical dotted line has been placed in the chart to show this. If the symmetry continues, the beginning of a sharp rally is possible here. There are no guarantees of course and historically silver’s price declines are usually sharper than its rallies. The situation could turn around quickly and a sharp rally could be seen especially since investor sentiment is very bad right now.
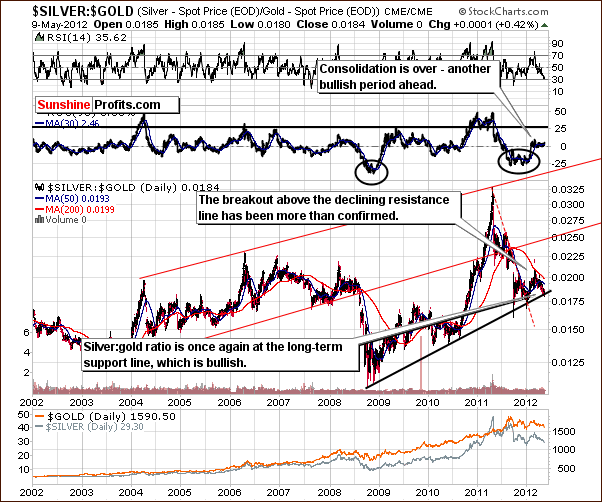
In the silver:gold chart, we see that the ratio is now at a major support line. In short, this suggests that a major bottom is in for the whole precious metals sector.
Summing up, the situation in silver appears bullish. This is based upon analysis of price patterns (also relative to gold), cyclical tendencies and RSI levels, the latter of which has been quite reliable in the past.
Gold Mining Stocks
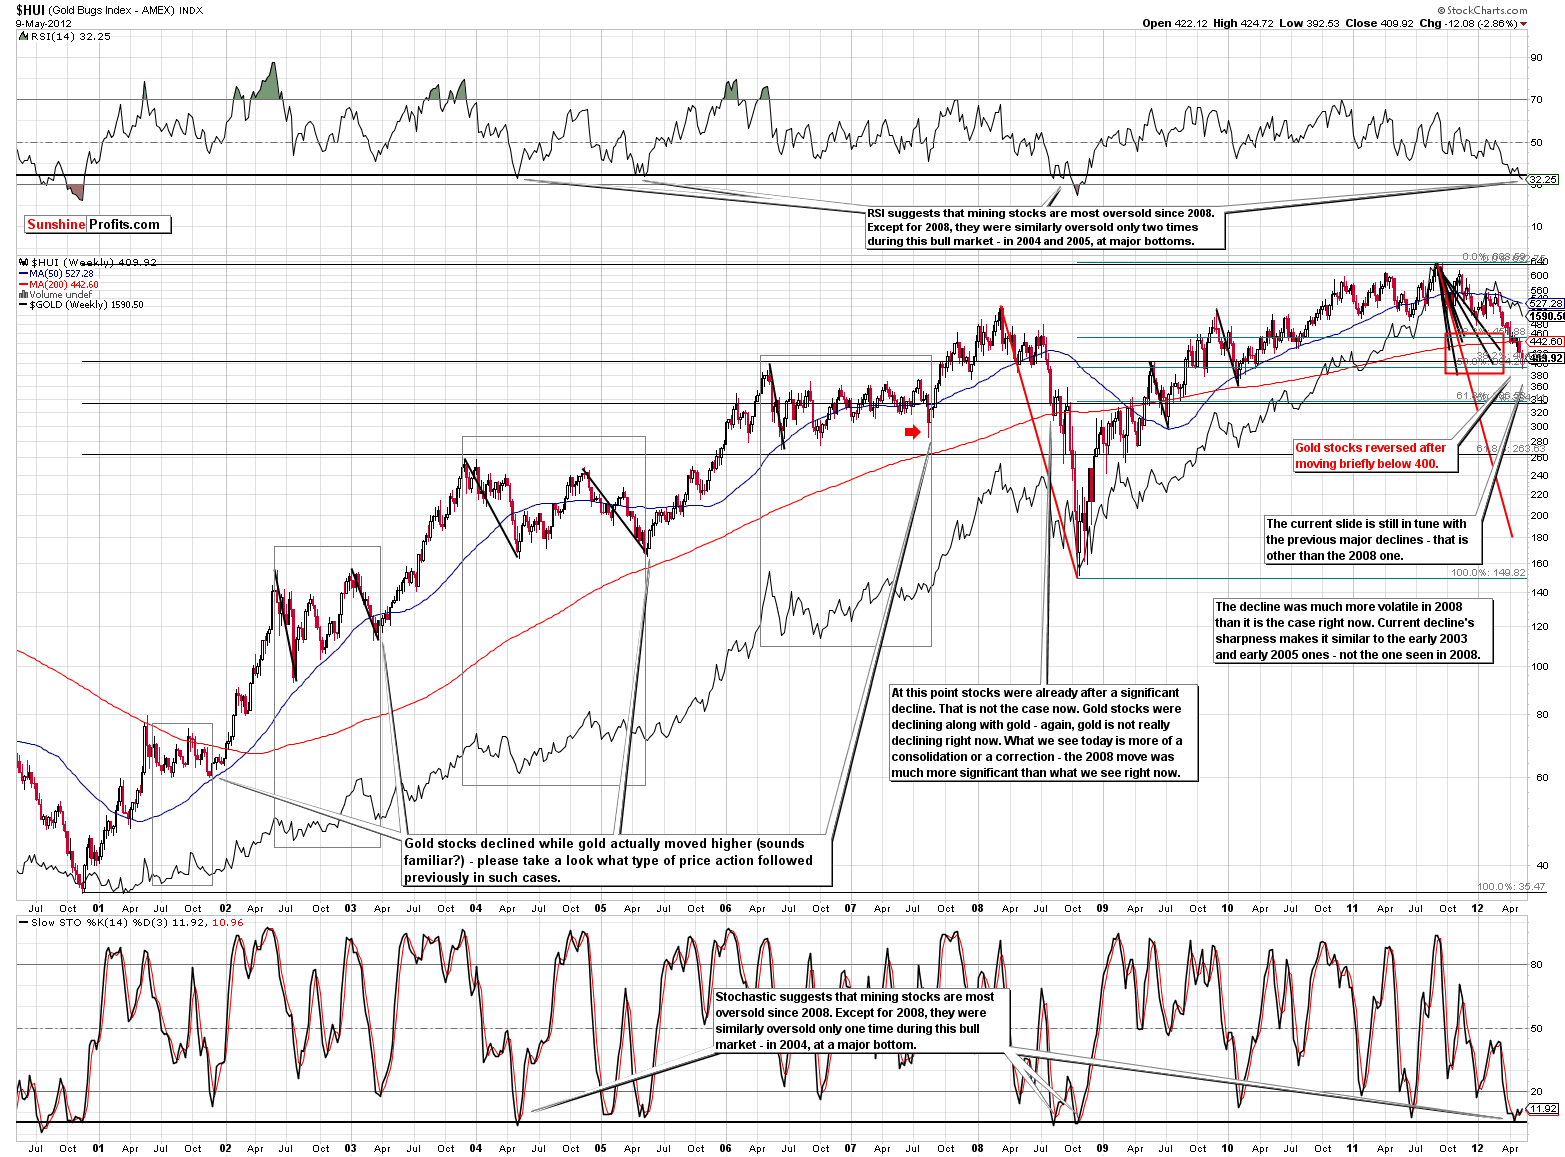
In this week’s long-term HUI Index chart (please click the above chart to enlarge), we see an important change in RSI levels. The situation is the most oversold since the beginning of the bull market excluding the 2008 plunge. In terms of price and shape, recent patterns are still in tune with previous corrections.
The situation is critical right now but in tune with previous declines/corrections with the exception of the 2008 plunge. The stochastic indicator also confirms this. The bottom coming in at a level below 400 is probably quite discouraging for the gold bulls as that is the level where the index topped six years ago. The sentiment today is quite the opposite of what it was then, however, so the upside potential seems to be much greater now.
Finally, our “run for the hills” 395 level in the HUI Index was reached only briefly, as this move was followed by a quick turnaround and a move to the upside back to around 410. This is not a confirmation of a breakdown, but invalidation thereof, which can be viewed as a bullish signal.
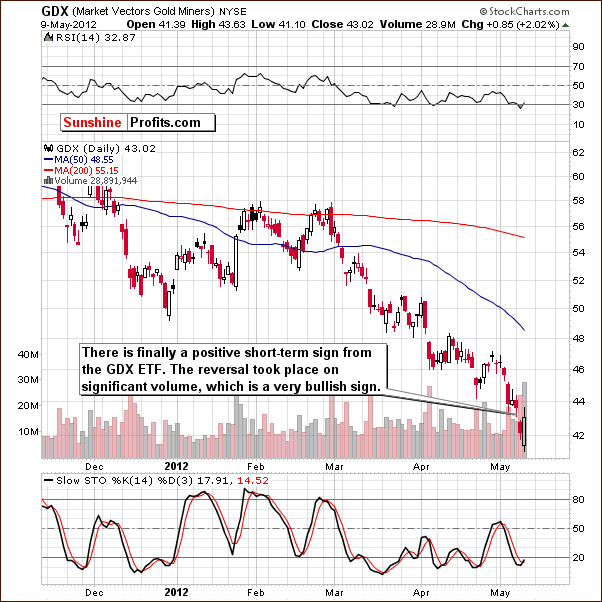
This week’s short-term GDX ETF chart provides us (finally) with some strong bullish implications. An intra-day reversal was seen this week on significant volume, and this is clearly a bullish sign. The strength of this signal is even greater when considered with the extremely oversold situation in the precious metals sector, most notably in the mining stocks.
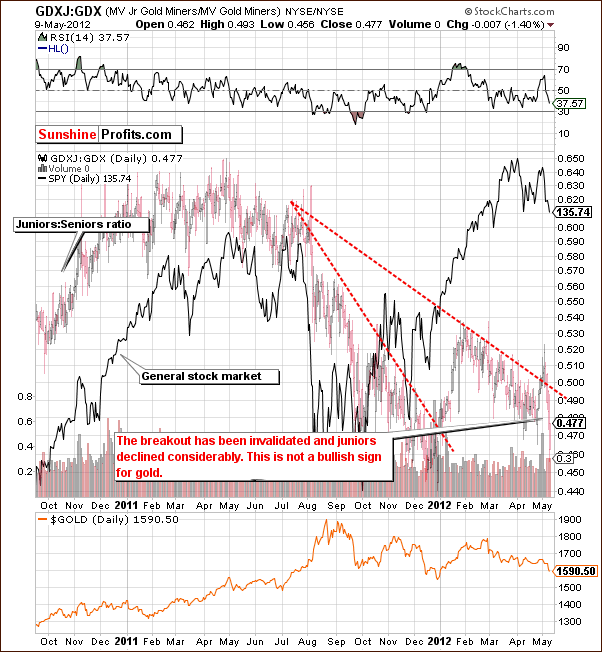
In the juniors:seniors ratio chart, the signals are not too bullish. The recent breakout has been invalidated and the move very sharp. A rally in the general stock market would likely result in a rally here as well, however, and a breakout back above the declining resistance line could be seen.
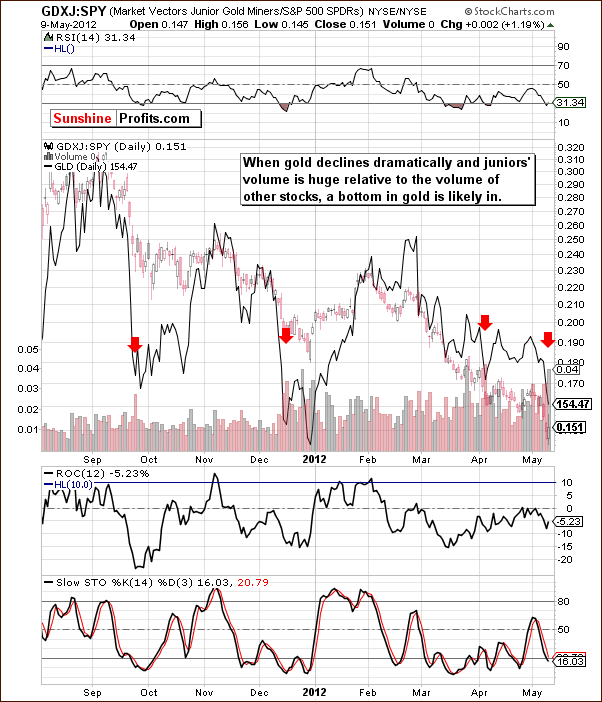
In the juniors:other stocks ratio, comparable volume levels normally are interpreted as a strong, medium-term buy signal. This was seen in the beginning of April (when gold formed a bottom) and we have a similar situation again. Such a signal emerged in Wednesday’s closing prices and volume levels. When the ratio of the GDXJ volume with the volume of the SPY ETF is high at the same time that gold prices are declining, a major bottom is likely in. This has been seen in the past and is likely confirming a bottom once again today.
Summing up, the small breakdown below our “run for the hills” 395 HUI value was quickly invalidated. This is a bullish sign and the accompanying high volume was bullish as well. The GDXJ:SPY ratio confirms this bullish situation and even though we realize that this may sound odd after such a significant decline, the short-term outlook appears to be quite favorable.
Sunshine Profits Indicators
Two our in-house developed indicators flashed extreme signals based on Wednesday’s closing prices. They have been very accurate in the previous years, so this is something that we should pay attention to.
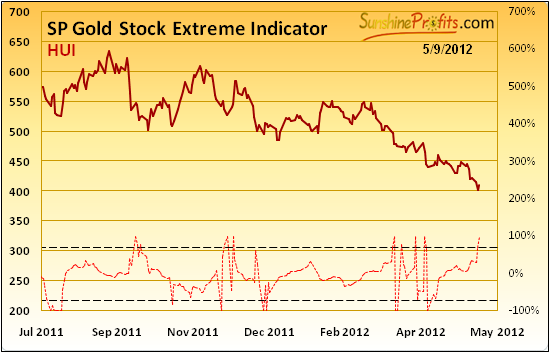
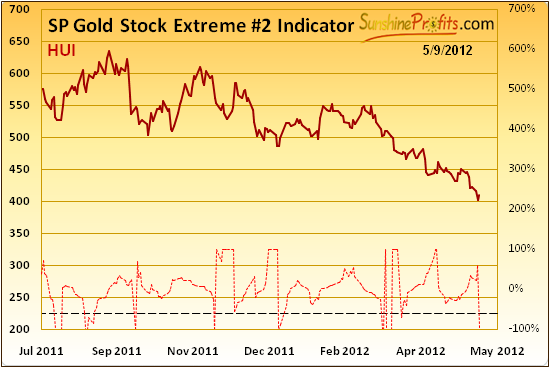
It is true that the last time these two indicators flashed an extreme reading, it resulted in a rather mild rally which turned out to be a consolidation. However this is decline is indeed something quite different from what we’ve seen in previous months, so detecting only a very temporary turn-around should not be viewed as something that invalidates indicators’ usefulness, especially when we compare it with number of previous times when these indicators were right spot on.
As a reminder, an “extreme signal” (usually marking a bottom) is seen when either of the indicators crosses either of the dashed lines in any direction. In other words, extreme values in the indicator mark extreme values in the precious metals market and it usually means that a bottom is in or at hand.
The bottom line is that since these two indicators flashed an ”extreme signal” and without a doubt, the preceding move was down, a rally in the precious metals sector becomes very likely.
Letters from Subscribers
Q: I was just on Kitco and the funniest thing ever was an article with the headline “Why Gold Stocks Suck.” Funny but true. Just goes to show the extreme hatred of the sector...
http://www.kitco.com/ind/fulp/20120503.html
A: Yes, this is another confirmation that the sentiment for the sector is extremely negative. No wonder - their performance has been awful recently.
The abovementioned essay makes the following bearish point regarding market timing:
We are coming into May when selling is normally expected to pickup, and that will be followed by the dog-day doldrums of July and August. The economic outlook in Europe is no better, China continues to slow its economy, the US Fed, partisan policymakers, and politicos will do nothing of import before the November elections, the price of oil remains high, and metals prices are stagnant. Markets are skittish and subject to a whim within an undercurrent of trepidation. None of the above factors will inspire the confidence of risk capital in the short term.
Our take regarding the seasonal patterns is that they haven’t worked very well in the past few months overall, so betting on a market based on their signals doesn't seem justified. Yes, a decline in the precious metals sector is usually seen before mid-June, but that is the case after a substantial rally. Obviously the rally has not been seen so far, so there might not be the corrective decline either. The summer was quite "hot" in 2011, which is against the seasonal tendencies - yet metals rallied. The seasonals are a useful tool (especially when combined with the effect of derivatives’ expiration dates), but not at all times. This appears to be one of those times when they don't work very well (at least not now).
The economic outlook in Europe, China's growing (!) economy, etc., are fundamental factors and stock prices are leading (!) economic indicators. This means that prices are likely to recover before we see a positive change in the economic statistics. That's why using technical analysis supplements fundamental analysis.
Q: This action in gold is absolutely pathetic. Never been more frustrated in my entire life. If we end up in another panic sell off, I will probably quit trading permanently. I feel like I have less and less of an edge in the market as technical tools seem to lose effectiveness as the financial system gets more twisted with intervention.
A: Actually, we received this message before the last part of the decline (if we have seen the last of it that is). We hope that the trading did not end, because if this is indeed a major bottom, then the potential comeback for precious metals is huge.
The overall sentiment has definitely hit rock bottom or is very close to doing so and the tone of this message proves it. It is at these moments where one should actually be brave. It's tough, it's hard, but it's usually also lucrative.
"Does technical analysis work anymore" is one of those "boomerang questions" that comes back every now and then. In the June 17th, 2011 Premium Update, we thoroughly answered the question and here’s one of the most important paragraphs:
Well, the most important fundamental that does not change over time is human psychology and emotionality of individual investors. This is something by far more stable that one, two, or even three quantitative easings are not able to change. Will China's growth cause people to stop being greedy when they see higher prices and fearful when they see them decline? Will Europe's problems cause people to act by means of cold logic only? Definitely not. Moreover, even if TA will someday cease to be useful it is highly improbable that it will happen quickly. Certainly, it will not be a matter of weeks, months or years because TA's foundations are based on real mechanisms, which are an inherent part of each human being.
Q: It seems the bottom for silver is here - do you agree? If so, from a safety point of view, how far out should I buy SLV call options, expiry Oct to Dec 2012 or 2013?
A: Yes, a bottom in silver appears to be in or very close to being in. If you are willing to bet on silver's comeback then we would prefer a small position in the Oct 2012 options to the other option types that you mentioned. The reason is that if the rally does indeed take place, then it is likely to start soon. However if it doesn't and silver continues to move lower in a more or less sharp manner, then you will have a chance to buy another set of options when the situation is once again very bullish/favorable (for instance when our extreme indicators flash a signal again).
Q: I do not like day trading. But perhaps you should consider more frequent alerts in future situations where local tops are clear. The ride back up will certainly not be straight up, and it may be worth the risk to trade in and out a bit during the next couple of months in an attempt to capture some additional gain. I realize this idea carries its own risk, but perhaps there will be times where these local tops are clear enough that some of us will want to take that risk.
A: Naturally, we will provide our comments about future short-term moves and we will provide updates as often as needed (like this week). However, we strongly advise against trading more or taking bigger positions just because one lost some capital. It is ok to make bigger bets if the probability of an asset moving higher becomes bigger or the risk associated with the trade is smaller, but it is not justified based on one's "willingness" to make quick profits. Such myopic loss aversion leads to taking excessively risky positions and to losing capital.
Actually, detecting and mitigating the risk of risking too much and overtrading due to the loss aversion is something that your Editor will be tested for on the upcoming CFA level 3 exam (the final one) in a few weeks. The thing that is suggested for dealing with “loss aversion” phenomenon is making sure that one conducts a really thorough analysis and then pays specific attention to not let the current / past position influence their market expectations.
Regarding alerts – we generally send them when something that we wrote previously (in the previous alert/update) needs to be… updated. If you believe that we should issue an alert for whatever reason, please send us a note – we generally send alerts also if we receive a few requests even if we personally don’t think that it is really necessary.
Q: I do think you need to give more thought to how you calculate your percentages.
A: We do not calculate them at all. It's our subjective guesstimate based on all details that we have observed in the market and on our experience.
Q: I also think there needs to be more emphasis (clarity) on what those percentages really mean. For example, you are currently seeing a 30% chance that gold will be dropping instead of rallying. At first blush, that 70% chance looks good, but if the 30 plays out - as it has a lot recently - the next stop for gold is what? 1525? Coupled with the losses so far, this would be utter devastation - close enough to 2008 to me, anyway.
A: Just to be clear, when we say that "we currently view the probability of an upswing in gold (instead of a confirmed move below $1,600) at 70%" we mean exactly that - nothing more and nothing less. So far gold hasn’t confirmed the move below $1,600. We made no projections as to what might happen if gold does confirm the move below $1,600 - that was too unclear at the point when we wrote that. Technically, we could provide our thoughts in the form of a distribution with expected value and standard deviation, or more appropriately, a non-normal distribution with other parameters, but that would make things less clear in our view for most readers, not the other way around. If you (or anyone else) have an idea on how we should provide our probability/ price targets so that they are both exhaustive and easy-to-understand, then we would love to hear from you.
Q: At this point, please be very careful not to let us stay long for the sake of hanging in. I get the feeling that we are unnecessarily riding things down. The fact is, the indicators, tech analysis, charts, etc. have all been saying the same thing - and have all been wrong since GDX was at 52 - quite a while ago. So why are we still following them?
A: You're right - it's very important for us not to become victims of the conservatism bias ("my mind is made up, don't confuse me with evidence"). As we mentioned in yesterday's message, we keep in mind our previous "run for the hills price levels" comments and we are ready to change our approach if breakdowns below these levels are confirmed. On a side note, there is a simple psychological exercise to overcome one's aversion to changing their position in the market just because they "want" their original forecast to become true. That is to think of the next move as temporary just to reenter one's original position at a more favorable price. By "framing" the decision in this way, it is easier to make if the evidence supports it. Please feel free to let us know if you think that we fail to act according to this principle.
We already replied to a question about reliability of the technical analysis so we will just supplement it with a comparison. Indicators etc. are not like a broken car that won’t fix itself when it fails to work one time. It’s more like a smart student who didn’t do well on one of the tests – if he’s smart, he’s still likely to perform well on other tests regardless of the temporary situation. Of course, it’s a very huge approximation of how technical tools work, but the point is that the psychological mechanisms behind them are: a) mostly – but not always – correct and b) not going to disappear anytime soon.
Q: I am finding your advice pretty much useless as you keep changing your opinion of the markets. Last week you stated that you expected gold to start a rally as it had bottomed. Now you are looking at closing your long positions. Actually, your potential bearishness might be an early signal that the markets will turn around.
A: Actually, this is not a question, but we decided to post it to contrast it with the comment warning us not to stick to our previous forecast just for the sake of sticking to it. Unfortunately, it's not an easy task to balance everyone's needs. In any case, we will continue providing you with our thoughts on the market and you will be kept up-to-date at all times. You will receive a message as soon as we change our mind on a given PM-related topic and it is urgent that you know about it (or we receive a few requests to provide an update).
On a side note, our “potential bearishness” might indeed be a sign of a bottom. The fact against it is that the reason for sending out the alert might have not been emotional as we were obliged to provide the update regarding the $1,600 and 395 levels as this is something that we previously commented on and promised to keep you up to date.
Q: I just read that the large head and shoulders pattern that has formed on the CDNX is an ominous warning that gold stocks are about to collapse. What are your thought on that?
A: If the article that you read mentioned the H&S pattern based on the mid-2010 and late-2011 bottoms in the CDNX (S&P/TSX Venture Composite Index) then we would need to see a confirmed breakdown below 1,280 before this pattern would be completed. At this point the index is close to 1,350. So no breakdown has been seen and thus no completed H&S pattern is in place. We agree that it could form, but it's simply not the case yet.
Q: It's all a waste of time. The Fed still exists, JP Morgan still exists. What's likely to change that? Ron Paul is out. Metals are done along with the dollar and the Constitution. Sell your gold, silver and dollars and use the proceeds to purchase vacuum packed food, jarred water, guns, ammo, and a bunker. Those items may buy you a little time unless you'd simply prefer to just die sooner. In that case no action is necessary.
People like Mike Maloney and Max Kaiser are bearish on gold and silver by stating gold should be at $15,000.00/ounce. That's a no-brainer. Gold should probably be at $40,000.00/ounce but it's going nowhere as long as JP Morgan-Chase and the Fed dominate.
It would take an insurrection to remove them. Americans are far too complacent. They don't have the courage of the Libyans. They're watching the Kardashians on TV. Gold and silver will periodically have their little explosive breakouts, then be collapsed again by the naked shorting of the banksters. I mean bankers. Nothing will stop this pattern.
I laugh when I hear people talk about Buffet and Bill Gates being the richest guys. The $50 or $60 billion they each have in their second rate companies is chump change. It's pocket money to swing by Dunkin' Donuts for an Iced Coffee. The real money is with people like the Rothschild heirs. Conservatively we're looking at over $100 TRILLION and perhaps much, much more. Perhaps in excess of one quadrillion.
Bill Gates and Buffett qualify for food stamps. The true wealth – not chumps like Buffett and Gates – will NEVER permit gold and silver to reach even one tenth of one percent of their true value. Give this nonsense up already. (…)
A: The Fed and JP Morgan exist, but they also existed in 2001 when gold started its massive multiyear rally. Since it didn't stop gold's price from rising over 5 times, it may not stop the price of gold or silver from rallying much more. Since gold is likely to move much higher in the long run then owning it sounds like a prudent thing to do in our view. Of course that's just our opinion and we're perfectly fine with whatever approach one will take.
Q: Do you expect the new Chinese futures platform to change the direction of silver?
A: It could be one of the factors contributing to higher precious metals prices as more people will be able to trade and invest in them.
Q: (…) I just don't see how the dollar cannot go sky high from here with the Eurozone heading for accelerated collapse. At some point I have to admit I've been wrong about the PM sector (Warren Buffet appears to have been right again). Logically gold was the place to be. In reality, the "powers that be" have proven more than capable at squashing it. Also, market realities have proven the dollar to be the only "safe haven" the world recognizes. At this point I don't see how any bullish pattern can stand up to an impending Eurozone collapse. Not sure where this leaves us. I guess I have to rethink all this.
A: Technicals, charts, and positions aside, if all hell breaks loose in Europe, is gold really likely to plunge? True, unexpected (!) negative events in Europe would be negative for the euro and therefore bullish for the USD Index, but they could be bullish for gold as well. Please remember that gold is moving higher also in terms of euro at least from the long-term point of view. On gold vs. Warren Buffet - please keep in mind that gold is still more than 5x more expensive than it was 10 years ago. Stocks are now less than 50% higher. Also, please keep in mind that gold is now more than twice as expensive when compared to the 2008 bottom even despite the recent move lower.
Q: I feel there should be some sort of feedback for subscribers here. The 300 day MA is clearly broken to the downside.
A: The breakdown below the 300-day moving average has not been confirmed so far. The only time a similar breakdown resulted in further declines was in 2008. What's noteworthy is that in 2008 gold still bounced back to the 300-day moving average and stayed close to it for about two weeks before the decline continued (with an analogous situation, we would still get a better exit point in several days than what we have today). The other times that the 300-day moving average was broken were all followed by an invalidation of the breakdown and a significant rally: April 2003, May 2004, July 2004, Feb 2005, May 2005, July 2005, April 2009, and December 2011.
Q: It looks like there were a ton of sell stops below the previous low and they would need to be overcome now for the bulls to take control. Right now it appears that the bears are in control. Any opinions on where we need to hold, previous low 1550? Thank you.
A: Yes, it certainly looked like there were many stop loss orders just below $1,600. However, the market still managed to move higher soon after that, and the fact that it has recovered is quite remarkable.
Summary
The situation in the precious metals markets is extremely tense today. The USD Index move to the upside this week has been a key factor in the declines seen in precious metals prices. The move above the declining resistance line has not yet been confirmed for the USD Index, however, so the implications going forward for precious metals are not yet bearish.
The same can be said about gold’s price move below the $1,600 level, a move that also has not yet been confirmed. The outlook for the general stock market is a bit more bullish than not at this time and verification of this recent gold price breakdown appears unlikely. The technical picture for the yellow metal still seems favorable even though the recent decline has been quite volatile. The major support line in gold was hit just like it was the case 3 times in the previous months and we expect to see a quick reversal also this time. These comments also hold true for silver.
The situation in the mining stocks is the most critical of all. A bullish short-term picture has emerged, however, based upon strength shown on Wednesday when gold, silver, and the general stock market declined while the miners moved higher (GDX ETF) or at least showed an intra-day turnaround which erased a good portion of the early day losses (HUI Index). Analysis of key ratios also provides favorable signs for the precious metals sector overall. On top of that we have just seen two extreme signals from our own indicators, which are likely a strong buy signals – please keep in mind that on average these indicators were very reliable in the past years.
Consequently, we do not feel it is a good idea at this time to get out of the bullish camp. The recent bearish technical events in the USD Index and the gold market have not been confirmed and several bullish factors have just emerged as well.
The target levels stated in recent weeks are unchanged. They remain as follows: slightly above $1,900 for spot gold, $40 to $45 for spot silver, 540 for the HUI Index, and $53 for the GDX ETF. The probabilities for reaching these levels are estimated to be about 70%. We believe that the rally to these levels will take approximately 2 months from the day we have a confirmation that it has started. We expect to see this confirmation this or next week.
This completes this week’s Premium Update. Our next Premium Update is scheduled for Friday, May 18, 2012.
Thank you for using the Premium Service.
Przemyslaw Radomski

