
The Hindu festival of Akshaya Tritivai is coming up this month and this is of interest for gold investors. The holiday, which falls on April 24th, is a day when Indians go on a major gold buying binge. It is one of the most auspicious occasions to buy gold, the ultimate symbol of wealth and prosperity. The timing couldn’t be better for the ending this week of the 20-day strike by India’s jewelers and gold importers who protested new government taxes on bullion. Moreover, the wedding season has already started in some parts of India and gold is an integral part of most Indian weddings. It is expected that in April and May imports will be around a 100 metric tons to India, the world’s largest consumer of gold. The nationwide strike is estimated to have cost the industry at least $3.91 billion.
Physical Gold Demand Strong: GFMS
According to an annual report released Wednesday by metals consultancy GFMS, gold’s speculative investors may have been shaken by gold’s volatile ride last year, but the physical market—particularly in China—remained faithful to bullion and the trend is expected to continue in 2012.
Gold bar demand and hoarding from China alone rose 40% in year- on-year in 2011 to a new record of 250 tons, according to GFMS. And this trend is likely to continue.
Demand for physical gold in the form of coins and bars grew in 2011, while Chinese appetite for gold jewelry expanded to record levels. This contrasted with a 10% drop in overall world gold investment by tonnage, amid heavy redemptions in the over-the-counter and gold futures markets as investors cashed in their gold positions amid heavy losses in other financial markets.
While investment demand dipped, 2011 was a “bumper year for physical investment,” according to a GFMS metals analyst. “Gold was clearly dependent on emerging markets’ economic strength as China’s jewelry demand grew to a record level, while India’s fell by less than 3%.”
Physical gold bar investment surged 37% last year to a new record of 1,209 tons, according to GFMS. This was driven by strong demand for physical gold as a store of value in China and India as well as “safe haven” interest from western investors, the report said.
Global gold coin fabrication rose 15.2% to 245.5, spurred mainly by strong demand in Turkey and China, said GFMS. Rising concern over inflation and the rapid hike in disposable incomes in places like China is also driving demand for physical gold, said GFMS.
How Are PMs and Stocks Correlated?
Tuesday marked the worst day of the year for U.S. markets. Stocks fell amid anxiety ahead of earnings season and rising bond yields for Spain and Italy, along with sharp losses for those markets.
The Dow Jones Industrial Averageclosed down 213.66 points, or 1.7%, resulting in a five-session losing streak. That’s the longest such run of losses since August. It was also the biggest one-day point and percentage drop for the index since Nov. 23. But Wednesday, U.S. stocks rose sharply after an extended losing run as Spanish and Italian bond yields fell.
How do these sometime seismic movements in the stock markets affect the precious metals markets? You are most likely familiar with our correlation analysis as we provide it on a weekly basis, but we thought that it will not hurt to go through the basics once again, especially that this topic seems to be popular right now (and we’ve been recently asked to give an interview on it).
The relationship between gold and stocks is quite complex. It's positive, negative, and even neutral - all at the same time - depending on the perspective one takes.
If you look at yearly gold and Dow charts separately it seems at first glance that they are aligned. Both moved up since April 2011 and both markets experienced painful corrections.However, taking a closer look (by plotting their prices on the same chart, for example) shows that there were times when gold and Dow moved in opposite directions. For instance, gold rallied strongly from July 2011 to late August 2011 while at the same time stocks declined significantly. A few months later - during the first 3 weeks of October - the Dow soared without analogous action in gold. We've also seen a decline in gold in December 2011 and stocks actually were higher at the end of December 2011 than they were at month's beginning.
Also, in the past few days (second week of April) we saw gold moving higher along with lower stock prices.
If we take the entire previous year into account (the past 250 trading days), we see a moderately negative correlation between gold and S&P 500 (below -0.3), which means that these two asset classes moved on average in the opposite direction during this time frame.
In short, there are periods when gold moves along with stocks and there are periods when gold and stocks move in the opposite directions. It seems that the period in which gold moves along with stocks has ended. Gold declined along with stocks during the first week of April, however taking the previous 30 trading days into account, these two still moved, on average, in opposite directions. That's why on April 6th, 2012 we told you thatnegative coefficients (…) suggest that declines in the general stock market will not necessarily be bearish for the precious metals sector.
Markets are not logical in the short term, but emotional. Fear and greed are the main drivers behind prices of virtually any liquid asset in the short term, including gold and stocks.
In any given day there are statistics, government reports, speeches by Fed Chairman Ben Bernanke and other "breaking" news that move markets depending on investor sentiment (i.e. emotional status.) Investors decide to focus on the positive or the negative “news.” Usually some traders make their move, others follow and thus a short-term trend is created. It terms of correlations between gold and stocks we see that as changes from positive to negative values and vice-versa. At one time markets focus on gold as a hedge against falling stock prices and the two move in opposite directions. At other times, stocks move in tandem with gold as both are driven by lower interest rates, which means that companies can obtain cheaper financing which increases their profits and gold moves higher as protection against inflation which is caused by low rates (which translates into higher money supply). We believe that we will continue to see short-term see-saw periods of positive and negative correlations between stocks and gold.
In the long run, however, gold moves independently from the stock market, driven by its supply and demand characteristics.
Although the Hindu festival of Akshaya Tritivai is still 11 days away, let’s see if it will indeed be auspicious to buy gold during this period. Let’s turn to this week's technical part. We will start with analysis of the US Dollar Index (charts courtesy by http://stockcharts.com.)
USD Index
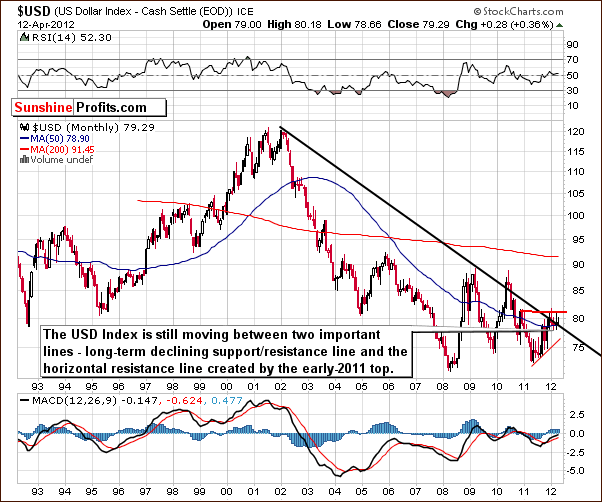
Our first chart this week is the very long-term USD Index chart. Since virtually nothing changed this week, we have decided to quote from last week’s Premium Update:
We see that the sideways trading patterns continue between the two levels which are quite important from a technical perspective. These are the declining long-term support line and the horizontal support line based on the early 2011 high. At this point, the very-long term chart remains mixed as the USD Index moved a bit higher once again this week, but no breakout has been confirmed thus far.
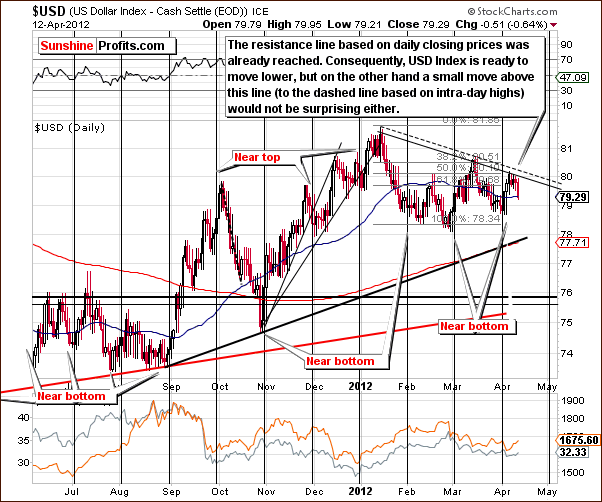
In the short-term USD Index chart, we did not see a move to the higher resistance level this week as the index was stopped by the lower resistance line. This lower line was created by daily closing prices and was strong enough to keep the rally in check. It seems that declines are likely from here, and the precious metals sector has been reacting quite positively to this bearish outlook.
Summing up, the short-term and long-term picture appear a bit more bearish than not and the implications for the precious metals are generally positive.
General Stock Market
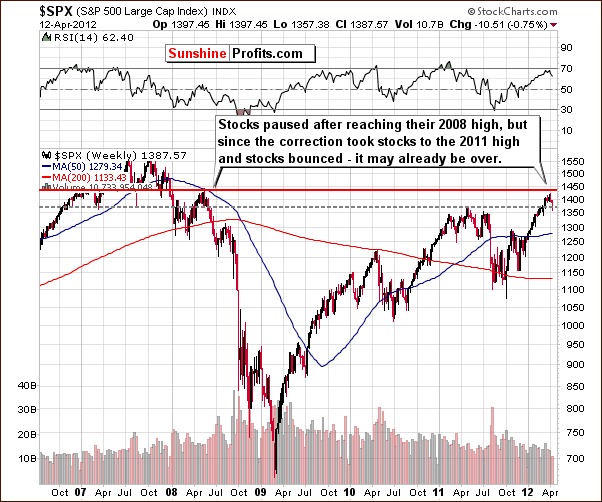
In the long-term S&P 500 Index chart, we have seen the expected pause following the index reaching the level of its 2008 high on April 2. The S&P has corrected but did not go all the way to the $1,320 level (red line seen on the chart below), more or less reaching the 2011 highs slightly below $1,360 and then bouncing. The breakout above these previous highs has been verified. Based on this chart alone, prices appear ready to move higher - the rally does no longer “demand” a correction as it has already happened.
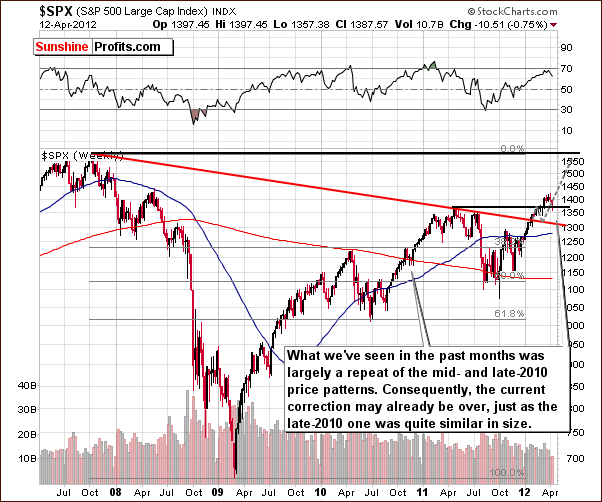
In this slightly different view of the long-term S&P 500 Index chart, we can see a similarity between the trading patterns of mid-2010 and now. Back then, stocks reached a bottom in a similar way and then showed a sustained rally, had a small consolidation around the level of previous highs, and then continued their rally. This pattern could be repeated now and our medium-term target is the level of the 2007 highs close to $1,550.
This is not a sure thing by any means, however, and undoubtedly the situation in the gold market is much clearer. While stocks could move to previous highs, and it does appear likely, a bet on the precious metals is much preferred over one on stocks at this time - the situation is much clearer for precious metals, thus it’s less risky.
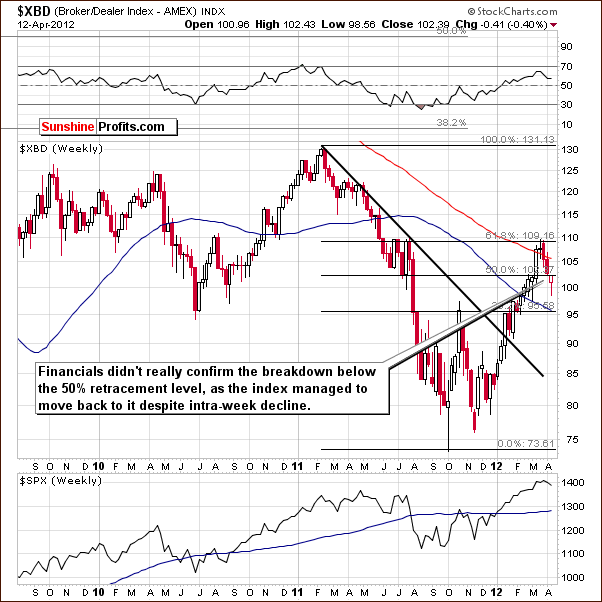
In the Broker-Dealer Index chart (proxy for the financial sector), we have bullish implications once again. The financials moved close to previous local high on an intra-week basis and managed to move back to the 50% Fibonacci retracement level. The situation remains bullish for the financials and consequently for other stocks as well.
Summing up, the outlook for stocks appears to be rather mixed in the short-term with a slight bullish bias and bullish in the medium term, however additional move lower to 1,320 in the S&P 500 would not surprise us either.
Correlation Matrix
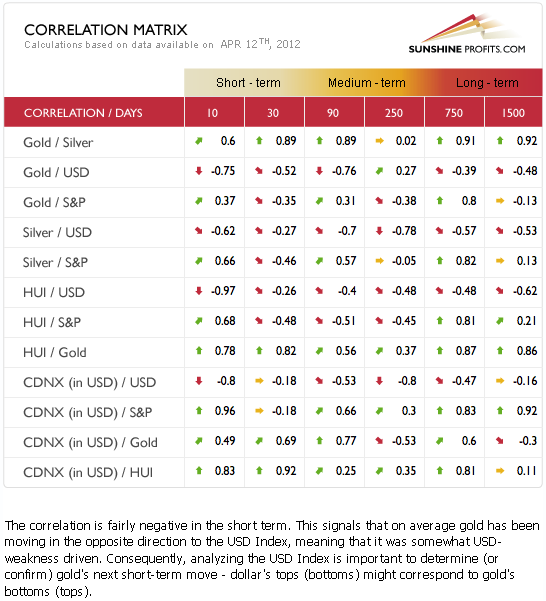
The Correlation Matrix is a tool, which we have developed to analyze the impact of the currency markets and the general stock market upon the precious metals sector. We have described the link between precious metals and stocks earlier in this week’s update, so in this section we will focus on the correlation between the precious metals and the USD Index.
We see moderately significant and negative coefficients for gold and somewhat weaker ones with silver and the mining stocks. The bearish outlook for the USD Index has bullish implications, as usual, for the precious metals. This is not the main factor in play however. The gold, silver and mining stocks charts are clearly more important right now. Investor’s sentiment has been extremely low and markets now appear ready to move higher even without significant influence from the USD Index and the general stock market.
Gold
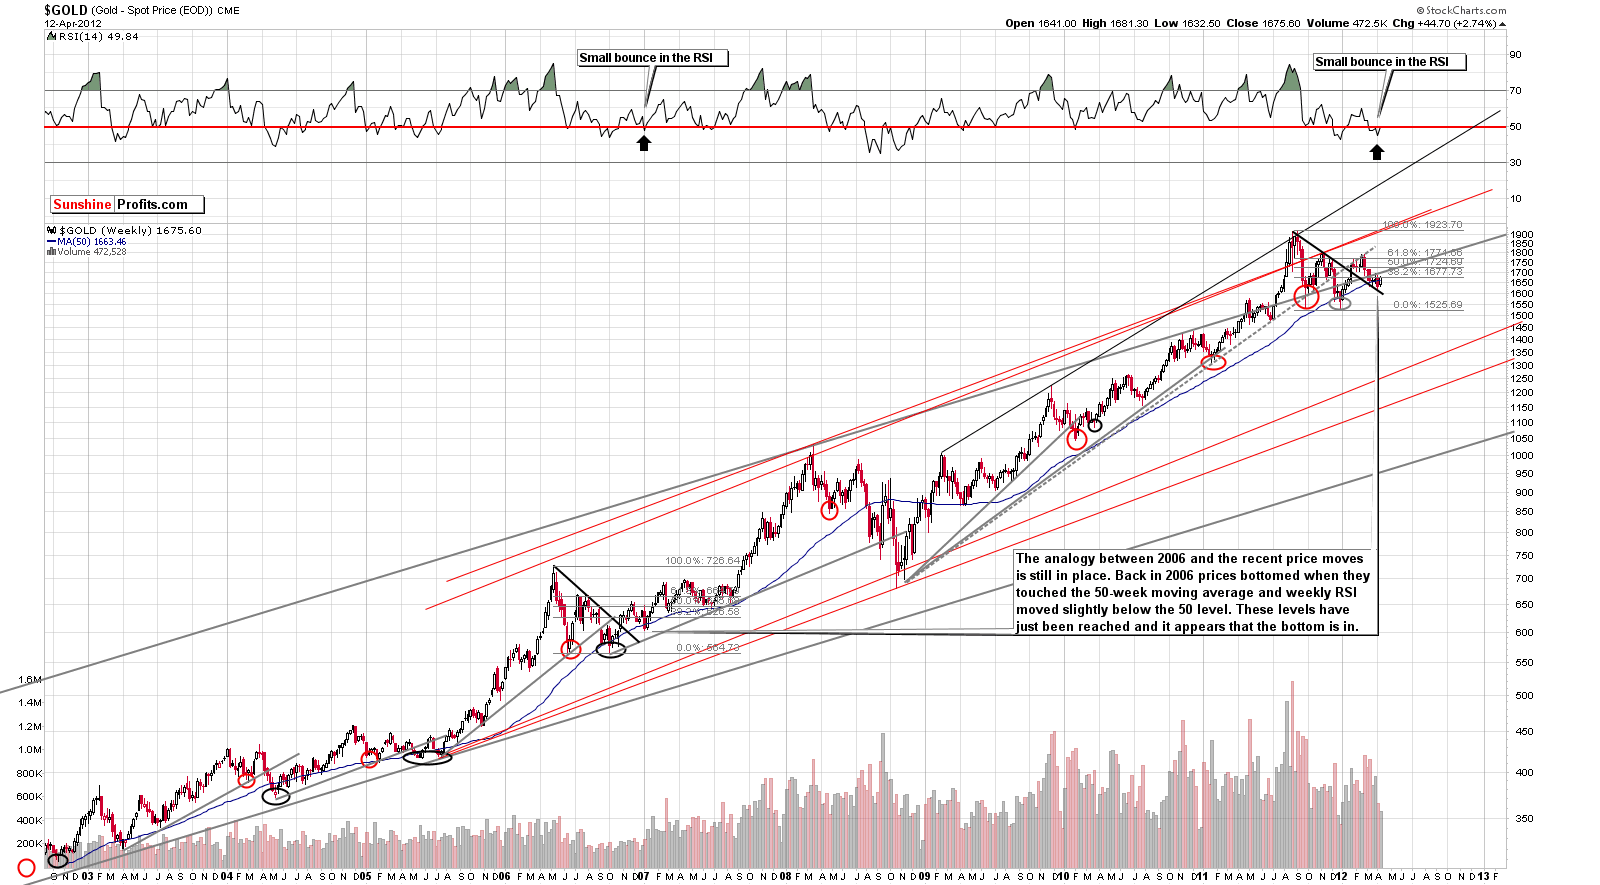
This week we begin our gold section with a look at the very long-term chart (please click the above chart to enlarge). This week, the situation unfolded pretty much as we expected and in line with what we have been reporting over the past few weeks. It seems that the bottom is finally in and a rally is likely beginning. We have one more interesting confirmation this week, but we will move to that a few sections later.
Gold’s price has risen nearly 4% since its intra-day low on April 4. The self-similar pattern (comparing late 2011 and 2012 performance to 2006-2007 one) is still in place, although the shape of this correction has been a bit different.
Gold bottomed below the 50-week moving average back in 2007 and began its strong move to the upside soon after, gaining over 50% in the next nine months. If gold closes above this level this week, it will likely be an indication that the rally has indeed begun. The odds favor this being seen on Friday, as gold closed above this level on Thursday.
Again, the situation continues to unfold in a manner consistent with the self-similar pattern. Profound bullish implications are therefore in place for the weeks ahead.
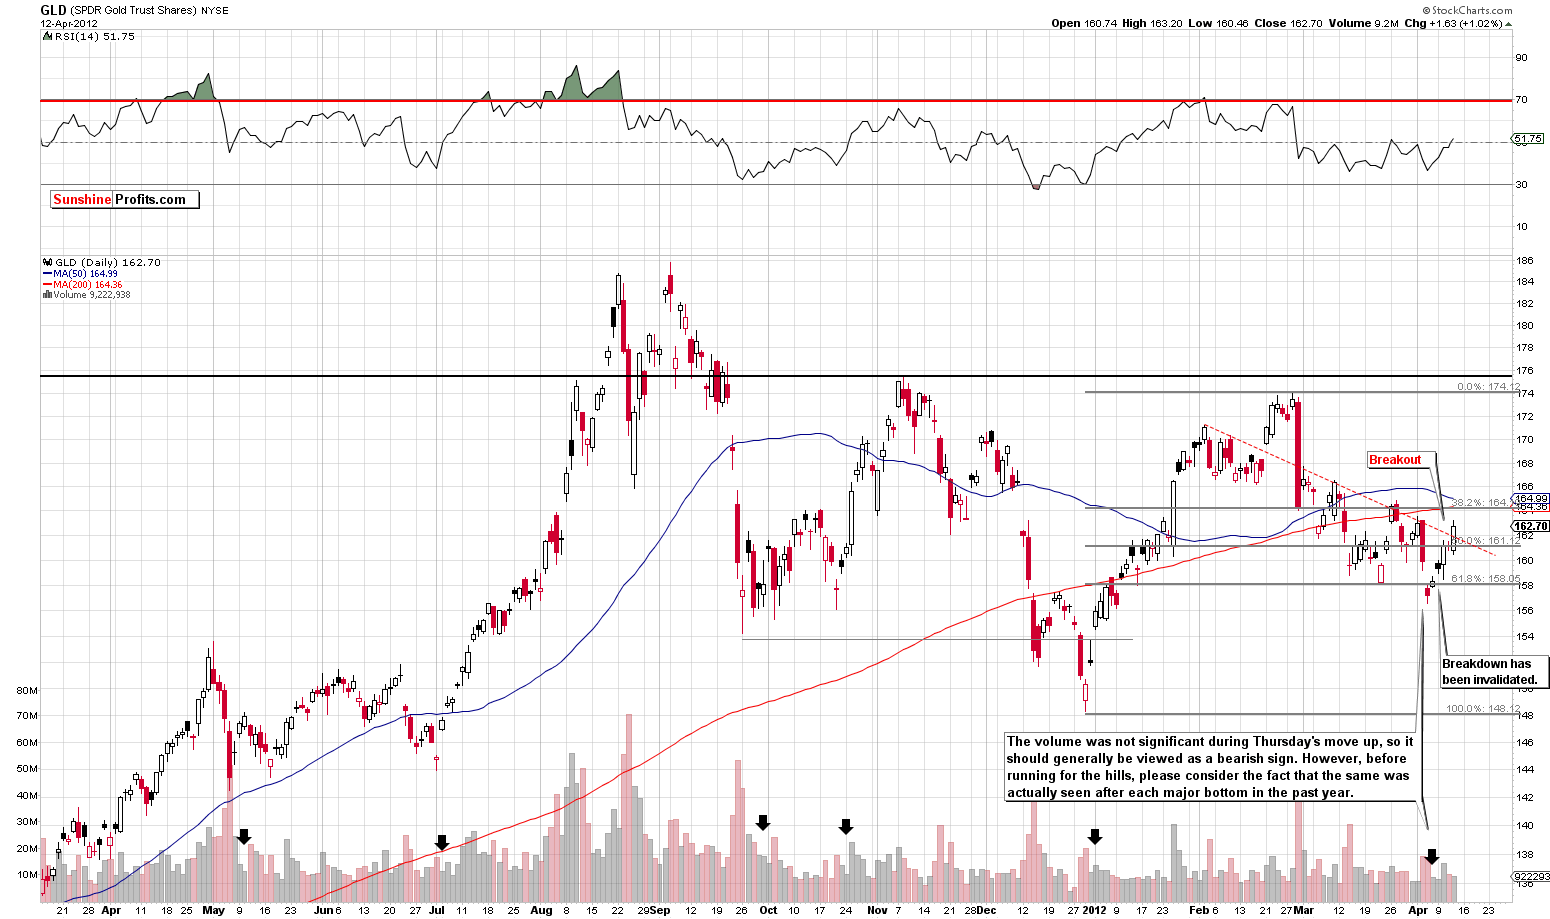
Looking at the short-term, GLD ETF chart (please click the above chart to enlarge), we see here that gold has broken above the short-term, declining resistance line (based on daily closing prices) which has pretty much kept prices in check. In the recent past, each move to this line was followed by a decline, and although the current move is not yet confirmed, it does seem likely that this time the rally will continue and the breakout will be confirmed.
The reason it is more likely this time is that we are following a false breakdown below the lower Fibonacci retracement level. Whenever a breakout or a breakdown is invalidated, a quite strong signal for a move in the opposite direction generally results. Gold could therefore hold its breakout above the short-term resistance line and then move higher.
Volume levels were not huge in the first two days after the bottom but the third day did see significant volume. This is very much in tune with past local bottoms seen as recently as in the months of (late) October, July and May last year. The implications from this chart are bullish.
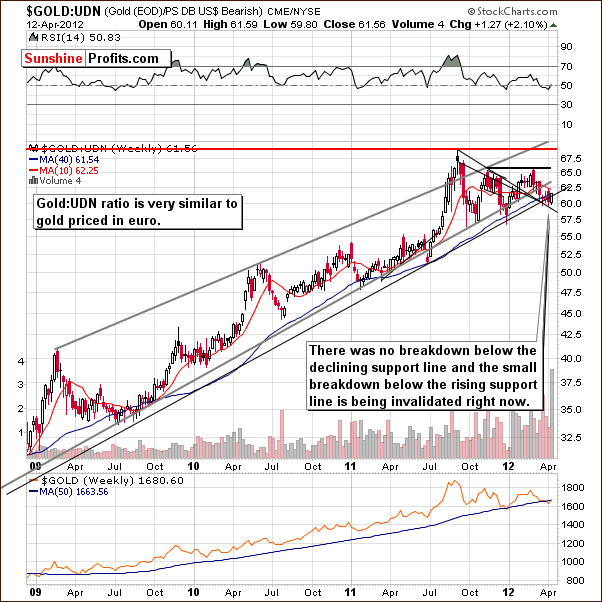
In this week’s chart of gold from a non-USD perspective, the previous breakdown below the lower rising support line is being invalidated right now. If the ratio closes above the lower rising support-resistance line, the breakdown will be invalidated and the resulting consequences bullish.
There was no breakdown below the declining support line based on mid- and late-2011 tops.
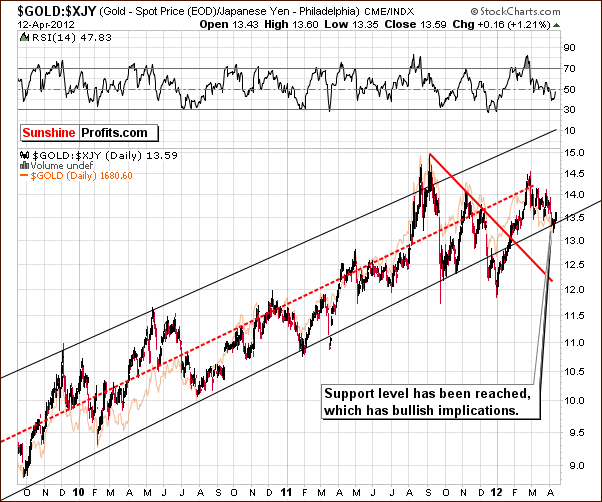
We now take a look at gold from the Japanese yen perspective. Here we also see that a bottom has formed right at the lower border of the trading range. The implications are bullish. The recent decline which came after the sharp rally which began at the start of 2012 was followed by over month of consolidation. Gold’s price could therefore move higher, perhaps to the upper part of the trading channel. Such a move would likely result in a considerable rally in gold prices from the USD perspective as well.
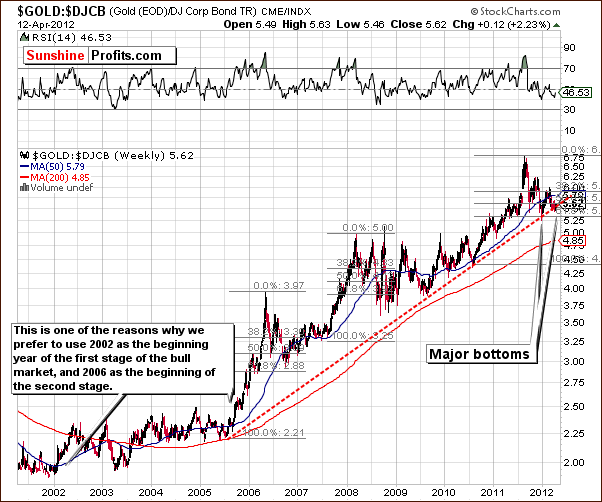
Finally, we look at the gold-to-bonds ratio chart. This chart suggests that we have seen a major bottom and gold is quite likely to now provide us with a strong, multi-month rally. This chart is also clearly bullish.
Summing up, the outlook throughout the gold sector remains bullish and long positions are justified at this time in our view.
Silver
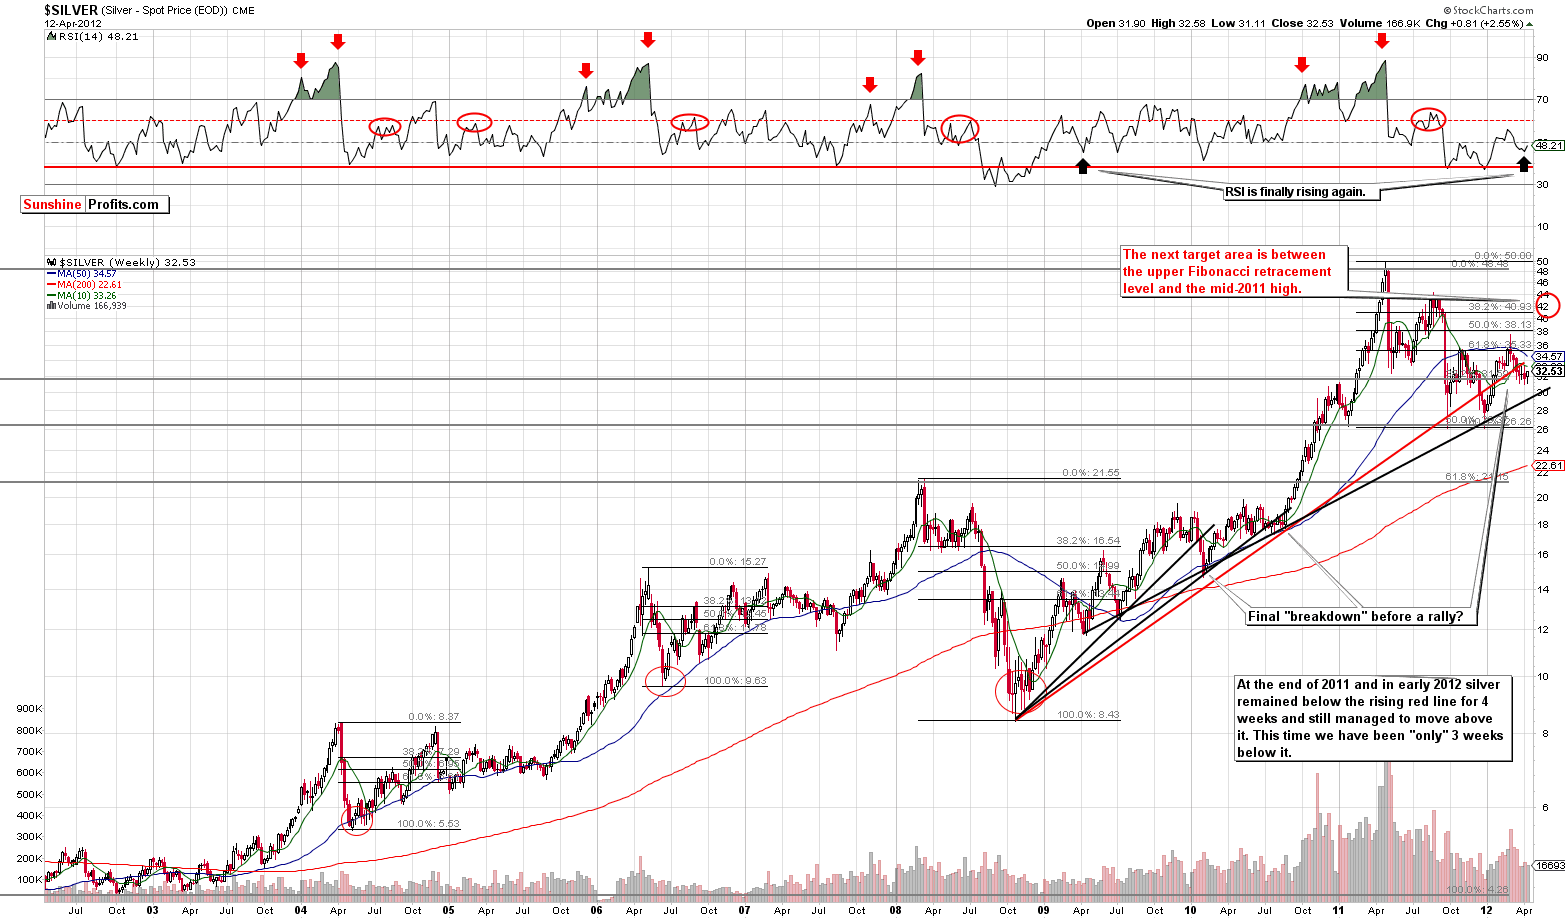
We begin this week’s silver section with a look at the long-term chart (please click the above chart to enlarge). Silver is still moving between its important technical support and resistance lines. We continue to view the situation as bullish since the recent breakdown has not yet been truly confirmed. Silver continues to try to move above the resistance line. It stayed below this line for four weeks last December-January before the move back above it. This time it has been three weeks since it crossed to the downside and an attempt to move back above it fairly soon seems to be a good bet right now.
Silver is now in a post-correction period, so it has the strength to move above the previously impenetrable 50-week moving average (blue line on the above chart). The RSI is finally rising and this is a bullish indication. The most similar trading pattern in the recent past was seen in the 2008 bottom and subsequent rally. Back then a major bottom at was followed by a rally to the 50-week moving average price level, after which prices corrected and then the rally continued.
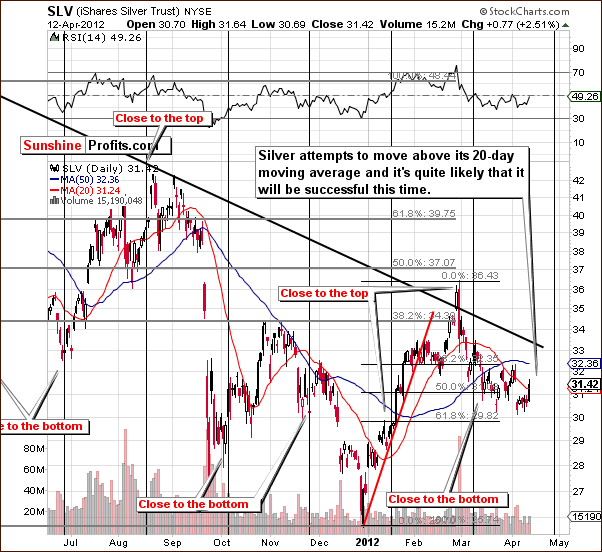
In the short term SLV ETF chart, we did not see any significant breakout this week. Price levels moved above the 20-day moving average, which is the short-term resistance line for silver, but this breakout has not yet been confirmed. The technical picture is not overly bullish yet, but rising volume levels have accompanied rising prices, which is a good sign.
The situation for silver is not too clear as the gold market is the key one to watch. The declining resistance line, which stopped silver’s rally in February, does appear likely to be broken with the rally which has just begun. This line will be encountered somewhere close to the $33 price level for the SLV ETF which is about 5% above Thursday’s closing price.
Summing up, the situation remains bullish for silver, very much the same as is the situation is for gold.
Gold and Silver Mining Stocks
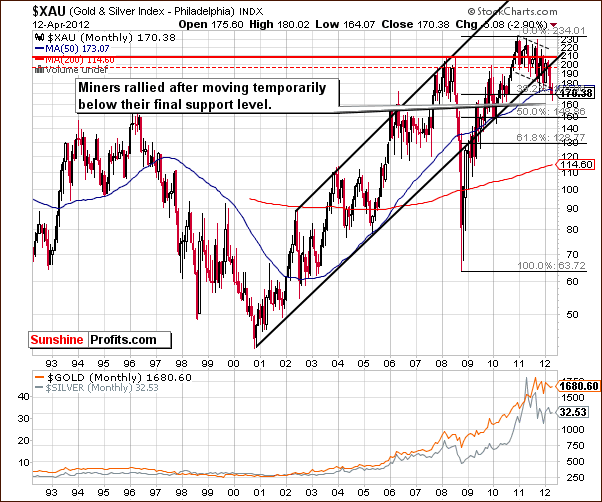
In this week’s very long-term XAU Index chart, we first wish to remind you that we said miners were at their final support level last week. Miners have actually managed to rally after having temporarily moved below it. Once miners decisively move above their 2008 high, the situation will become clearly bullish. At this time however, the above chart is best described as mixed.
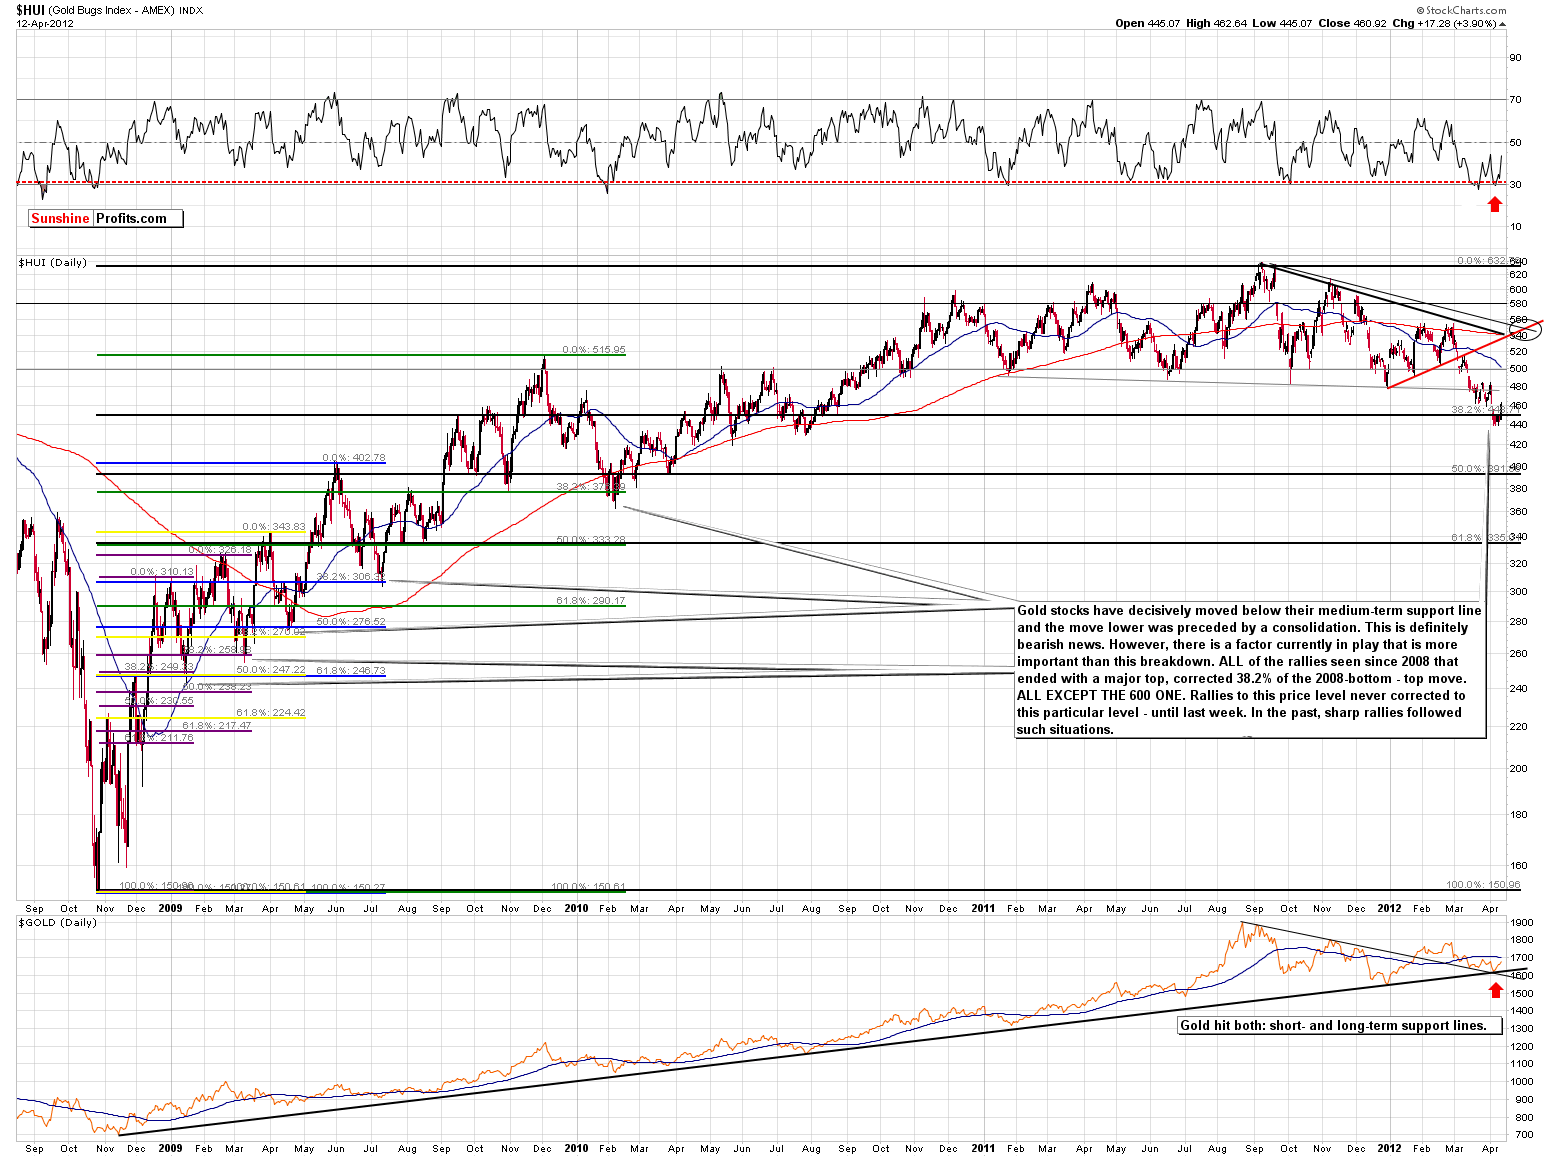
In this week’s medium-term HUI Index chart (please click the above chart to enlarge), we see that gold stocks have likely bottomed. There is a great deal to recover here, however, and a sharp rally appears probable in the coming days and weeks. The sentiment for gold mining stock investments has been extremely low of late. Now just about everything bad has already happened, and it seems that the miners are ready to move higher.
Our previous target level of 550 for the HUI Index still appears to be valid.
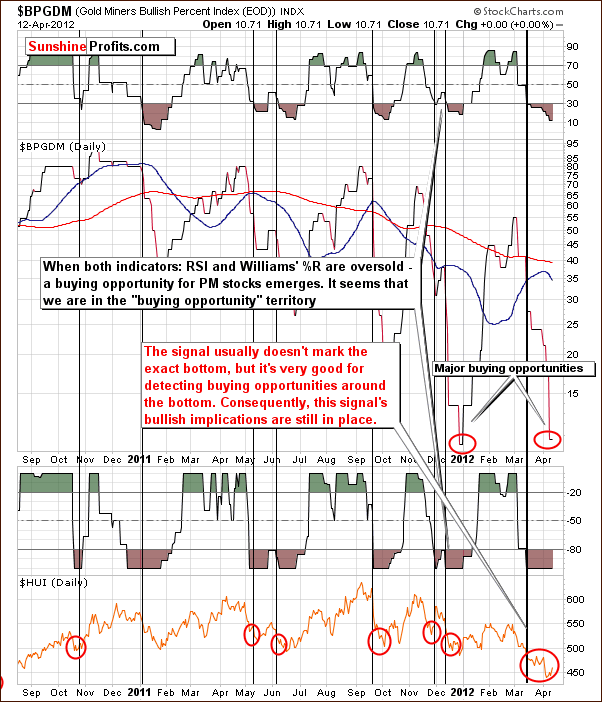
In the Gold Miners Bullish Percent Index chart, we have a confirmation that we have seen and are seeing a major buy opportunity not only for the mining stocks but for the whole precious metals sector. Please note that the index is close to its all-time lows.
Summing up, the outlook for mining stocks appears bullish at this time just as it is for the gold and silver markets. The risk-reward ratio seems to be quite favorable for investors and speculators at this time.
Other Charts
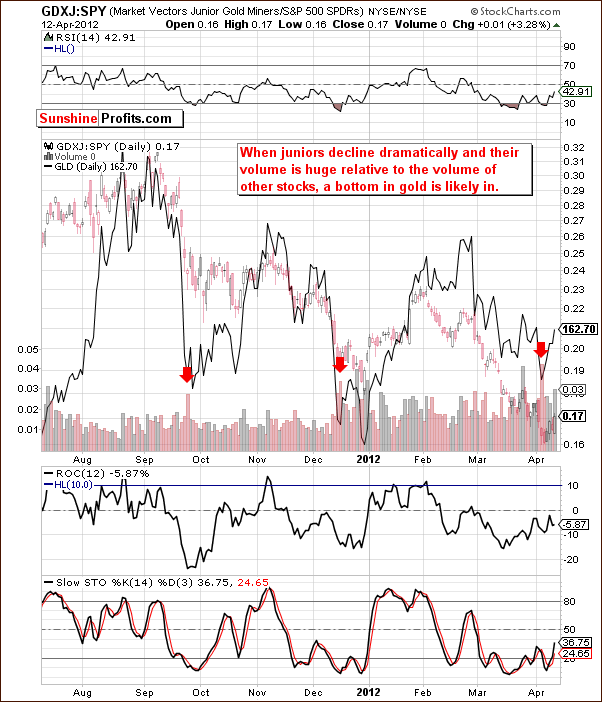
We now look once again at the performance of junior mining stocks as compared with other stocks. We have a buy signal here from the Junior Gold Miners Index, as was the case last week. The reason we mention this, is not because we’ve seen another signal, but to emphasize that last week’s signal is still in place as its implications are not of short-term nature. The medium-term outlook has not changed this week. Bullish implications are still in place, and it seems likely that a rally more powerful than what has been seen in recent days is about to begin here.
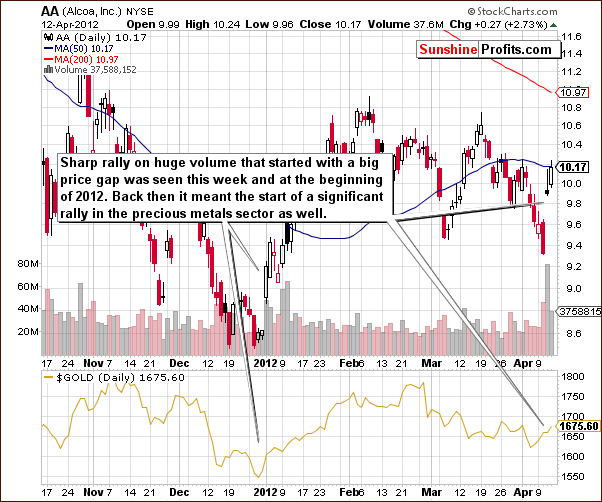
Finally, we have chosen to divert a bit and include the chart for Alcoa, Inc., an aluminum producer. The trading patterns of this stock have been strongly and positively correlated with gold and we are featuring this chart because of a trading event seen for Alcoa this week.
A price gap with huge volume levels started what will likely become a significant rally. This is quite profound and rarely seen. A somewhat similar event was seen right at the beginning of the 2012, though volume levels this time are nearly double.
Please note that the beginning of 2012 was also the time when a major rally for gold begun.
Taken together, this information suggests that the final bottom is in and higher prices will likely follow for gold, silver and gold and silver mining stocks.
Letters from Subscribers
Q: Are you concerned about the low volume in gold? I would think that a move on light volume is not a good thing. Or is the volume strong enough?
A: The analysis of volume is important, but not necessarily in all cases. The most precise signals come from comparing the current situation to the most similar situations in the past. If there are many similar cases and in each case the same pattern followed, it is highly likely that the same pattern will occur again this time. In gold's case this time, we focused on what happened with volume right after bottoms. The fact that low volume in this case works differently than the theory suggests doesn't invalidate its usefulness in other cases (for instance low volume during an upswing after a big rally on huge volume still suggests a local top).
Q: I would like to read your opinion on this.
A: This is an interesting piece of news for silver investors. While investment demand for silver is not as great as it is for gold (at least not yet), we have some indication that people are getting more familiar with the white metal. Perhaps they will be more likely to invest in silver in the future... Actually, that's what we expect to see anyway, but this news might be a step in that direction. After all, even Olympic gold medals are now in fact mostly silver medals - not only in terms of weight, but also in terms of value.
Q: You have a price target for gold of approximately $5,000.00 before the gold bull is over and you said something about inflation. Attached is a chart that shows that gold in the 1970s made a run of 745% and if it does the same thing this time, the top would be somewhere around $2,200 to $2,600 or so.
Now, inflation in the 70s was related to increases in pay. Everyone was striking as workers kept demanding higher wages, which led to higher prices. This time we don't have that type of inflation so I'm not sure how this would work out.
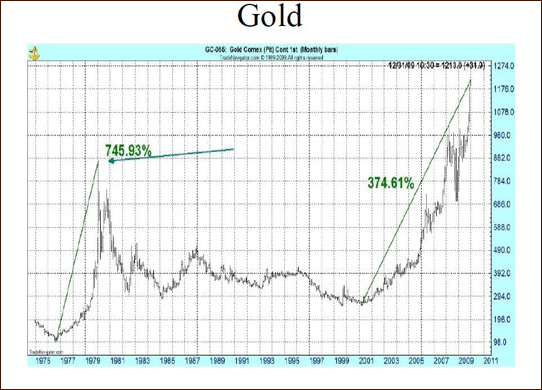
A: We believe that the bull market in the 1970s didn't start in the second part of the decade, but earlier - with gold at $35. Taking the above analogy into account (similar rallies percentage-wise) but with $35 as a starting point, we get a $6,000 - $7,000 long-term target for gold, which is very much in tune with our previous "at least $5,000" remarks.
Workers kept demanding higher wages as their own costs had risen based on oil shocks. What you are referring to is the Keynesian breakdown of inflation: the cost-push (in this case) and demand-pull kinds. Generally, we view inflation as a consequence of increases in the money supply - a more traditional definition.
However, even taking the former definition into account, the current economic situation is quite similar to what was seen in the 70s, even though official statistics may indicate otherwise (everything is okay and under control, right?).
Back then, we had economic slowdown along with higher inflation and this is more or less what we have right now - which is actually a stagflationary environment. This time we also have higher oil prices, but also a much greater money supply and mountains of debt.
Gold and silver soared in the past in the stagflationary scenario and we believe this will also be the case this time.
Q: I’m already very invested in silver, gold and some mining stocks and would like your perspective on whether I should hoard copper pennies and/or nickels? My guess is their value will go up during the hyperinflation period.
A: Our best guess here is that if you have physical silver and gold and you have it in several places (geographical diversification) and you have some capital dedicated to other long-term investments and trading, then you can keep these pennies as a form of diversification into industrial commodities. We don't think that they would rise in value any more than precious metals (in fact less), but diversification benefits can justify holding them.
If the above assumptions are incorrect, then it seems that you might want to sell those pennies and invest the proceeds in silver, gold and platinum and diversify geographically.
Q: I know you are really bullish on the metals here and I read and study everything. To me it's becoming increasingly apparent this correction will continue until the Fed announces a new round of QE. A few of the Fed officers have stated this week that conditions would have to be much worse before they would support that. The Beige Book stated today that the economy was growing at a moderate pace and that's the information they will use at the next meeting.
I checked Marc Faber’s blog and he still thinks stocks and gold are vulnerable for more correction. I tried to buy some mining stocks last week and got my face ripped off even though they seem oversold. Wouldn't it make sense just to wait until they announce some kind of additional QE? I am also concerned that the problems in Europe are resurfacing, which will push the euro down and the dollar up.
A: I'm happy to hear that you take your time to read and study the market from various perspectives - this will very likely pay off sooner or later in terms of confidence in your investment decisions, associated peace of mind, and ultimately higher profits.
Let's start with the second question. Yes, additional problems in the EU could ignite a move lower in EUR:USD which would translate into higher USD Index values. However, please keep in mind that there were times in previous years (after 2006) when gold moved higher precisely along with higher USD values (lower EUR values). The reasoning behind this is that European investors could be buying gold as a hedge against the escalation of their local problems along with buying dollars. Given that gold also appears to be at a major bottom from the EUR perspective (just like the Gold:UDN chart indicates), we might see the prices of the yellow metal move higher in all currencies regardless of their relative valuations (i.e. currency exchange rates).
Moving on to the first question about QE, once it is announced the fundamental situation for gold will improve even further. However, please keep in mind that prices move ahead of fundamental information. Once everyone becomes convinced that the next round of QE is a fact, it will already be "in the price."
The best time to invest in a given asset is when everything that could have gone wrong... has. Once people realize that, all of the bad information becomes "priced in" and thus the only thing the market can react to now is positive news. Right now we have gold in a lengthy consolidation, very negative investor sentiment, and on top of that the Fed said that there will be no more QE until things get worse.
Those who believed it have likely already moved out of the gold market. Now, when economic indicators get worse, they will move slowly back into gold as they will see QE as more probable.
It is said that the market buys the rumor and sells the fact. Remember when SLV ETF was introduced? Silver rallied significantly prior to the announcement of this piece of news and declined soon after it became a fact.
Summary
The situation in the USD Index is rather bearish for both the short and long term. The general stock market picture is mixed for the short term and bullish for the medium term. The implications of these currency and stock markets are rather bullish overall for the precious metals but should not be our primary focus at this time. The charts of the precious metals and mining companies seem to be better resources today. The situation in the metals markets and the sentiment of investors is quite extreme and likely to drive prices higher in the coming weeks.
This week we have probably seen the beginning of the long awaited rally as the metals appear to have reached their final bottoms. The Alcoa chart confirms this, and the medium term Junior Gold Miners Index buy signal is still in place. The analogy with 2006-2007 continues, and similar price patterns (rally) could very well emerge.
Gold stocks have corrected to their 38.2% Fibonacci retracement level and may be ready to move sharply higher in the days and weeks ahead. Keep in mind that our Sunshine Profit Indicators flashed recently and these buy signals are also still in place. Overall, the bullish implications have been confirmed by many sources. Betting on higher precious metals prices appears appropriate at this time and justified from a risk-reward basis.
We believe that speculative positions should be entered if this has not yet been done or if such positions were exited during the previous period of volatility.
Target levels remain as follows: slightly above $1,900 for spot gold, $40 to $45 for spot silver, 550 for the HUI Index, and $55 for the GDX ETF.
This completes this week’s Premium Update. Our next Premium Update is scheduled for Friday, April 20, 2012.
Thank you for using the Premium Service. Have a profitable week and a great weekend!
Przemyslaw Radomski

