
Yellow and silver are our favorite colors, but red is what we are seeing on the boards this week after the U.S. central bank dashed hopes for more monetary stimulus and a weakened euro weighed on sentiment. Gold and other precious metals were caught in a broad market sell-off which spread across commodities and equities. Bullion lost more than 3 percent over two days after the U.S. Federal Reserve released minutes from its last policy meeting which showed policy makers were less inclined to launch more monetary stimulus. This was strange since the Fed did not explicitly take QE3 off the table. In fact, according to the minutes, if the recovery stumbles, or if inflation is too low, the Fed is already prepared to launch QE3.Press accounts report that the sentiment dimmed gold's appeal as an inflation hedge.
Wednesday we sent out a Market Alert in which we said:
We believe that precious metals will move higher sooner rather than later (most likely during the first half of April) and that being long gold, silver and mining stocks is justified from the risk/reward perspective.
All that red is still a post-breakout consolidation often seen before a rally takes off, only this time, the consolidation is significant (2 months long) enough to make even the staunchest gold bull feel nagging doubts. We want to remind you of an investment rule of thumb-- the bigger the consolidation, the bigger the following rally. It’s like a coil, the more you press on it and harder it will spring back, the more you pull back the bow the further the arrow will fly.
Why are we so bullish and are not afraid to tread where others are rushing out?
It’s not based on intuition, or reading the minutes of the last Fed meeting, or scanning the latest jobs reports. We base our calls on the current market sentiment, fundamentals (to some extent) and technical analysis along with related approaches (fractal and cyclical analysis).
Technical Analysis has its rhythms, forms, textures and harmonies, and when it is done well, it can be like a Bach fugue with intellectual depth, technical command and even profound beauty. It is not an exact science, but it can help us anticipate what is likely to happen to prices over time. Our notes and scales are charts and proprietary tools developed exclusively by us.
One of those tools that we have developed and which is available only to Sunshine Profits subscribers, is our SP Extreme indicator. Lately this indicator has flashed several buy signals, which is not something we see often. The last time we saw such a number of signals from this particular indicator was in mid-2009, when the HUI moved close to the 300 level. Several months later, it topped above 500. If this scenario is to repeat (moves are analogous percentagewise), the HUI could top close to 750 in a few months.
In mid-2009, the period when our indicators flashed a number of buy signals, silver was a bit above $12 and gold was just above $900. If the rally that took place in 2009 were to repeat, we are looking at a $2,100 price target for gold.
We often get fearful queries from short-term traders who are concerned about short-term movements in the precious metals market. Now we’re even getting worried e-mails and questions from investors who are holding long-term positions. This is an indication that sentiment is scraping the bottom and that is usually seen at major bottoms, as we explained in Wednesday’s Market Alert.
It is certainly possible that the Fed is really lulled by recent improvements in some economic indicators into thinking that the economic picture is getting rosy, or it could be the case that they just want people to believe that they think so. Anyway, we don’t see it that way. Economic slowdown in Europe, China, India, Latin America and virtually everywhere else is sure to cut demand for American exports. Petroleum and gasoline prices are putting pressure on consumers and cutting into purchases of other goods and services. Saber rattling in the Middle East could make the prices of oil go through the roof. In addition, let’s not forget the eurozone problems that seem to be off the radar, the depressed housing sector, the heavy debt burden that should be keeping government economists awake at night. The Fed would be thrilled to see a weaker dollar and a higher inflation rate that would reduce the real value of the U.S. debt mountain.
Without a doubt, a strike against Iran’s nuclear sites by Israel and or the U.S. would have deep implications for the world’s economy and, for the price of precious metals. But what are the chances that this will take place in the short term?
One member of our team is based in Israel and says most Israelis believe that Israel will not strike on its own. By threatening to strike, Israel successfully places Iran’s nuclear program at the top of the world’s agenda and encourages diplomatic and economic sanctions that could make Iran back off. Perhaps with some luck, the Iranians will overthrow their regime. It’s not that Israel is not taking Iran’s threats seriously. Israeli leaders have learned through history’s most painful lesson that the words of mad tyrants who hold power need to be taken at their face value. Israel is not sitting idly by. In a press conference this week summing up three years in office, Israeli Prime Minister Benjamin Netanyahu said that international sanctions were hurting Iran's economy but not enough to persuade it to curb its nuclear ambitions even slightly. Is this just more saber rattling? A recent Israeli report concluded that reprisals by Iran’s allies from Lebanon and Gaza with rockets launched at Tel Aviv would result in some 300 dead. A nuclear weapon in the hands of the ayatollahs could be more dangerous by far. Another danger is that a nuclear Iran could start an arms race in the Middle East where there are enough unstable regimes to make it intolerably dangerous for the entire world. In any case, it’s unlikely that Israel would do anything before the elections in the U.S. and then depending on who gets elected, Israel might do a joint venture with the Americans. But this is all speculation and all time will tell.
It’s now time we turn to the technical portion and start with the US Dollar chart (charts courtesy by http://stockcharts.com.)
USD Index
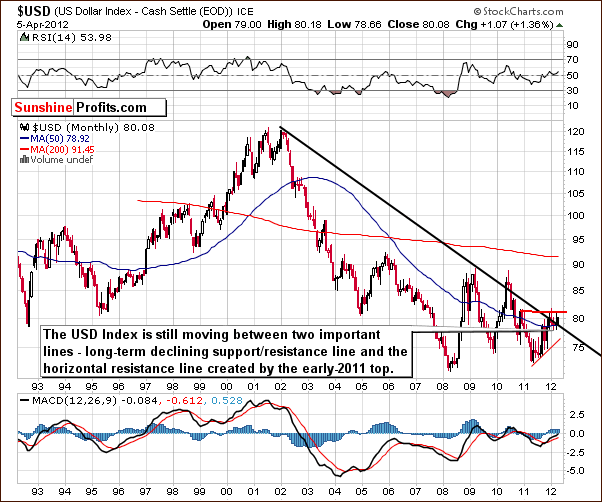
Our first chart this week is the very long-term USD Index chart. We see that the sideways trading patterns continue between the two levels which are quite important from a technical perspective. These are the declining long-term support line and the horizontal support line based on the early 2011 high. At this point, the very-long term chart remains mixed as the USD Index moved a bit higher once again this week, but no breakout has been confirmed thus far.
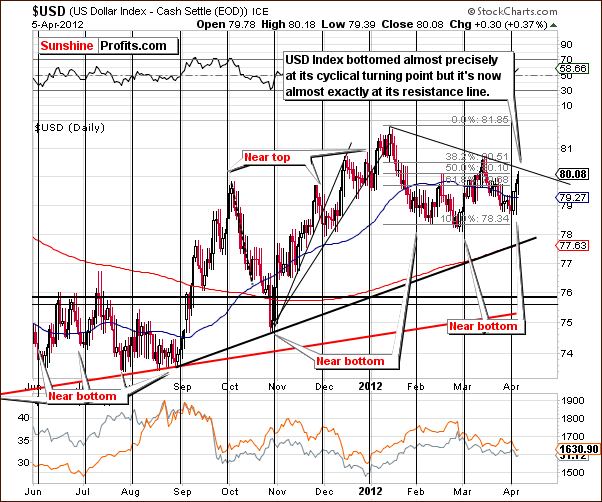
In the short-term USD Index chart, we see that a move to the upside began at the recent cyclical turning point. This likely contributed to the lower prices seen for gold and silver this week as seen in the small, lower chart above.
It seems likely that since the USD Index was a catalyst for lower precious metals prices this week, perhaps a decline in the USD Index will result in higher prices for gold and silver. Also, since the short-term resistance line for the index is close to the Thursday intra-day high, we may see this turnaround very, very soon.
Based on this chart, the USD Index is not likely to move much higher and precious metals therefore, not much lower. On Thursday, in fact, the USD Index and the precious metals both moved higher.
Summing up, the outlook for the USD Index is bearish from a short-term perspective, and the short-term top appears to be almost in. With the short-term resistance line very close to today’s USD Index level, a decline seems likely here although a small uptick could be seen first.
General Stock Market
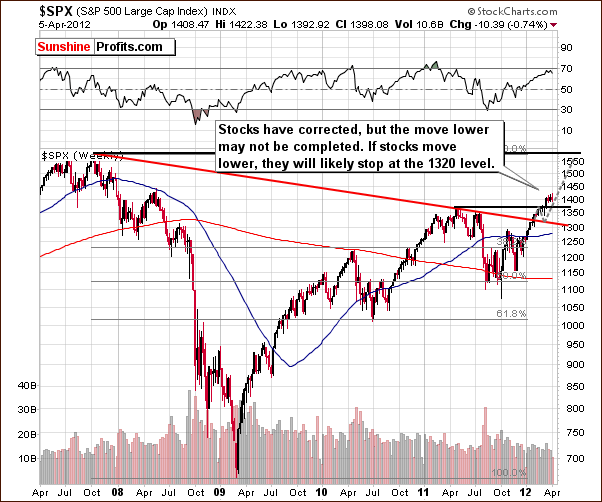
In the long-term S&P 500 Index chart, little has changed in the past week. Quoting from last week’s Premium Update,“It seems that stocks may pause soon, as they’re about to reach their 2008 highs.” Well, we did see a pause this week though the correction may not yet be complete. The downside target level for the S&P 500 Index now appears to more likely be around $1,320.
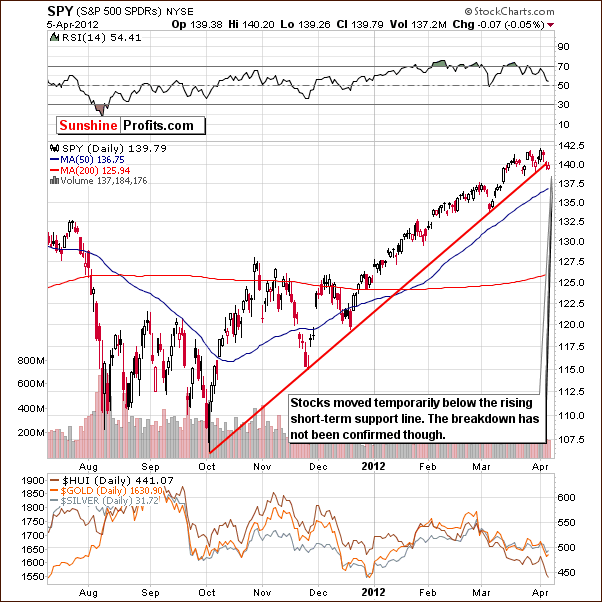
In the short-term S&P 500 Index chart, we are now seeing stock prices below the short-term support line although this move has not been confirmed. Prices are just slightly below this line however, and therefore only insignificantly bearish implications are in place.
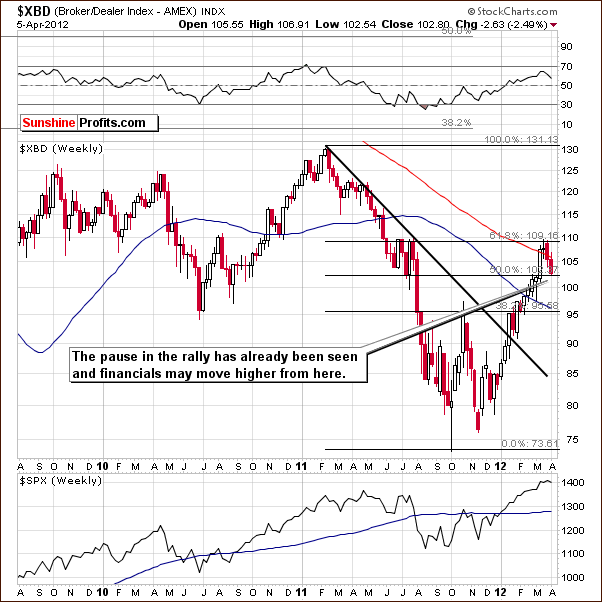
In the Broker-Dealer Index chart, we see that the financials (this index is a proxy for financial stocks) are no longer providing a short-term bearish picture. Two weeks ago, we said that the financials may take a breather. In our March 23 Premium Update, we stated that “The financials have reached the highest resistance level and a pause appears quite likely at this time. This is a bearish short-term indication and some consolidation, possibly to the 102 level and the 50% Fibonacci retracement level could be seen before the rally resumes.”
This has indeed happened as the Broker-Dealer Index has declined nearly 4 points, about 3.6% in two weeks. The question now is whether the correction seen has been enough to balance the previous rally. We are not so sure of this and feel that the local bottom could be in, or perhaps the financials could move a bit lower without invalidating their recent rally.
Summing up, at this point, the outlook for the general stock market is mixed as it is bullish for the medium term and a bit more bearish than not for the short term.
Correlation Matrix
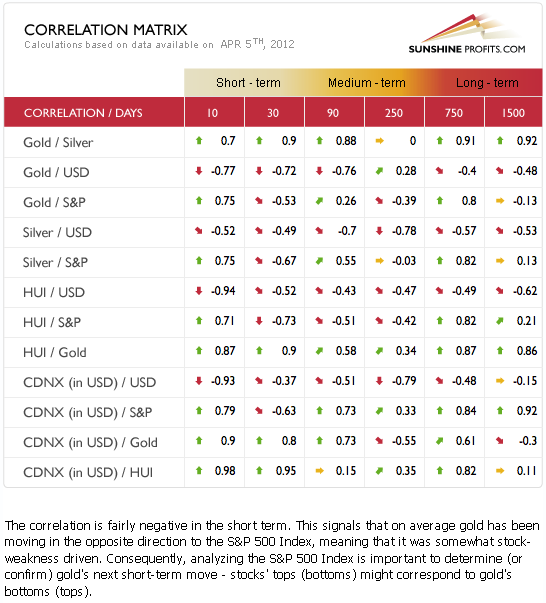
The Correlation Matrix is a tool, which we have developed to analyze the impact of the currency markets and the general stock market upon the precious metals sector. Currently, the coefficients for precious metals and the general stock market are negative in the short-term, 30-day column but this is not the case for the past 10 trading days. There appears to be a quite perplexing influence here. Overall, with negative coefficients in the 30-day column, the suggestion is that declines in the general stock market will not necessarily be bearish for the precious metals sector.
This week, the coefficients are more stable between the precious metals and the USD Index. Both the 10-day and 30-day columns are negative. Short-term moves in the USD Index will likely mirror what is seen in the precious metals sector which will move in the opposite direction. Taking into account both: USD Index and S&P 500 Index, we view the “background picture” for precious metals as slightly bullish in the short run.
Gold
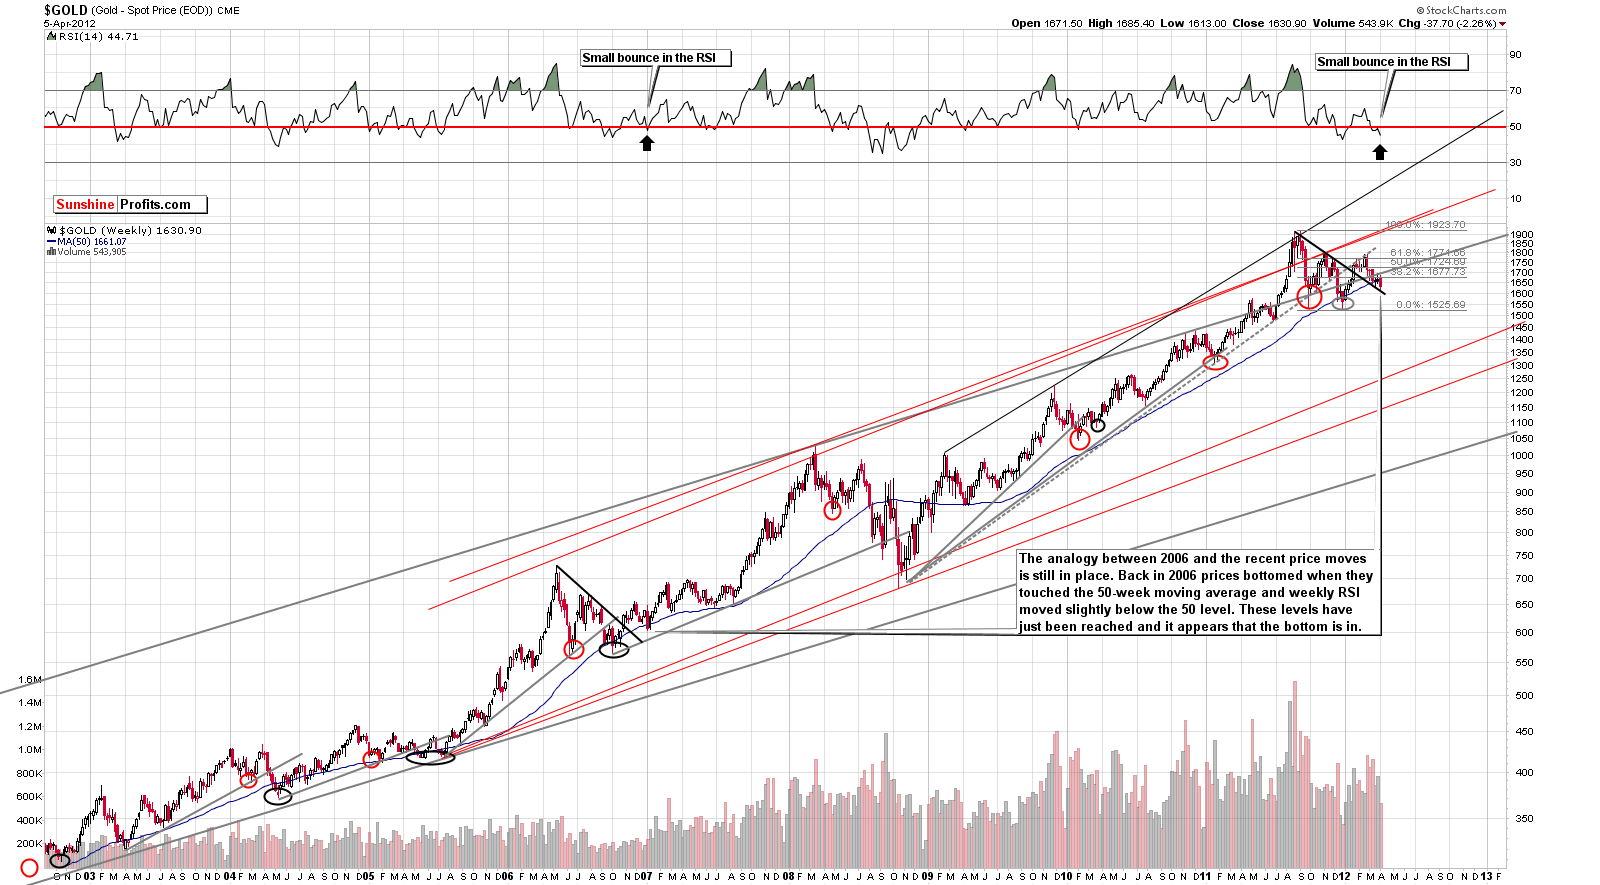
This week we begin our gold section with a look at the very long-term chart (please click the above chart to enlarge). Very little has changed this week as gold prices declined slightly and are still above the declining support line. This is very much in tune with the trading patterns seen in 2006. The shape of the decline is a bit different but the general patterns are still quite similar.
Comparing the RSI levels back then to now is quite interesting. At the end of 2006, the RSI moved a bit higher, then bottomed, and the final bottom was seen for gold prices. In fact, they’ve never moved below the bottom that formed. We had not seen this type of RSI pattern prior to this week, but we have seen it now. So we now have yet another similarity between 2006 and 2012. The consequences are bullish as a strong rally followed back then.
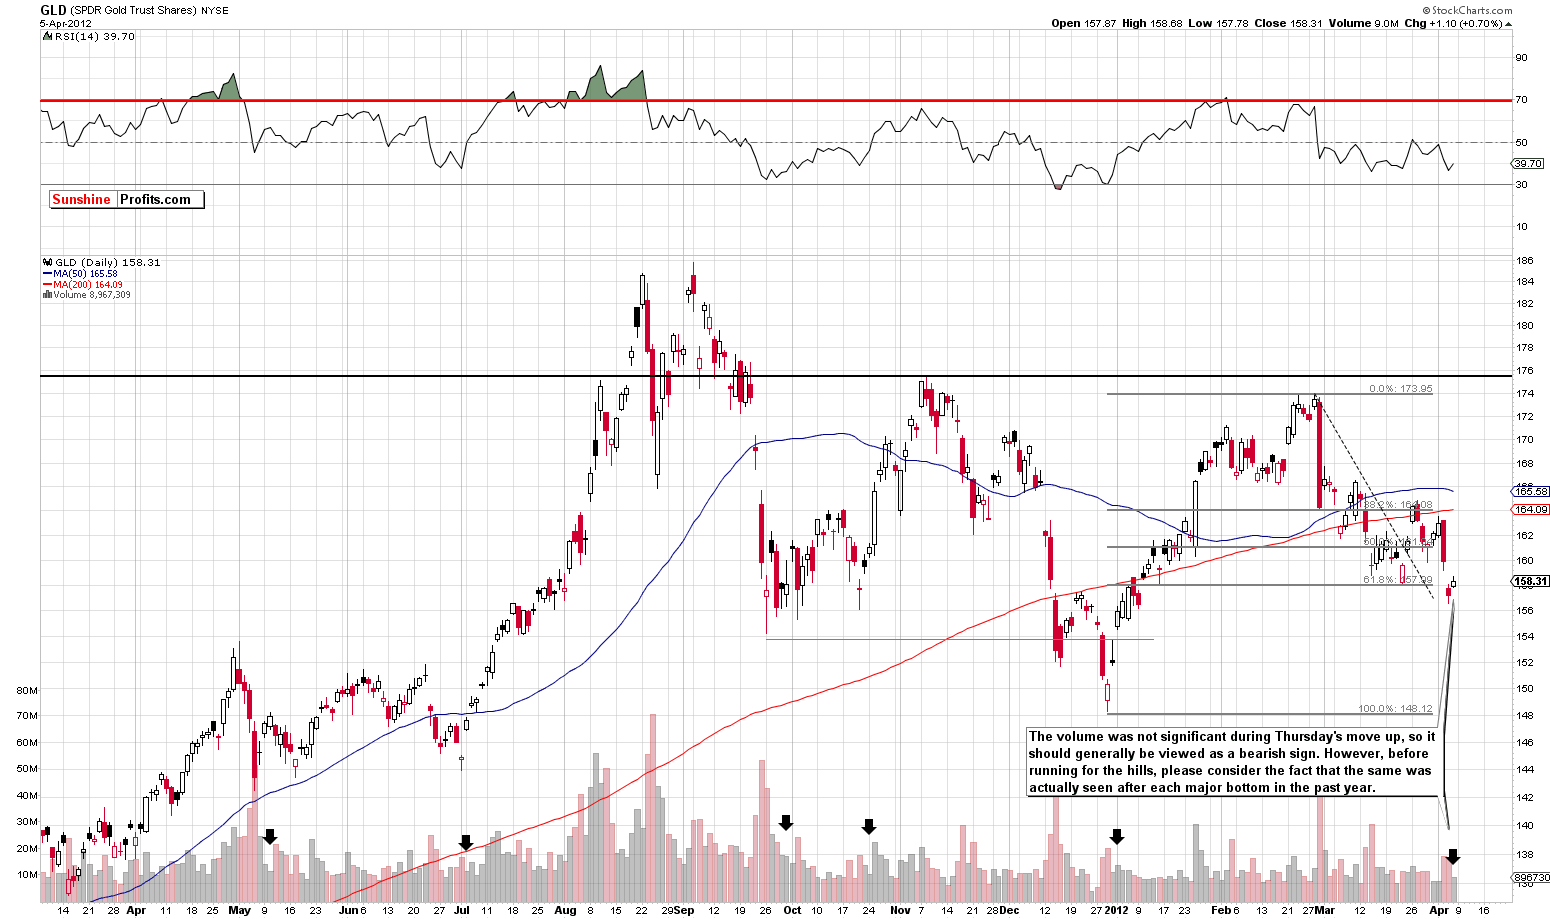
We now take a look at the very short-term chart (please click the above chart to enlarge) in order to analyze the visibly lower volume seen in Thursday’s rally. Of course, declines seen on high volume in conjunction with low volume moves to the upside are generally bearish indicators.
However, let’s compare what happened this week with what happened previously around local bottoms. If prices rallied back then, what were the volume levels? Also, is what we’re seen now truly a bearish signal? The point is that if all other bottoms were confirmed by a post-bottom rally on huge volume, then it would mean that the current pattern is not really in tune with them and thus that the bottom is not yet in.
Looking at previous major bottoms, we soon see that rallies which followed with volume levels lower than the levels seen in the preceding decline is very much the norm. So the volume levels this week are really not unusual, and Thursday’s low volume is therefore not a bearish indication at all.
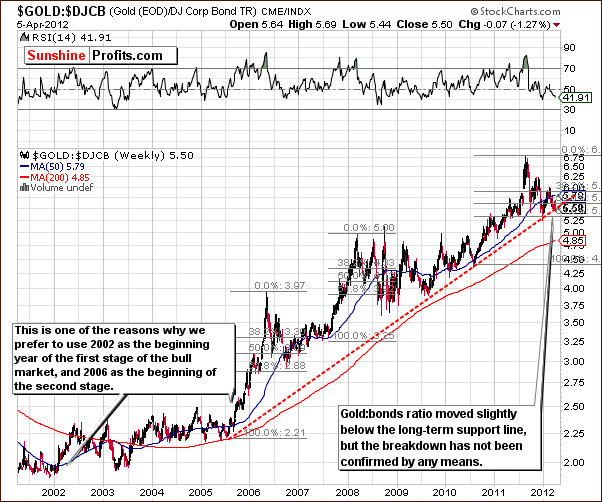
We now turn to the gold:bonds ratio chart which compares daily closing gold prices with corporate bond index. We see that the ratio moved lower intra-day on Thursday and then reversed to close right at the long-term support line. No breakdown has been seen here, and the situation remains bullish.
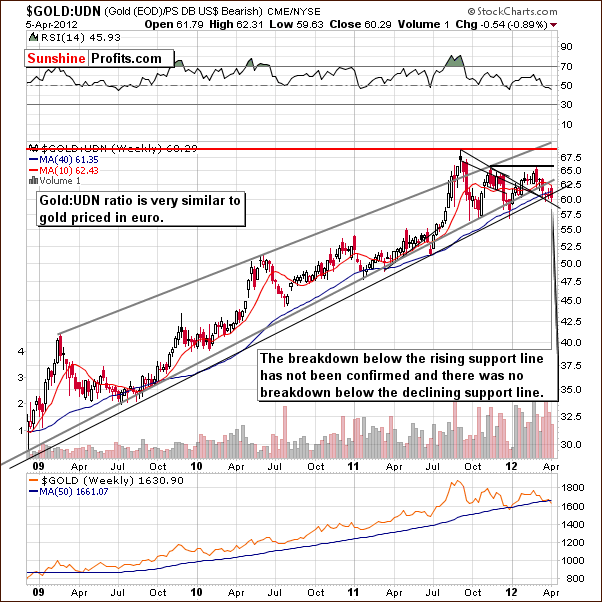
In this week’s chart of gold from a non-USD perspective, we see that the index moved to the declining support line and then bounced. A very small move below the rising support line was seen recently but the breakdown was not confirmed. Consequently, the above chart remains bullish.
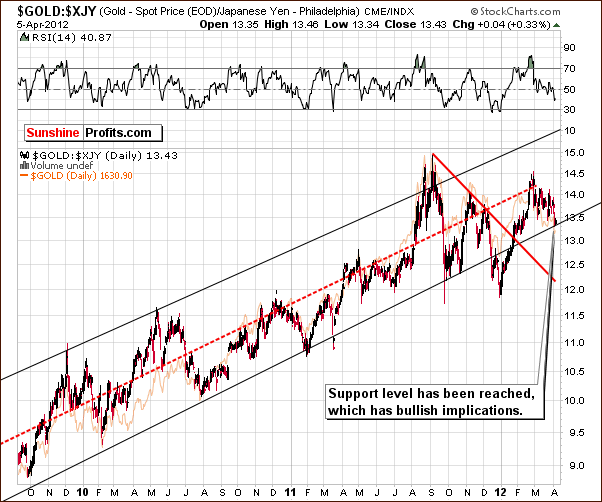
We turn now to the Japanese yen perspective, which helped us detect a local top earlier this year and can be an important and useful tool at times. A support level has been reached, the current index level suggests that the local bottom is being formed, and the overall implications of this chart are therefore bullish.
Summing up, the situation in gold itself remains very bullish. Thursday’s rally on declining volume has not invalidated the bullish picture.
Silver
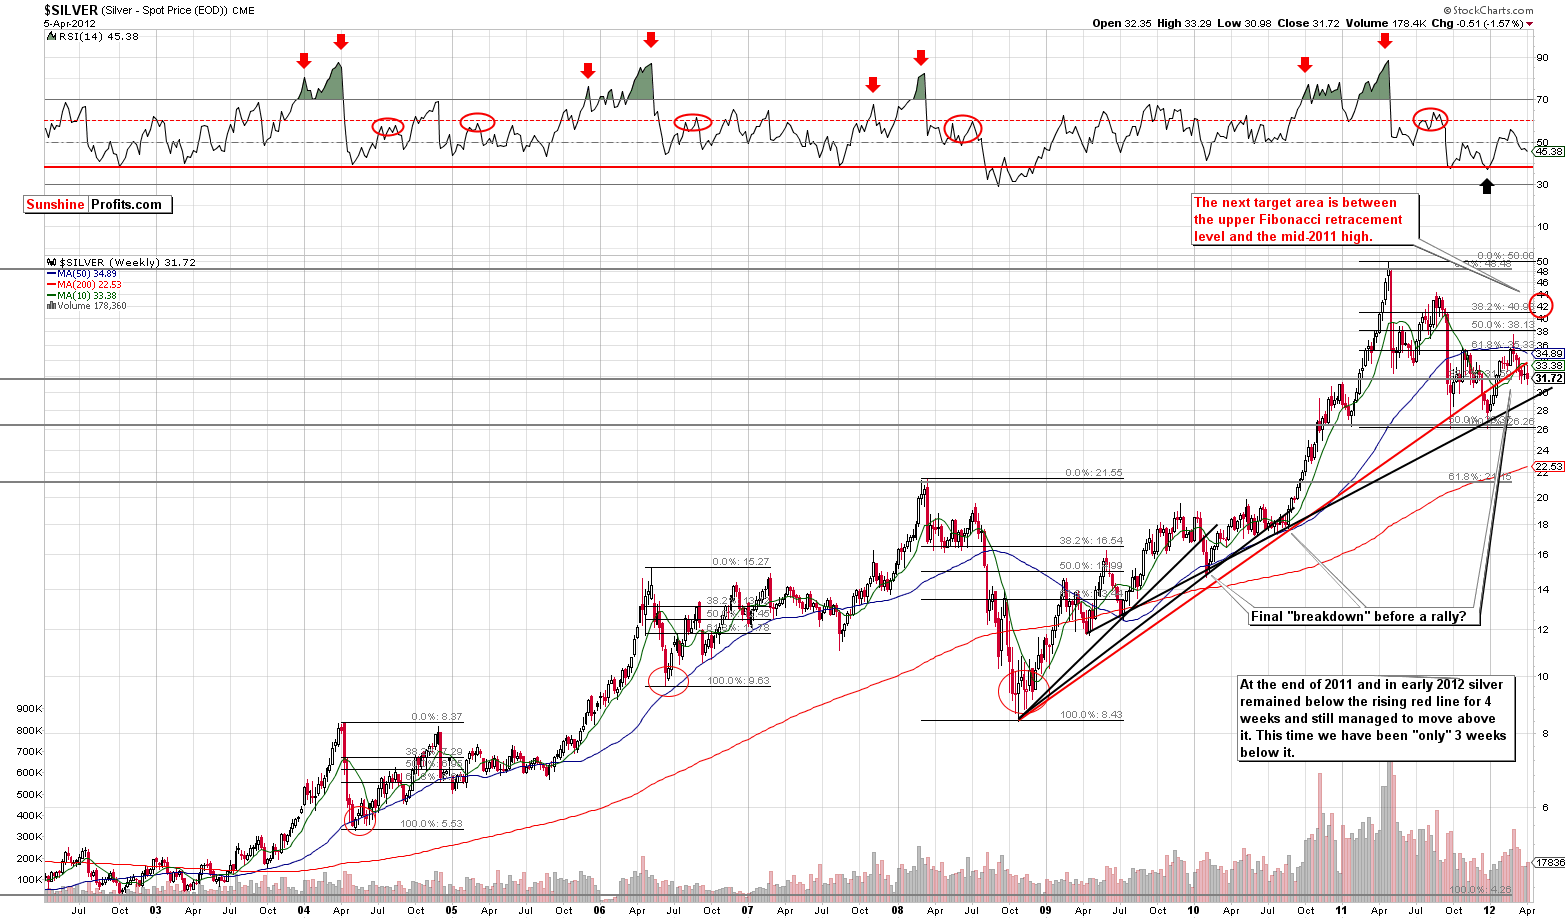
We begin this week’s silver section with a look at the long-term chart (please click the above chart to enlarge). There is really nothing new to report this week as silver continued to consolidate below the rising, red resistance-support line. The question now is if the breakdown was confirmed.
It seems that confirmation of the move is not probable. We see a recent example where silver’s price remained below this line for four weeks and moved above it in the fifth. Currently, we have been below this line for three weeks, so the breakdown has not been confirmed and looking at another support line based on previous local lows, there has been no breakdown whatsoever. Upside target levels remain in place.
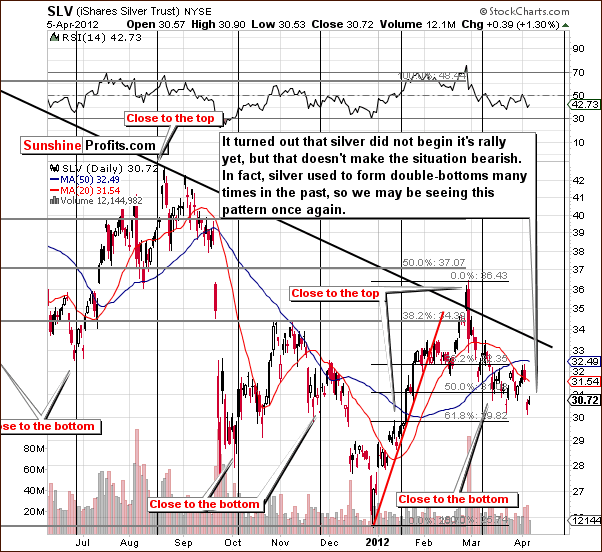
In the short term SLV ETF chart, we have more of the same implications. This week’s price action appears to be part of a double bottom pattern. Such moves have been seen often and are not really cause for concern. The June 2011 bottom and the September 2011 bottom are good examples of a similar pattern. All-in-all, the situation has not turned bearish this week.
Summing up, the situation has not changed as much as it might appear. Silver is still closely connected to gold and its outlook remains bullish.
Gold and Silver Mining Stocks
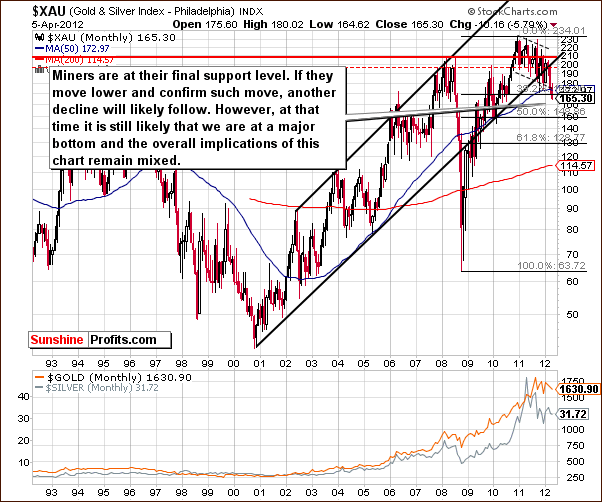
In this week’s very long-term XAU Index chart, we do see some significant changes. A fairly large decline was seen this week and this index is now close to the 38.2% Fibonacci retracement level. This could be the final bottom we expected. However, if the breakdown continues and the index moves lower in terms of weekly closing prices, much bigger decline would appear likely. This does not seem probable right now, however and the following chart provides an explanation.
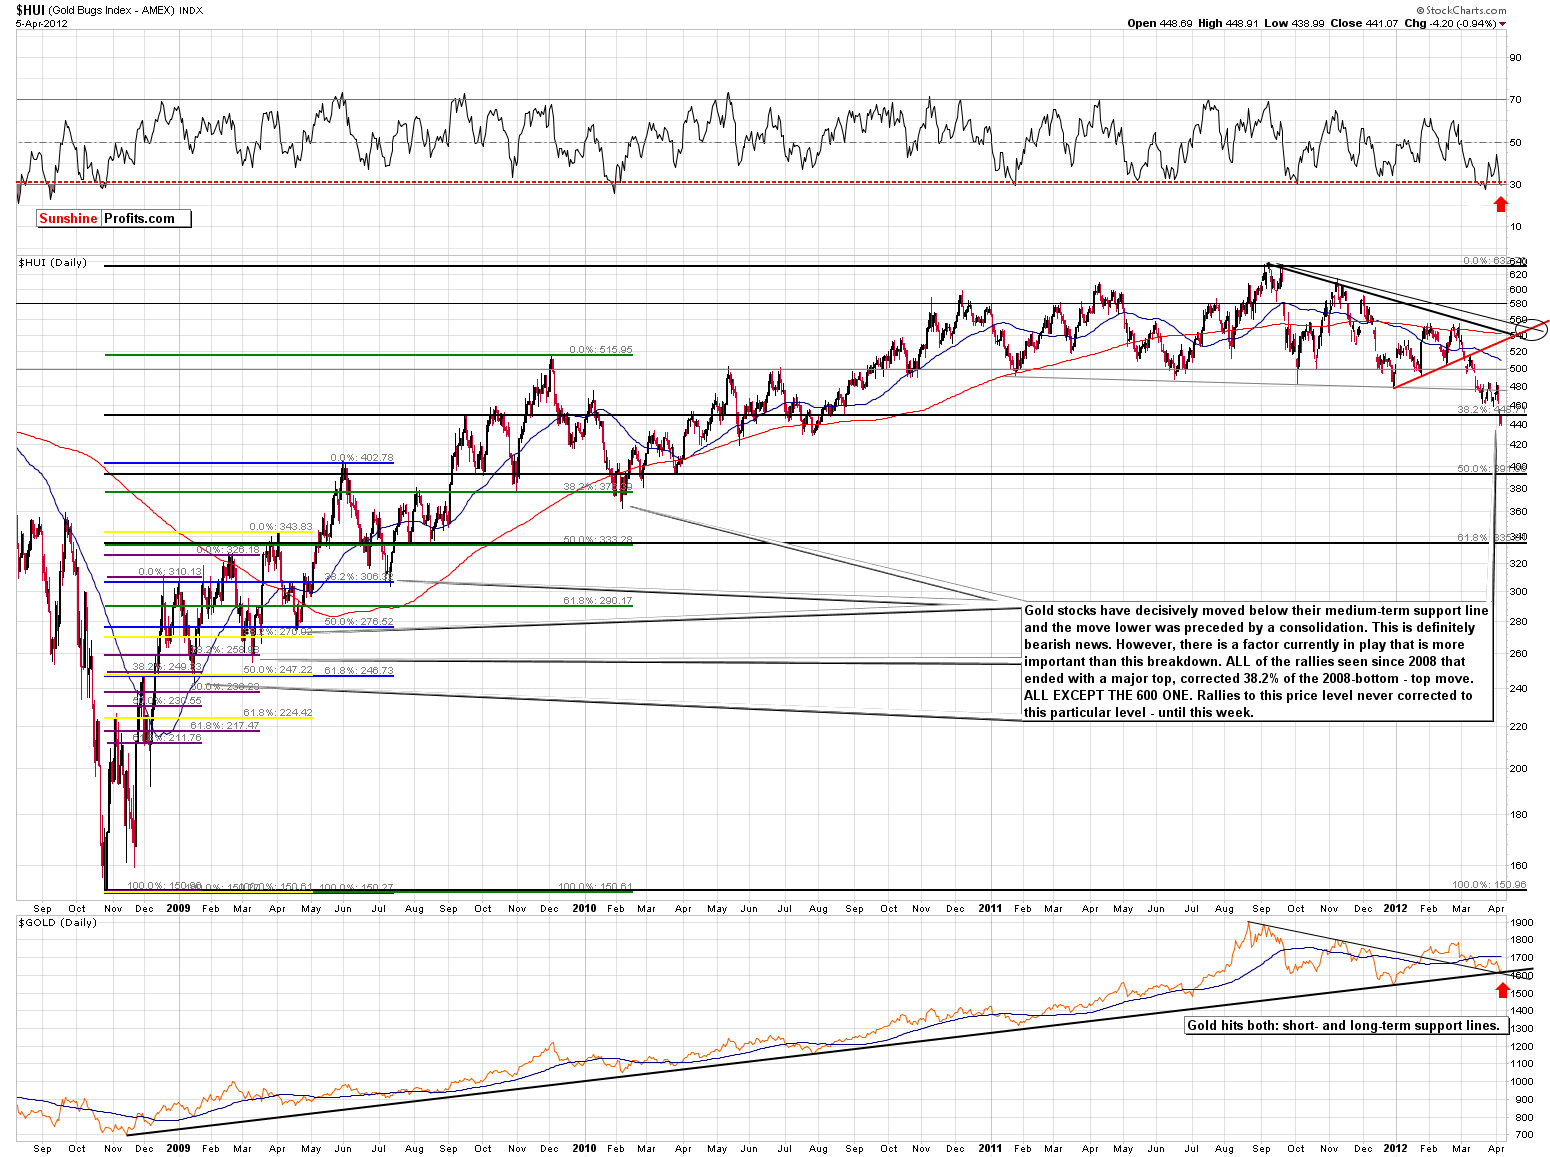
In this week’s medium-term HUI Index chart (please click the above chart to enlarge), we have an evolution into something much bigger than usual. We decided that since we are talking about a major bottom in gold and silver and we provide long-term charts to support that, the proper approach to the HUI Index should be long-term as well. We thought that we might see something from this perspective that was not visible previously. And we did.
The HUI Index declined below previous lows and we may actually have seen a major long-term bottom here. Let us now compare the recent price patterns with long-term tendencies.
From the short-term perspective, things look quite bearish. We’ve seen a significant decline. However, remember that if the long-term picture and the short-term picture are in conflict, the long-term outlook generally wins.
We now will examine previous price patterns to see if we can find one similar to where we are today. We do indeed find this and it is quite exciting! Since the major 2008 bottom, all rallies to major tops corrected approximately 38.2% of the previous rally. Taking the 2008 bottom as our starting point, we have marked the next top as a final destination in the colors of purple, yellow, blue, green and black (now). The patterns do not appear symmetric with respect to time but they are actually quite similar when looking at price levels.
The first, most recent top is seen around the 600 level, the previous close to 500, prior to that 400, several more close to 350 and one near 300. Similarities are certainly in place here since all have corrected 38.2%. Consequently, it could be the case that this recent rally never moved significantly above 600 because it had not properly corrected the move to this level. In this case, a correction to the 450 level would be warranted and had not been seen until Wednesday of this week.
So, what seems bearish for the short term could very well be bullish for the long term and the RSI level confirms that a rally could be in the cards. At this current market juncture, things really appear pretty bad but we believe this reflects negative investor sentiment. The long-term and medium-term bullish case is therefore confirmed.
Furthermore, based on daily closing prices (lower part of the above chart), gold has likely reached its major bottom. Despite the short-term breakdown in the HUI Index and the fear associated with it, the situation actually is bullish right now.
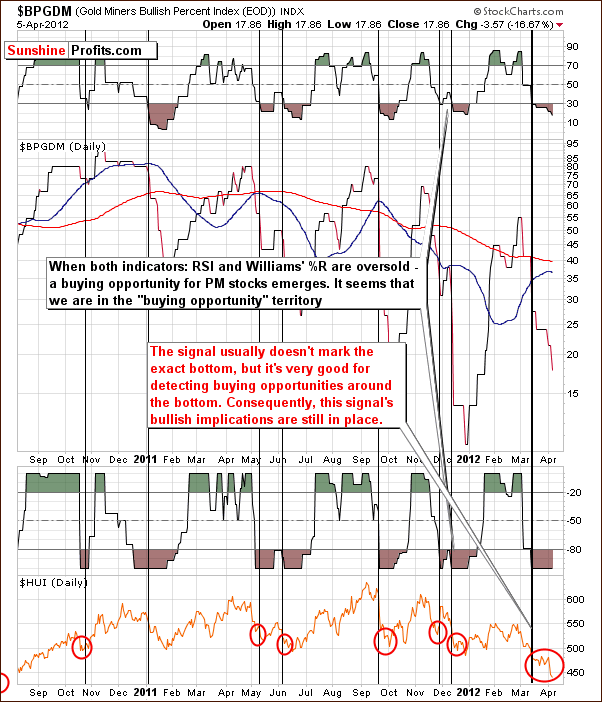
In the Gold Miners Bullish Percent Index chart, both indicators are still confirming the current buying opportunity. While it’s true that gold stocks declined, please keep in mind that that the indicators in this chart signal that a buying opportunity is near and are not to be taken as exact. A good example is seen in the fall of 2011 and a similar trading pattern could develop here as well.
This has been the case now for a couple of weeks and it seems that we could really be right at the optimum buying opportunity now.
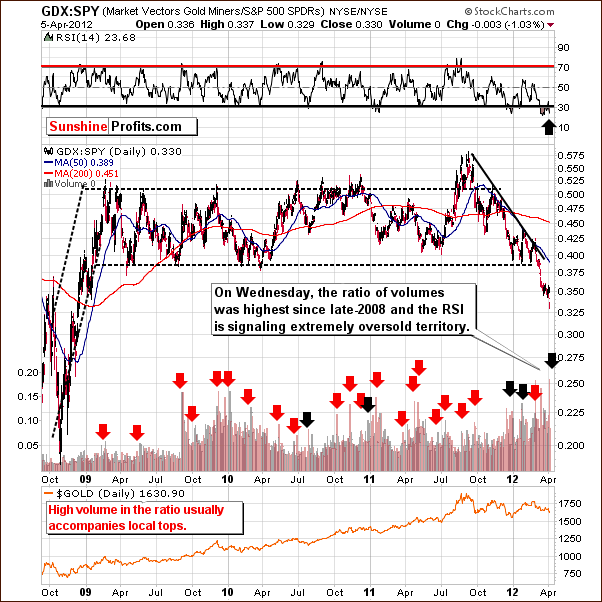
In the GDX:SPY ratio chart in which we monitor spikes in volume to detect local bottoms and tops, we have just seen the biggest volume spike since 2009. This is a big deal. Compared with the previous performance of this ratio (it’s been declining for a few months) and the current RSI level readings (extremely oversold), the implications from this chart are clearly bullish today.
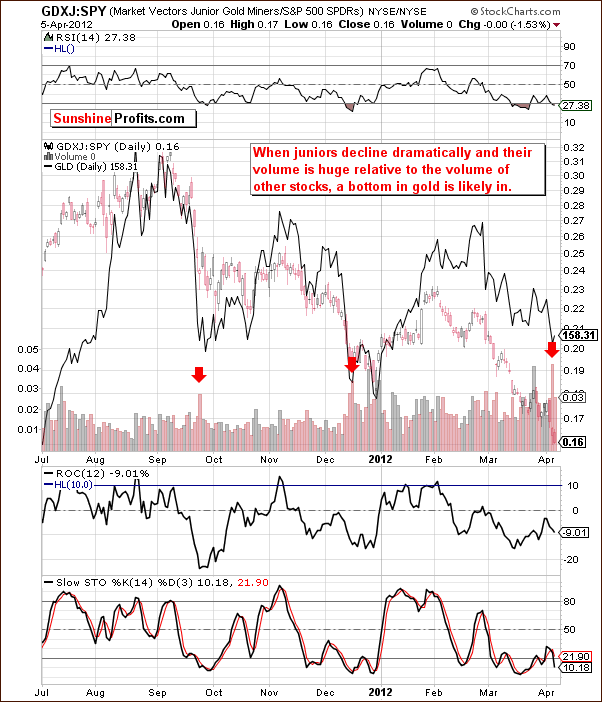
We now examine the performance of junior mining stocks as compared with other stocks. We see that the Junior Gold Miners Index also declined on huge volume relative to other stocks. A similar scenario has been seen twice in the past year and both corresponded to major bottoms in gold. This was seen in late September and mid-December last year and has not been seen since – that is until Wednesday.
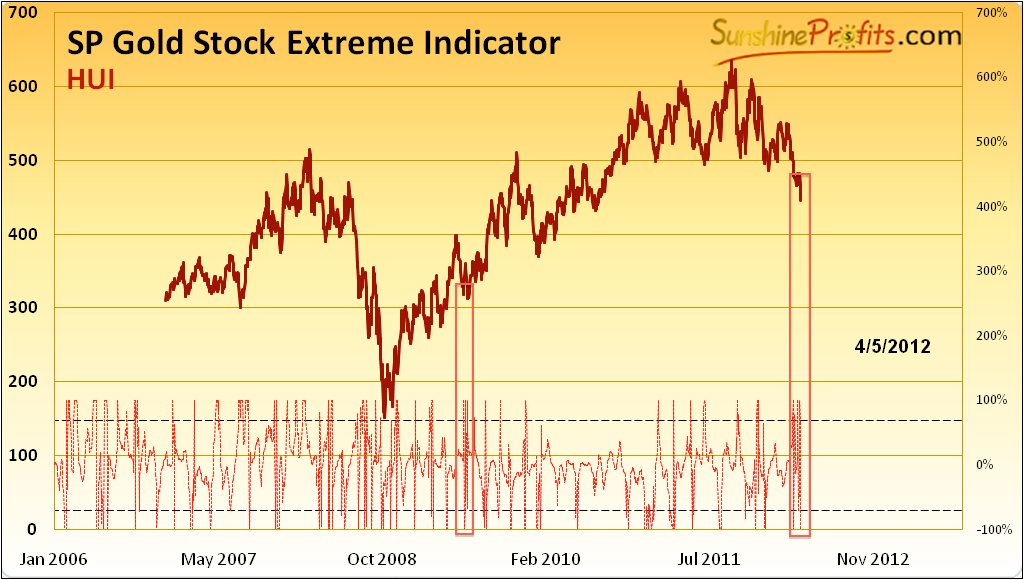
The Sunshine Profit Gold Stock Extreme Indicator (please click the above chart to enlarge) was discussed in Wednesday’s Market Alert:
Based on yesterday's closing price we've seen another signal from our SP Extreme indicator. This is a buy signal in our view, and the fact is that we've seen quite a lot of them from this particular indicator in the past few weeks. This is not something that we see quite often. The last time we've seen so many signals from this indicator was in mid-2009, when HUI moved close to 300 level. Several months later, it topped above 500. If this is to repeat, HUI could top close to 750 in a few months.
Keeping this in mind along with the reliability of this indicator, the picture appears quite bullish indeed.
Summing up, although much has happened this week with the mining stocks and our analysis has been extensive, the overall outlook seems to be best summed up with a short, simple statement:
The outlook for the precious metals mining stocks appears bullish though not at first glance.
Letters from Subscribers
Q: The oldadage says “In May, sell and go away.”Do you think this year we should be more sensitive to the end ofApril and thebeginningof May given what happened last year with the huge drop in silver? Thanks.
A: Last year silver dropped as it had risen very high, very sharply, moving to its previous nominal high. A lot of momentum players entered the market and the sentiment was extremely positive. All that the silver market needed to collapse was a catalyst.
This time, we have a very different situation. Silver has had a lengthy consolidation that took it considerably below its previous high and the sentiment is very bad. We don't expect another significant plunge simply because we have already seen one (actually two of them) last year and the fundamental picture is still favorable.
Moreover, the top was actually often seen close to the end of May, which gives us 2 months before this seasonal tendency really comes into play.
Q: You keep writing that gold has bottomed. This is probably right, but what if gold stays consolidating and we do not see the rally for months?
A: We will keep monitoring the market anyway. When it becomes less likely that a rally will be seen during the next month, we will suggest closing speculative long positions and we will start looking for another entry point for either a long or short position.
Q: I wanted to say thanks. The one thing a person needs above all else, save the advice in the first place, is confidence. When things go crazy, it's nice to have that positive reinforcement. I see all the signs in silver (which is my choice metal). RSI levels are below the 50 mark, approaching 30, and maybe worse after today. The MACD has touched and is leading into an uptrend. The 1-year chart shows a complex head and shoulders bottom with a projected breakout to around $43.66 spot if it breaks past the $37 mark and confirms the pattern.
These patterns also have a 63% throwback rate in a bull market, so this drop is not unexpected, however annoying it is. On top of all that there are the Fibonacci Retracements which will come into play. It has been below the 200-Day MA. So I know that everything is okay. There have to be extenuating circumstances none of us can foresee for things to truly go sour. And despite all that, I can't help but feel a little despairing. Sentiment has definitely hit rock bottom. We've been waiting for this rally for almost eight months. That said, again, thank you. Your midweek emails just to give us some confidence are more important than you might realize. In some ways, they are every bit as important as the premium report itself.
A: Yes, these are scary times and make many experienced investors question the validity of the analysis that worked for them many times in the past. Yet, it is this fear that confirms that the sentiment hit rock bottom and that a bottom is likely in the prices as well.
Q: A prominent precious metals guru recently said that about the only thing that could derail the precious metals bull would be the introduction of a precious metals backed currency (since people would turn to the currency instead of the metal). Other prominent individuals claim a currency backed by precious metals will be introduced in the near future, probably shortly after a dollar devaluation. Do you agree that such a currency would indeed derail the bull? Also do you see a $75 silver top in 2013? Or is that 2014?
A: People turning to the precious metals currency would in fact turn to the metal as the currency would be exchangeable for precious metals. Demand for currency would translate into demand for metals. However, if the price of precious metals was fixed, then naturally, it would not rise. It seems that if that took place, it would need to be connected with much higher gold and silver prices than we have today. Monetary authorities and governments will likely strive to purchase metals with their cash in order to gather significant reserves before making the case for a precious metals backed currency.
Of course, they could confiscate gold and silver, but we believe that purchasing gold and silver is much more likely as it would simply require printing more money. After all, that is how the authorities "deal" with problems right now - by printing money.
Again, keeping your gold and silver in multiple locations and under different jurisdictions appears prudent.
It seems that silver’s $75 target could be reached by 2013.
Q: You have been uncannily accurate so far on silver. You suggest silver will soon surge to $42-$45 and I am sure you will be right again. What are the chances of silver hitting a new all-time high this year, perhaps in November or earlier?
A: Thank you. Based on the information that we have right now, we'd give it an approximate probability of 50%.
Summary
The rally which followed the cyclical turning point in the USD Index likely contributed to the decline seen in the precious metals sector this week. Since a turnaround appears to be just around the corner for the dollar, the same appears to be the case for the precious metals sector as well.
The short-term outlook for the general stock market is a bit unclear but mildly bullish at this time. The link between the precious metals and stocks is also somewhat unclear at this point. All in all, however, the implications seem rather bullish for precious metals.
The outlook for gold remains bullish. Based on closing prices, the long-term support line has been reached. The self-similar pattern discussed for several weeks is still present but somewhat less precise. Other bullish signals have emerged, however, including gold from the perspective of the Japanese yen and the shape of the RSI Indicators based on gold’s price. The chart featuring gold from a non-USD perspective remains bullish, and the fact that gold:bonds ratio did not move below its declining support line also supports the bullish case. All indications are that the bottom is now in for gold and higher prices will be seen soon or is already in.
The situation for silver is similar in that it is closely tied to gold on a short-term basis. The white metal has been forming a double bottom as has been seen many times in the past.
The situation in the precious metals mining stocks is very tense and significant declines were seen this week. However, this slide has allowed a correction of 38.2% of the rally which brought the HUI Index above the 600 level. Since early 2008, each time a major top has formed, a 38.2% correction was seen. This time the correction did not appear… until Wednesday this week. It now seems that a major move higher is likely.
The sentiment among gold and silver investors has been very negative (even your Editor initially thought about sending a “get out” Alert when gold was moving higher on low volume and gold stocks declined) and this is something often seen around major bottoms. It is possible that we could be on the verge of declines much bigger than what has been seen already – something seen in 2008. However, at this time, based on analysis of factors which have been reliable in detecting long-term and short-term bottoms, we do not get this indication.
We will continue to monitor the markets on a daily basis and report to you accordingly. We will inform you if we believe the risk/reward ratio no longer favors long positions from both speculative and investment perspectives. For now, long positions for both the short term and long term appear justified.
Target levels remain as follows: slightly above $1,900 for spot gold, $40 to $45 for spot silver, 550 for the HUI Index, and $55 for the GDX ETF.
This completes this week’s Premium Update. Our next Premium Update is scheduled for Friday, April 13, 2012.
Thank you for using the Premium Service. Wishing you good holidays and a profitable next week!
Przemyslaw Radomski

