
Gold surged to a new record on Wednesday, propelled by the possibility of a third round of quantitative easing in the US. Already rallying hard on the back of fiscal concerns in the Eurozone, gold jumped to within reach of $1,600 an ounce after Fed Chairman Ben Bernanke said the central bank could take further steps to prop up the US economy if needed (read that as QE3). Gold rose as much as 1.4 per cent on Wednesday to touch a new peak of $1,587.46 an ounce. That surpassed the previous peak of $1,575, reached on May 2. Looking back we see that gold rallied about $270 an ounce between Bernanke’s first mention in August of last year of a second round of quantitative easing – or “QE2” – and the end of the program in June.
Every time gold takes off we are asked if it is too late to enter the gold trade. Gold has gone from $300 to well over $1,587 in a decade. That is a 400% gain compared with effectively no gain for the Standard & Poor’s 500 Index (SNC:SPX). Some investors feel that gold is already too high and anyway, how much higher can it go.
Our answer is short and sweet for the long term—higher—much higher.
For those who still have their doubts, we have compiled a list of 10 reasons why we believe gold and silver will vault forward in the long run. Anyone not in a coma can see that from an economic point of view we are living in historic times. Black swans are circling as we grapple with fallout from the all-too-recent meltdown, the ominous and even frightening possibility of sovereign-debt defaults, and political uncertainty across the globe. It is in times such as these that people look for a safe haven, and the one that makes most sense is gold.
So, here is our list, in no particular order.
1. Even at today’s record gold price, gold is still well below its all-time record set in 1980, when adjusted for inflation. The 1980 peak was $873 per ounce. If you adjust that for official inflation gold would be trading today at $2,394 in 2011 dollars. In case of shadowstats.com’s inflation numbers (reported as if it was no change in the way inflation is measured) gold’s high is well over $6,000. So, gold still has much more room to rise.
2. If investors are not already nervous enough, the recent U.S. deficit-reduction debate has surely raised concern about a U.S. default; destruction of the U.S. dollar; and even the possibility of a global recession or depression. Moody’s placed the US triple A rating on review for a possible downgrade as fears mounted that Washington will fail to raise the federal debt ceiling by August 2. The Moody’s warning came as Ben Bernanke issued his most explicit warning yet on what would happen if the debt ceiling is not raised, a recession on the scale of 2008 would be “certainly conceivable” and that it would have “a very adverse effect very quickly on the recovery”. If there is no increase by August 2, the US could only spend incoming revenues, leading to default on some obligations.
3. The euro is an experiment. The currency is only 13-year-old and not issued by a sovereign government. Right now it’s looking more and more like an experiment gone awry; Europe is trapped in its own utopian project. The contagion that started in the Eurozone’s smaller countries is suddenly moving to some of its largest. Greece teeters on the brink of a default, but now investors are spooked by Italy, the next weak link. Is Italy, the Eurozone’s third largest economy, too big to fail? This week Moody’s downgraded Ireland’s credit rating to junk status saying it would probably need additional rounds of official financing. Spreads on Spanish and Italian 10-year bonds over German bonds have reached 328 and 296 basis points, respectively.
4. Recent weak U.S. economic data is raising the possibility of more quantitative-easing programs (QE3) courtesy of the Federal Reserve. This could weaken the dollar and add to gold’s allure. Last week alone, gold prices posted their biggest weekly gain in a year and a half over these concerns.
5. Fourteen million, in round numbers – that is how many Americans are now officially out of work. The United States is in the grips of its gravest jobs crisis since Franklin D. Roosevelt was in the White House. The jobless rate rose to 9.2 percent in June.
6. Currently the U.S. government is supplying about 20 percent of Americans' personal income through jobless benefits, food stamps, Social Security and disability. That figure is even higher in states hit harder by the recession. The problem is that when the government can no longer prop up incomes with benefits, then economic activity contracts and we end up back where we started. Total government benefit payments rose by about 35% from $1.7 trillion in 2007 to $2.3 trillion in 2010. While a lot of that money went to existing programs such as food stamps, a big chunk went to fund emergency programs, such as the one that extended unemployment benefits.
Many of those programs are scheduled to end and with them, so will the economic growth rates they propped up. About $37 billion less will flow into the wallets of Americans this year.
7. Inflation is rearing its ugly head in China and in food prices around the world. That gives support the price of gold as paper assets lose purchasing power. Gold is a hedge against inflation.
8. As we have been reporting, central banks, particularly Russia’s and Mexico’s, have become large buyers of gold and will likely purchase more this year, increasing worldwide demand for the precious metal.
9. Last week we reported about a new gold vending machine in London, which joined those that already operate in Abu Dhabi and Las Vegas. Increased consumer demand will prop gold prices.
10. Financial heavyweights like ex–Fed chief Alan Greenspan, the World Bank’s Robert Zoellick and Nobel Prize winner Robert Mundell have all suggested a more significant role for gold in the global financial system. This adds much respectability and an official stamp of approval to gold as a supplement to paper currencies.
With everything that has happened with precious metals this week, let’s not delay any longer and let’s turn to this week’s technical part with the analysis of the Euro Index. We will start with the long-term chart (charts courtesy by http://stockcharts.com).
Euro - USD Indices
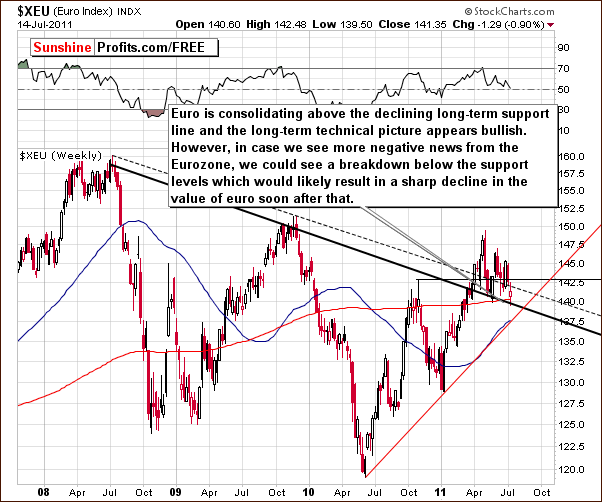
As you may see above, the recent consolidation has taken place above the declining support line – in fact, a decline to this line was just seen. Even though the technical picture is bullish at this point, it may be the case that the final bottom is not yet in, in case we see more significant bearish news coming out of the Eurozone. A breakdown will likely be seen below the support line if additional portion of major bad news is reported. This could lead to serious losses for those holding euros.
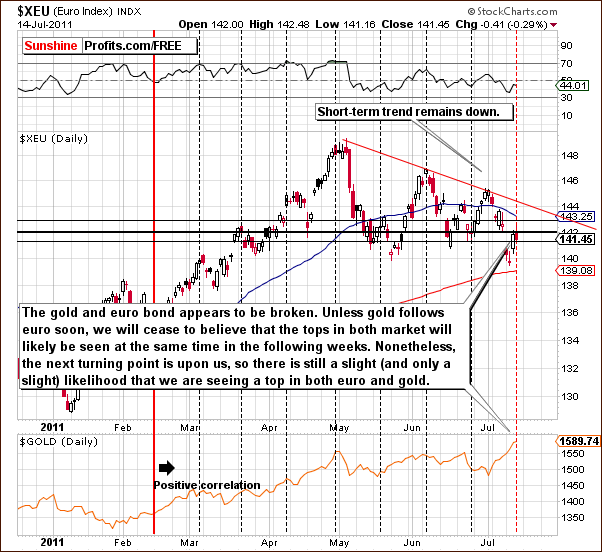
In this week’s short-term Euro Index chart, we have seen a rebound back to the level seen last November. The euro is also at a cyclical turning point and rather likely to decline from here. The cycles have actually lost much of their usefulness but we still show it on our chart just in case. They have not been all that precise recently.
The suggestion here is that the index is at a local top right now and a correction is likely. In the past, tops in the Euro Index coincided with tops in the gold and this may or may not be the case once again. Remember that since the beginning of July, the euro has declined while gold prices have risen. The correlation has pretty much been upside down for the very short term so the coinciding tops theory is somewhat in doubt this time.
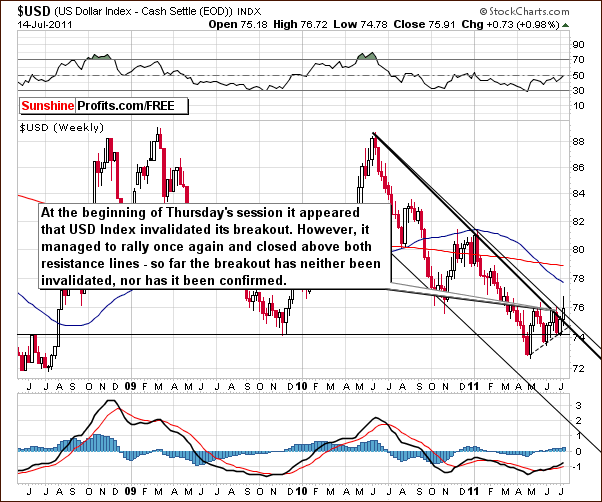
In this week’s long-term USD Index chart, we can see that there has been huge volatility in recent days as index levels moved back and forth above and back into the declining trend channel. On Thursday, we finally saw a close above this level (even though price was ) and the sentiment is therefore slightly bullish. If the index closes the week above the level of the declining trend channel, then the medium term situation will appear to be bullish for the dollar.
Summing up, the situation for the dollar is slightly bullish, whereas the euro situation is mixed though slightly bearish. If more grim news comes out of Europe, the euro is likely to decline, its outlook turn more bearish, and the dollar move higher.
General Stock Market
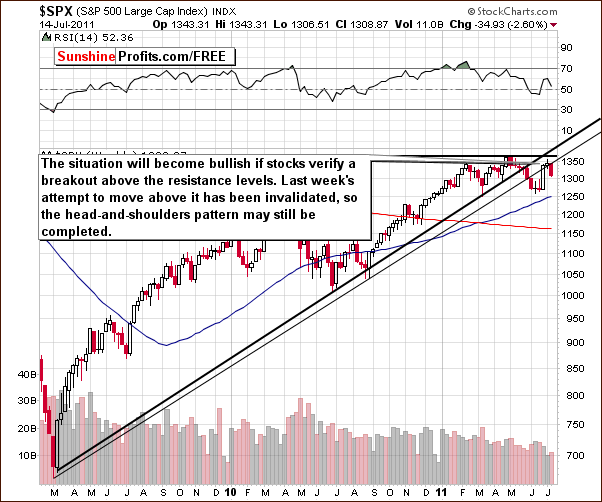
In the medium-term S&P 500 Index chart this week, we see that stocks have reversed after a failed attempt to move back above the rising resistance line. This was followed by a decline last week and another this week as well. In last week’s Premium Updatewe wrote that if stocks decline from here, the possibility of a bearish head-and-shoulders pattern developing will be quite likely. In this scenario it would be quite likely that a decline similar to what was seen in the middle of 2010 takes place.
We have previously seen a number of situations where the bearish head-and-shoulders pattern has been invalidated before forming. Nonetheless, this pattern could very well complete if stocks continued to decline. The result of a head-and-shoulders pattern completion could be much lower S&P 500 levels, possibly to or slightly below 1200. This could approach as much as a 10% decline below levels seen today.
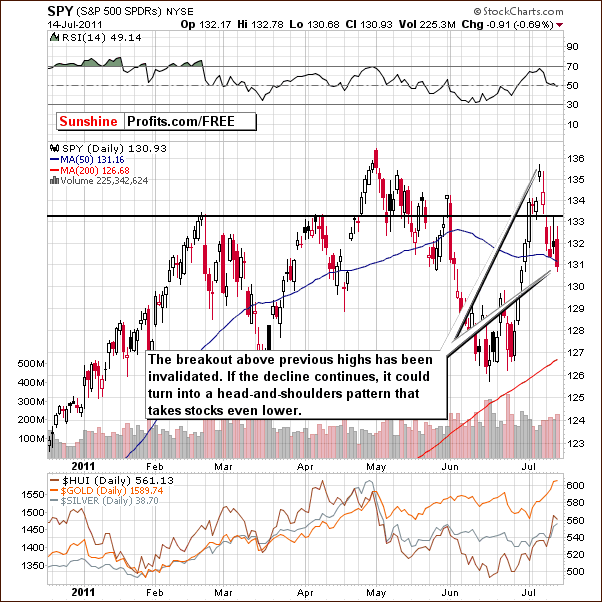
In the short-term SPY ETF chart this week, we see that the breakout above the previous highs has been invalidated. This was tested on an intra-day basis on Wednesday and a decline soon followed. The situation here is therefore bearish for the short term.
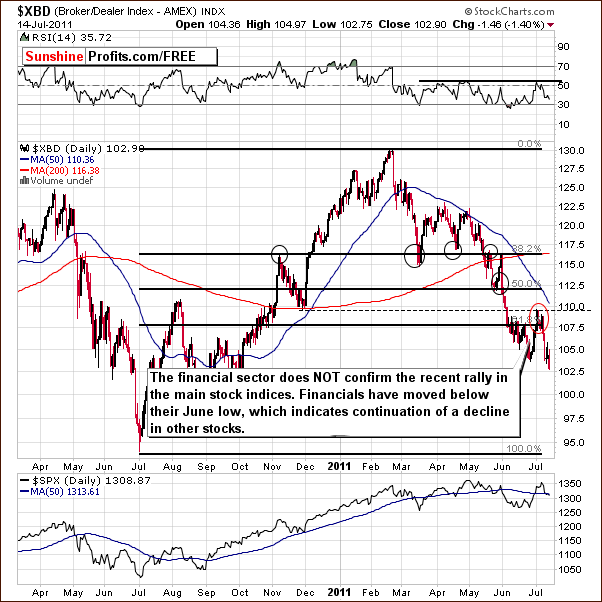
In this week’s XBD Broker-Dealer Index (proxy for the financial sector) chart, we see the index has reached new 2011 lows, moving below the lows seen last month. Since this is a leading indicator for the general stock market, the situation does not look good for stocks in the short term. Lower stock prices are probable based upon this week’s analysis of the financial sector.
Summing up, a number of signs this week consistently point to further declines for stocks in general as being in the cards.
Correlation Matrix
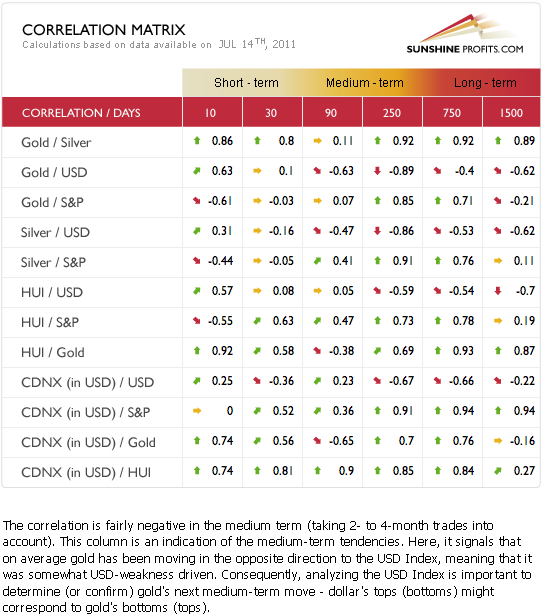
In this week’s Correlation Matrix, the short-term (30 days) column does not yield very much valuable information. There are signs (0.63 correlation between HUI and S&P 500), however, that in the short term, it is unlikely that mining stocks will continue to outperform gold if stocks in general plunge.
In the medium-term column, we see significant negative coefficients for precious metals and the dollar. Therefore if the USD Index confirms its breakout and rallies in the medium term, lower prices will likely be seen for gold and silver over this time frame.
Gold
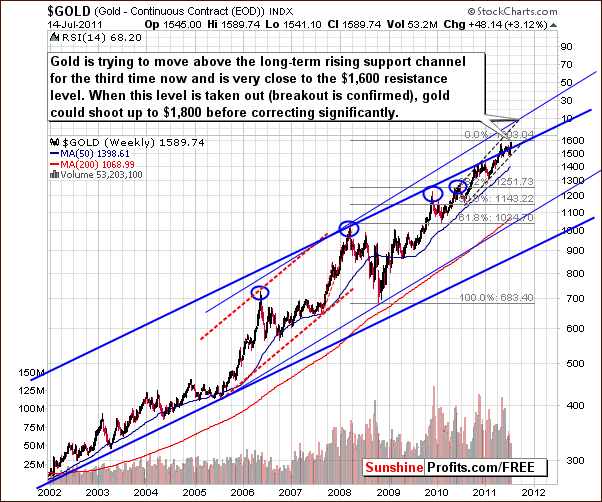
In this week’s very long-term chart for gold, we see a third attempt to move above the long-term rising trend channel. In late 2010, a similar attempt was unsuccessful and was followed by a significant decline. Certainly this could be the case this time as well.
The current momentum which gold has shown seems to make it improbable (rallying on strong volume is bullish phenomenon), however, that it may be a while before any correction is seen. On the other hand, there is a strong resistance level created by extrapolating previous tops and bottoms and using the Phi #1.618. This is just above $1,600. If gold can move above this level and confirm its move, the next target would be in the $1,800 range. This would be quite a rally from here, but such a move does not seem very likely over the next few months – at least not yet.
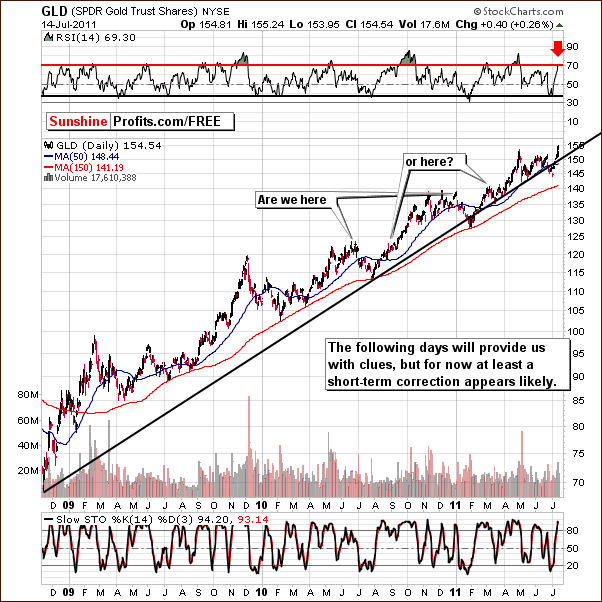
In this week’s long-term GLD ETF chart, we see a very sharp rally in the share price and this caused a similar rally in the RSI. In fact, RSI levels rose in a way which was truly unprecedented as they went directly from buy levels to sell levels. It seems never to have happened this quickly before – at least not in the past few years. Early this year and also in the middle of last year, we saw quick moves up in RSI levels but both times were a slower than this one.
Two similar sets of situations with two similar patterns each are present today. This is somewhat perplexing. Two of the similar patterns point to a decline in price to the level of the 150-day moving average. On the other hand, two additional patterns point to a small correction to be followed by a continuation of the rally. The picture should become clearer in the days ahead and other signals may also give us better insight. We will continue to watch this situation for further clarification and keep you informed and current.
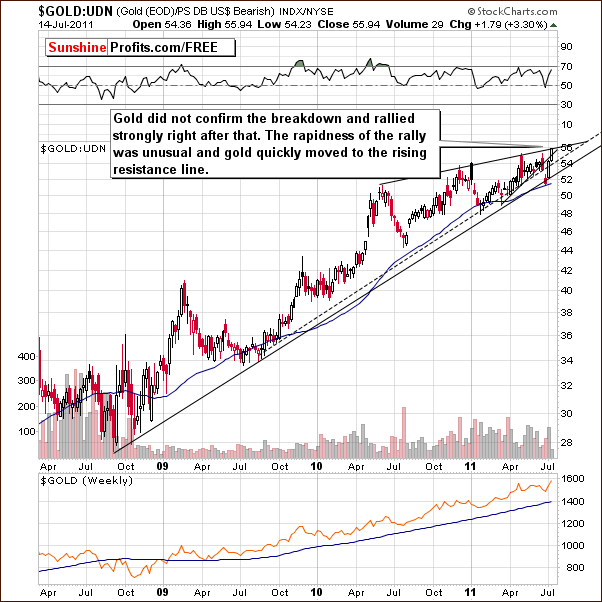
In gold’s long-term chart from a non-USD perspective, we see a sharp rally as well. The index level moved above the support line and to the resistance line based on previous tops thus invalidating the breakdown. The resistance level has been touched and at least a small consolidation appears likely.
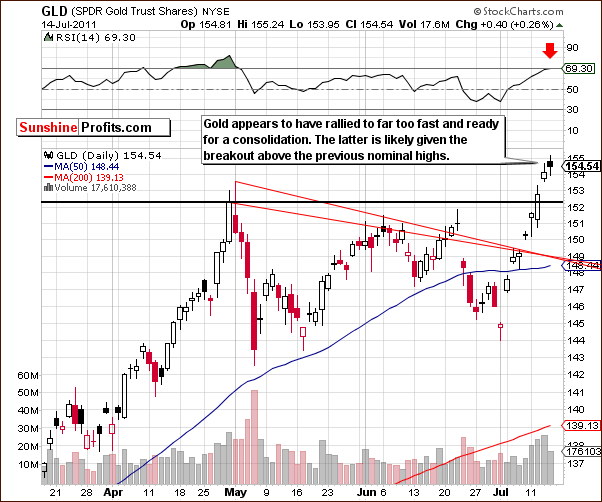
In this week’s short term GLD ETF chart, we see a sell signal based on the RSI at 69.3 at Thursday’s close. Technically, it’s not 70 level which we would view as a classic sell signal, but it’s close enough. We see daily price action with closing prices below the opening price and this is a bearish sign. This was also seen in early June near the beginning of declining prices (note the black candlestick on the chart above).
The situation in the short-term appears somewhat bearish but generally the overall situation is mixed. The candlestick patterns showing daily price action are bearish but strong momentum has been seen during the recent breakout and this is bullish.
Summing up, it seems most likely that a small consolidation will be seen and the way it plays out will determine where gold prices go in the weeks ahead. Quoting from our Market Alert July 14th 2011, a major decline could or could not happen soon, but a short-term correction is quite likely. Unless the decline from here is accompanied by huge volume or any other signal of particular weakness, we will be closing short positions without waiting for a move toward previously mentioned target levels (150-day moving average for gold and $26-$30 range for silver).
Silver
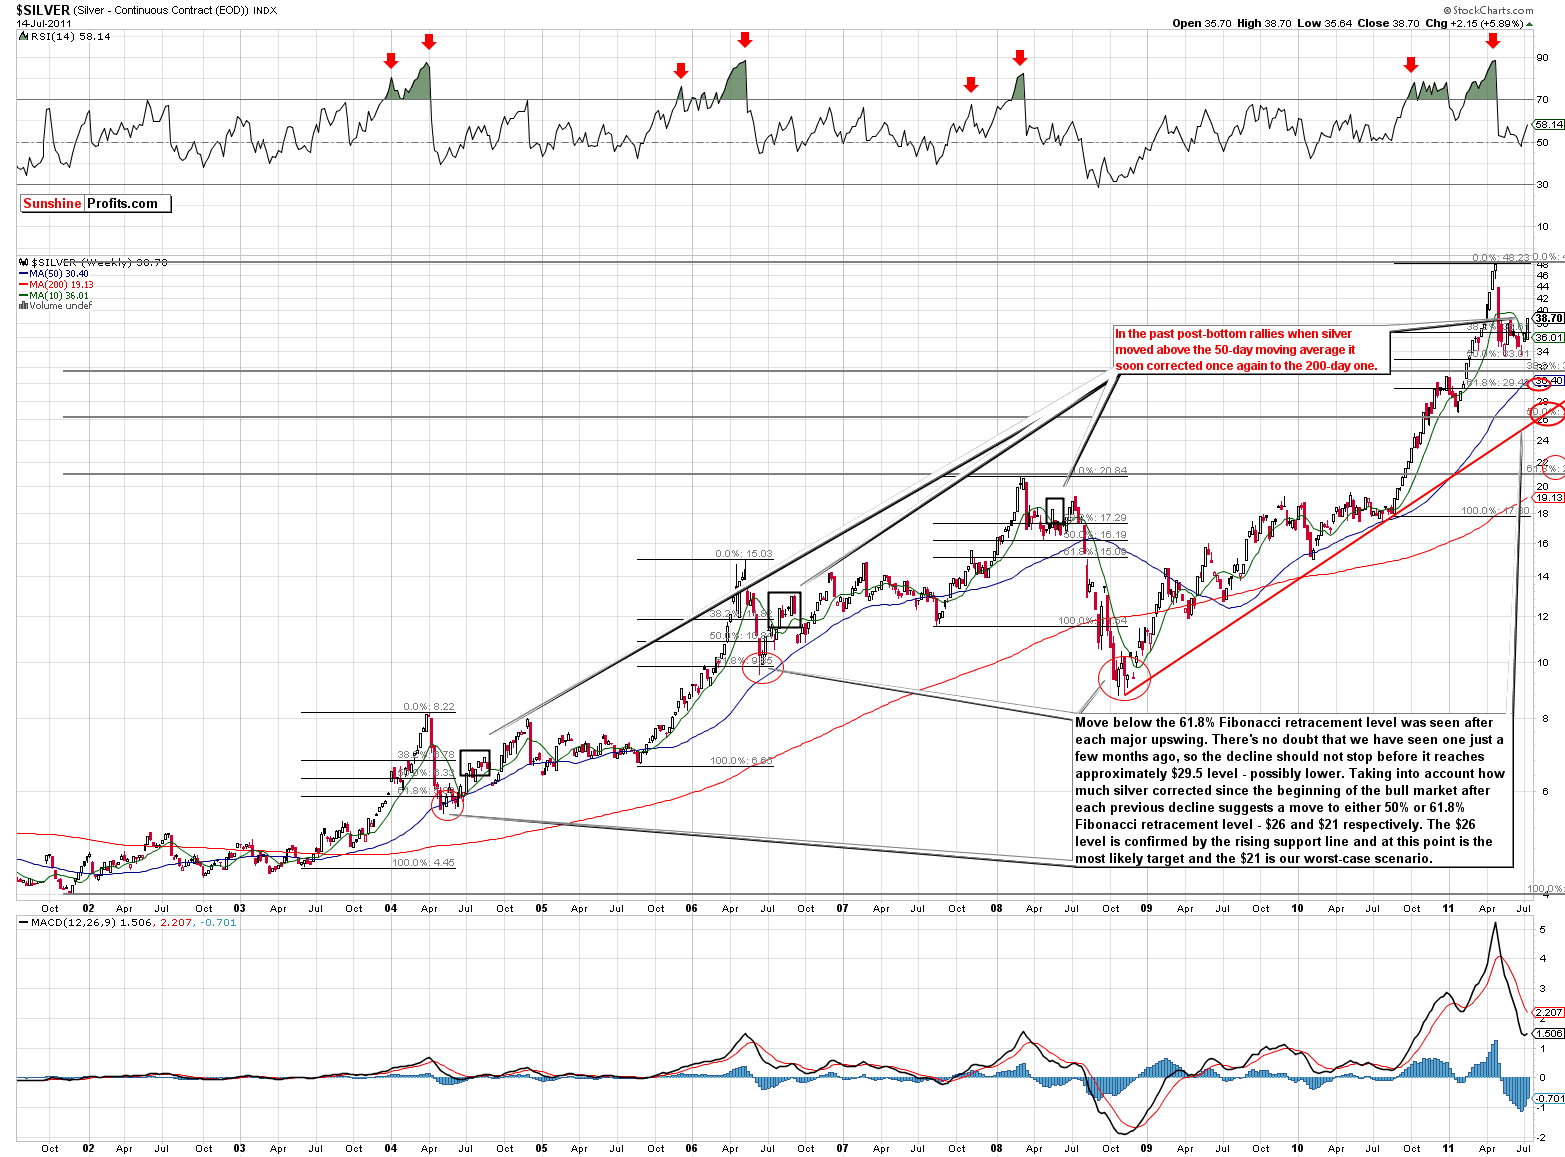
In this week’s very long-term chart for silver (click on the chart to enlarge it), we have seen what could be termed a bull market move, but the performance here is really not close to what has been seen for gold. At this point silver still looks like it’s in the middle of a correction, not at the beginning of another move above previous highs.
Now, there is always the possibility that it is in fact also the early part of a rebound. We’ve marked situations that would confirm this theory with black rectangles. However, please note that after moving above the 50-day moving average, which is also a 10-week moving average, a move back close to the 200-day (40-week moving average) is quite common. Therefore, it still seems that silver will move below its May lows before the next rally truly starts.
We will continue to monitor this in the days ahead and update Investors accordingly.
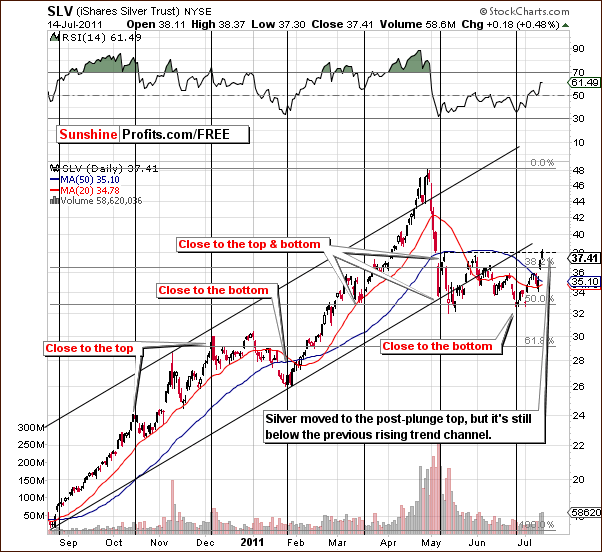
In the short-term SLV ETF chart this week, a significant rally has been seen in the past few days. Prices are still below the rising trend channel and the rally appears to have stopped at the level of the previous local top. At this point we don’t view the decline as being over.
Summing up, the situation for silver is mixed because of the situation in gold, but with a bearish bias for the coming weeks. This outlook is similar to what we see for gold as well.
Gold and Silver Mining Stocks
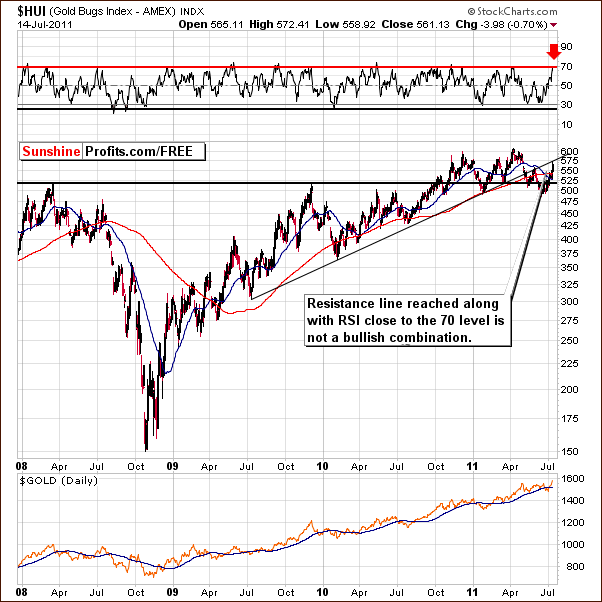
In this week’s HUI Index chart, we see a sell signal based on the RSI which has reached an overbought status. This took place while the HUI Index itself was moving to the rising resistance line. Therefore, a short-term decline in gold mining stocks appears quite likely.
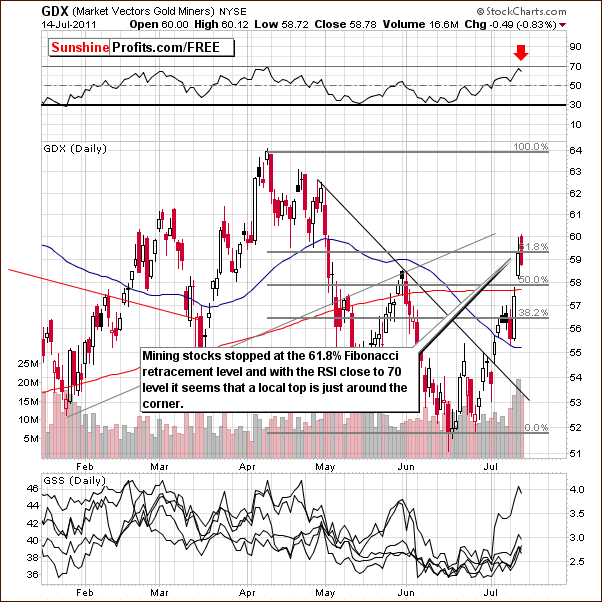
In this week’s short-term GDX ETF chart, the gold miners have corrected 61.8% of the previous decline and therefore the trend remains down unless this level is taken out. Although it is a possibility, indications are that a decline is more likely. This is consistent with the signal received in our analysis of the long-term HUI Index chart.
Another – quite reliable - sell signal comes from the analysis of the Gold Miners Bullish Percent Index.
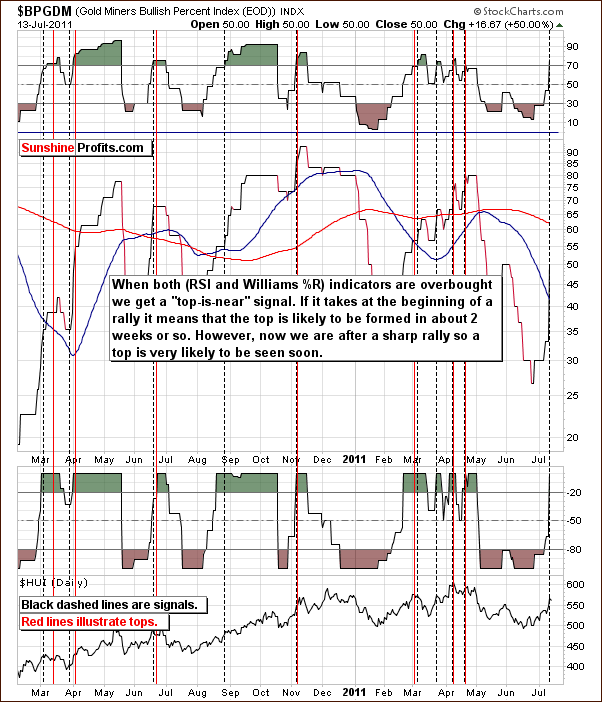
In fact, we see a situation which indicates that a top appears to be quite close. Both the RSI level and Williams %R are overbought here and this has been a reliable tool for predicting local tops in the past few years. Of course, a local top is synonymous with a sell signal for short-term Traders
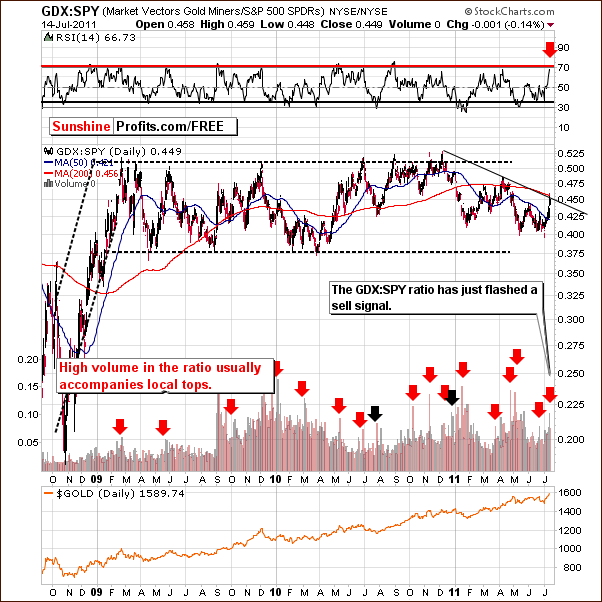
On the GDX:SPY ratio chart, which measures the relative performance of precious metals mining stocks to other stocks, we see another sell signal. It flashed when the ratio of the GDX volume to the SPY volume became huge and resulted in a single spike.
The strength of this signal is stronger if the RSI level is also in an overbought status. The RSI closed just below 67 on Thursday, which is close to the overbought 70 level. So with the RSI fairly high, the declining resistance line in play, and the GDX:SPY volume ratio with a recent single spike, we have three consistent signals that indicate a decline seems to be ahead.
Summing up, gold and silver mining stocks have rallied significantly recently but numerous indicators yield a bearish outlook for the short term.
Letters from Subscribers
In the letters section this week, a Subscriber sent us a link to an article that claims there will be a decline in the price of precious metals in the second half of 2011 and that the proliferation of gold ETFs will make the drop especially violent. The author argues that the recovery will be a long, hard slog over the coming years, rather than runaway growth and inflation or catastrophic collapse. With neither the bulls' nor bears' extreme scenarios proving accurate, the logic behind owning gold seems suspect.
The author concludes that barring a sudden dramatic shift in economic circumstances, such as a strong oil spike or major sovereign default, we favor a drop in gold prices over the coming six months. In looking at the prevalence of investors and the ease of use of gold ETF's, we also expect that any significant sell-off will be particularly strong and violent. We expect to see spot gold trading below $1320 by the end of the year.
Summing up, the author’s three major bearish factors for gold are that the recovery will be a long hard slog, rising interest rates and the rallying of the USD index.
We disagree that the economic situation has become stable and that there will be no extremes. The opening section of today's Premium Update includes 10 reasons why this is not the case. As to interest rates, during the previous precious metals bull market, the interest rates actually followed gold higher for considerable time before the top was reached. In a way, the fact that the rates are not rising suggests that this bull market is far from being over. As to the third argument about the USD index rallying, there have been plenty of times since 2006 when gold moved higher along with the USD Index as it was euro-weakness driven. Consequently, a rising USD does not necessarily have to be a bearish factor for precious metals.
Therefore, we don’t think that gold’s fundamental situation has really deteriorated and we expect the bull market to continue.
One of our Subscribers was confused about the fact that our indicators recently flashed a buy signal while at the same time we were bearish on the market.
The key difference between us and our indicators/tools is objectivity and scope. Our tools and indicators are completely unemotional and objective as they follow one defined algorithm. We, on the other hand, take into account many factors, not just one indicator or tool. And, at the same time, we cannot be 100% unemotional. We strive for that goal as far as our investments are concerned, but we're only humans and even though we can get close to that, we can never become as unemotional as a mechanical tool.
So, we may see a signal from a given tool/indicator but choose not to take it into account based on some factors. At times we will be correct, but at times it turns out that we were incorrect while our tools nailed it. That was the case recently when the SP Gold Bottom Indicator flashed a long-term buy signal right at the bottom.
As Premium Service Subscribers you have access to both - our up-to-date thoughts on the market (Premium Updates / Market Alerts / Messages) and to objective tools (Premium Charts, Premium Tools). It's up to you whether you decide to follow us closely (to the letter) or to have your own trading strategy and simply utilize our unique indicators/tools. Generally, most people start with "to the letter" approach and then make transactions outside our regular Premium Updates, but using our indicators and tools. No wonder - one of them, the SP Gold Stock Extreme indicator, has been 100% correct since 2008.
Our new website will include even easier to use tools and indicators (and more of them with customization options), so you will soon be able to utilize much more objective (and easy to use) tools and indicators in addition to reading our analysis.
The final question (actually a request) that we've received this week was - again - about our indicators.
I don't want golD and the miners running away from me again with me having to play catch up while other investors have already started renewed buying. So this is where your indicators could help. As soon as the relevant indicator starts flashing, please let me know. The small drawdown today may be all we will get! Don't be surprised if this is a 1 day correction! That's why I'll seriously be looking to start to re-enter as soon as tomorrow, (Friday) -I mean that, providing the relevant indicators start flashing after today's setback for the miners. Pleas let me know!
Our comment here is that we already have a notification system about new signals from the Premium Charts section. You'll find it in our RSS feeds section. We realize that not everyone is interested in these signals so we don't send out notifications via e-mail to all Subscribers, but we provide a way to stay up-to-date for those who are interested. Everyone is welcome to sign up for these notifications, however only Premium Subscribers will be able to access the website to see the details.
Summary
The situation in the USD Index this week is quite tense and high volatility has been seen on a daily basis. One positive note is that the outlook appears slightly more bullish than we have seen recently. The euro situation is quite unpredictable due to the grim outlook which appears to exist in several of the Eurozone nations. Any new reports of fiscal or monetary problems will likely cause the Euro Index to decline immediately.
The general stock market situation is quite the opposite of what appears ahead for the dollar. Stocks appear to be in a period of decline and this decline could continue and be significant.
There are no short-term implications of the above for the precious metals sector. In the medium term, however, gold, silver and gold and silver mining stocks are likely to move in the opposite way to the USD Index, should a major move in the latter materialize. It appears that the decline will eventually happen given the time of year, silver’s (lack of significant) correction, and additional signals from other markets. At this time, however, only a short-term decline is very probable.
There are a number of implications for short-term Traders from the Gold Miners Bullish Percent Index, the GDX:SPY ratio, and the RSI indicator based on gold and gold stocks. It seems that given the sharp rally of the past two weeks, short-term declines are now likely. Based on the way in which these declines eventually play out, our estimates about the next rally or decline will be forthcoming. We will keep you up to date as always once more information is available.
Our next Premium Update is scheduled for Friday, July 22, 2011.
This completes this week's Premium Update.
Thank you for using the Premium Service. Have a great weekend and profitable week!
Sincerely,
Przemyslaw Radomski

