
Being technical analysts is one of our professions, so it is quite rarely when we feel any emotions regarding the market regardless if we’re making substantial gains or if we’re on the losing side. But, off the record, we will admit to a slight twinge of a thrill when gold broke the psychological barrier of $1,600 an ounce this Monday.
Putting aside the discussion on whether a breakout or is likely to happen or not, it’s a great feeling having a front-row seat to the greatest investment show in town. And the best part is that it’s still Off Broadway and the crowds haven’t yet discovered it, so there is still time to get good seats.
How many of you remember the feeling when gold broke above $400 in December of 2003? Perhaps not all of you were in the gold trade at that time. So, let’s jump forward to March 13th, 2008 when the benchmark gold contract traded over $1,000 for the first time in the U.S. futures market. The $1,000 mark—that was a big one!
We remember other landmarks on gold’s upward journey. On December 1, 2009 - Gold climbs above $1,200 an ounce for the first time as the dollar dropped. On September 27 of that year, spot gold prices vaulted to the $1,300 an ounce mark. Just two months later, on November 8, gold prices broke through the $1,400 an ounce mark as haven buying prompted by renewed budget problems in Ireland more than offset a sharp dollar bounce. It wasn’t so long ago that gold shot up above $1,500 an ounce on April 20th of this year as worries over the health of the global economy boosted the metal as a safe haven. And that brings us back to that lovely round number, $1600, achieved this week.
Gold futures have risen from $1,478.30 per ounce on July 1st to $1,607.90 per ounce at the close of business on July 18th. The move higher in gold represents a net positive 8.76% gain in the price of gold in the past 17 days. In addition, gold futures have tested recent highs and broken out to the upside. Silver has also been on a tear higher. Silver futures have rallied from $33.47 per ounce on July 1st to as high as $40.88 on July 19th. The change in price represents a net 22.14% gain in less than 3 weeks.
However, were there no corrections along the way? Of course, we have seen many declines. So far gold has been climbing despite the fact that it is supposed to take a respite in the summer as politicians on both sides of the Atlantic appeared no closer to resolving their respective debt problems.
There is distrust of the political process in the U.S. where politicians are Dancing on the (debt) Ceiling, as the Lionel Ritchie song goes. Negotiations to raise the U.S. borrowing limit have continued to show little signs of progress, even as ratings agencies warn that a delay in payments to creditors would jeopardize the country's sterling credit rating. The Treasury Department has said that Congress must raise the U.S. debt limit before Aug. 2 to meet all of its obligations to creditors. There is also some conjecture about a third round of quantitative easing in the U.S. if economic conditions remain weak, although Federal Reserve Chairman Ben Bernanke commented last week that policy-makers are not ready to act at this time. President Obama’s 50th birthday is coming up and if you’re wondering what to get him, he could use about $14 trillion.
And then there is the euro zone watch. The cost of insuring the sovereign debt of Italy, Spain, Ireland, Portugal and Greece all rose Monday, a sign that investor concerns didn't disappear following Friday's announcement of the results of stress tests on European banks. Most banks passed the tests, which were designed to gauge bank performance should European economic conditions worsen. But market watchers said they may not have been strenuous enough to be an accurate gauge of the perilous state of European financial markets. Yesterday European leaders agreed to reduce Greece’s debt burden in a last-ditch effort to preserve the euro and stem a broader financial panic. The pact is part of a rescue package of 109 billion euros, or $157 billion, for Greece, the most troubled economy in the euro zone. It will force many investors in Greek debt to accept some losses on their bonds. (No big surprise there.) The deal would also provide substantial debt relief for Ireland and Portugal. And by giving the main European rescue fund increased powers to assist countries that have not been bailed out — like Spain and Italy — leaders are betting that the program, described by some as a new Marshall Plan for Europe, will serve as a firewall against the contagion that has threatened to engulf some of the region’s largest economies.
It will be interesting to see how German and French citizens will react to the proposal. One thing that is clear is that today’s young generation will have to pay the bill.
Writing in the New York Times, columnist Thomas Friedman wrote that the younger generations on both sides of the Atlantic feel that the Baby Boomer Generation went on a binge and has left them holding the bag. He wrote, about a powerful sense that the generation that came of age in the last 50 years, my generation, will be remembered most for the incredible bounty and freedom it received from its parents and the incredible debt burden and constraints it left on its kids. If there is a pie, the older generation ate it all and those coming of age now will not get a bite, only the bill.
These are some of the reasons that the amount of gold held by exchange-traded funds, popular tools for investors to gain exposure to gold, reached a record high Friday at 2156.4 metric tons, according to Barclays Capital.
We expect that Republicans and Democrats eventually will strike some kind of debt-ceiling agreement to avoid default, although it probably will not happen until the last moment due to the political posturing. When that happens, there might be an additional correction in gold.
Nothing goes up in a straight line. After such stunning gains over the last few weeks gold needs a rest. Any pull back could be a great buying opportunity for us. All we have to do is make sure we have freed-up capital to buy precious metals when they correct. We sent a Market Alert yesterday saying that while gold moved lower at first on Tuesday and higher on Wednesday, that this is not necessarily the correction that we have been expecting to see. The volume was much higher during the decline than it was during the following upswing - and we would expect to see quite the opposite during a corrective move that signals further rallies. What we have seen in the past two days is in fact rather bearish. The same can be said about silver and mining stocks, which makes this analysis more meaningful.
Dennis Gartman wrote recently in the Gartman letter: Eventually there will be a massive crack in gold and silver. There always is and there always shall be. We have the ‘ammunition’ to act when the firing starts; that is, we’ll have the ability to buy gold when it breaks….A correction of serious consequence is coming. We are prepared for it.
We aim to be well prepared, so let's begin this week's technical part with the analysis of the currency indices. We will start with the Euro Index chart (charts courtesy by http://stockcharts.com.)
Euro - USD Indices
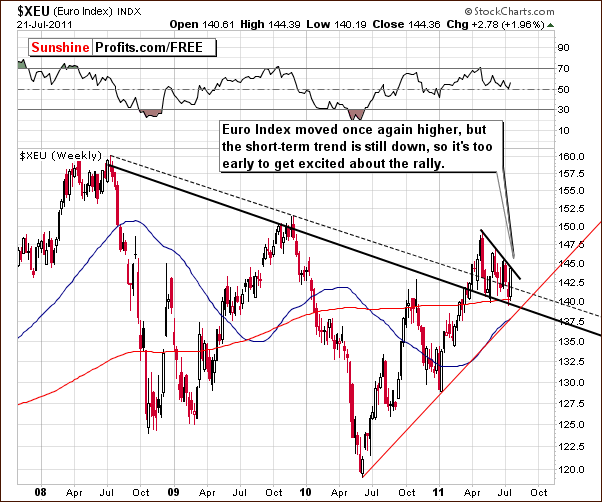
In this week’s long-term Euro Index chart, we see that there has been a rather impressive rally this week, but this has been seen only on a day-to-day basis. For this reason, it is important to note that the short-term trend still remains down. Index levels stopped at the declining resistance line created by recent highs. So although the situation appears to have changed, it really has not and lower values are therefore still quite possible.
In order for the situation to change to bullish, a breakout above current levels needs to be seen. In addition, a further move above the 145 level would make the following rally a bit more probable – the outlook would change from short-term bearish to bullish.
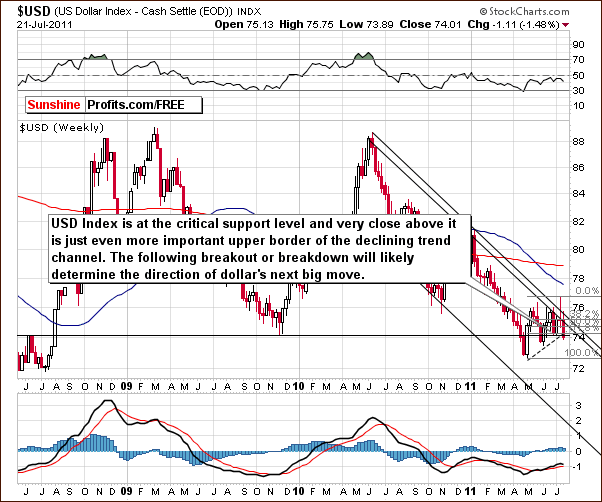
In this week’s long-term USD Index chart, the situation is, as is usually the case, the opposite of what was seen for the euro. The dollar is presently at several important support levels. The first is a support line created by recent lows and the other is by the 61.8% Fibonacci retracement level of the rally from the late-April low to the early-July high seen this year. This is approximately where the USD Index closed on Thursday. The USD Index is also quite close to the bottom seen in November 2009 which is an important support level.
Finally, there is an important resistance level just above where we see the index today, that being the upper border of the declining trend channel. The result of these numerous support and resistance lines being in play makes the next big move for the dollar both difficult and extremely important.
Summing up, the short- and medium-term directions of the currency markets will likely be decided by the next move in the USD Index. Whether it turns out to be a breakout or a breakdown from here will likely determine the direction of dollar’s next big move.
General Stock Market
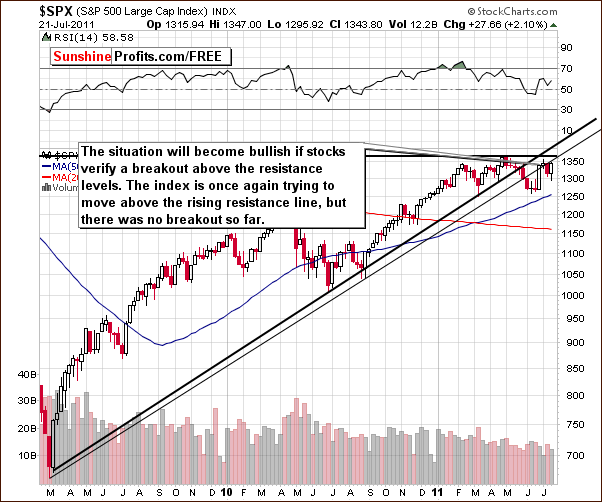
In the medium-term S&P 500 Index chart this week, we have seen quite a bullish performance in the daily price action. However, the rally which was seen mostly on Wednesday and Thursday did not surpass the long-term resistance line. For this reason, the situation does not yet seem to be overly bullish. There are some indications, however, that a breakout could indeed be seen rather soon and a look at the financials will in all likelihood make this possibility a bit clearer to you.
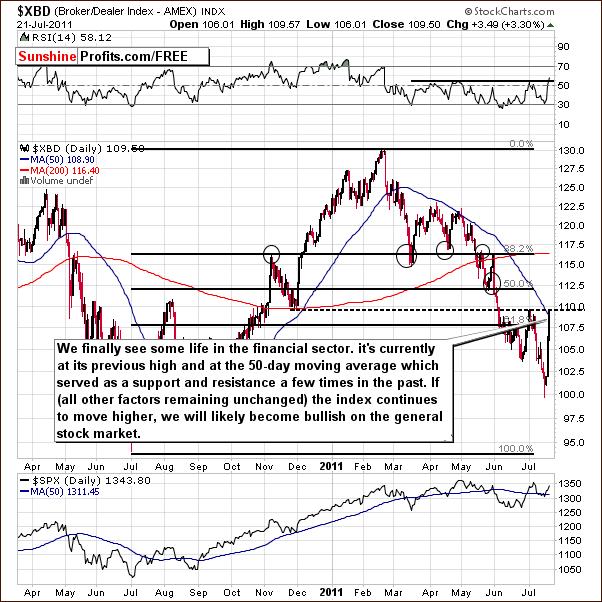
In this week’s Broker-Dealer Index chart, we see a rather dramatic turnaround compared to its very poor performance in recent weeks. The financials have for some time pointed to likely declines in the general stock market based on their history as a leading indicator of stock market trends. This week, however, they have rallied sharply and this could be an indication of significant strength and a very positive sign for stocks in general.
It seems prudent at this time to see additional gains here (perhaps a move above previous highs) before getting caught up in an overly bullish outlook. A continuation of strong performance in the week ahead will likely strengthen this positive outlook. Whatever happens, the situation for the financials certainly appears less bearish now than it has for some time.
Summing up, the general outlook for stocks based on their performance this week and the liveliness seen in the financial sector appears less bearish than in the previous week. The continuation of the price action seen this week will bode well for the short and medium term if it continues in the week ahead. However, this is not yet the likely outcome, as stocks have not moved above their important long-term resistance line.
Correlation Matrix
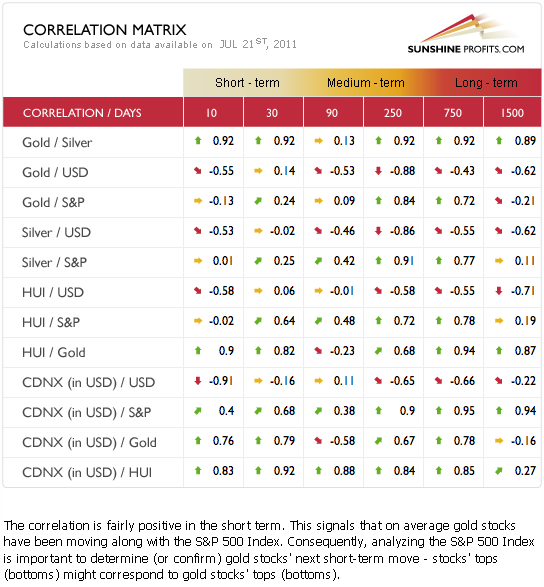
In this week’s Correlation Matrix, the short-term 10- and 30-day columns are the only ones truly affected by the previous information in this week’s update. If the general stock market and the gold and silver mining stocks continue to rally, the outperformance of the latter to gold and silver will likely continue. If stocks decline however, gold and silver will then be quite likely to outperform their respective mining stocks.
In the medium-term 90 and 250 day columns, the coefficients have weakened somewhat. Few of the coefficients are in the 0.7 or higher range (or -0.7 or lower). Values within the range of -0.7 to 0.7 are generally considered to be less important than are the extreme values much closer to 1 or -1.
If a major (!) rally or decline is seen in the USD Index, it will likely have a reverse effect on gold. We would like however, wait to see a confirmation of that since the relationship between the currency markets and gold has been somewhat upside down in recent weeks. This has been primarily due to the situation in Europe. It seems that European purchases of gold in euros resulted in higher gold prices without a substantial decline in USD.
If a decline is seen in the USD Index, the Euro Index would likely move higher and lower gold prices could result if the unusual patterns seen in recent weeks (sharp rally of gold without dollar’s decline) were to repeat. However, at this point the Correlation Matrix does not signal this. We will keep an eye out for any changes in these trends and communicate all important developments to our Subscribers in a timely manner.
With many of the values in this week’s table at rather insignificant levels, it seems that the most important part of the analysis will come from the precious metals themselves. So, let’s take a look at the yellow metal.
Gold
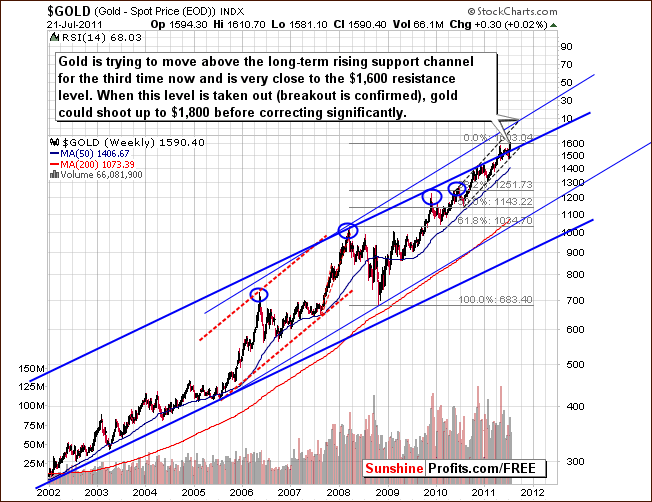
In this week’s very-long-term chart for gold, we barely see any changes. Gold has moved right to the resistance level created by extrapolating previous tops and bottoms. As we stated in the last week’s Premium Update:
The current momentum which gold has shown seems to make it improbable (rallying on strong volume is bullish phenomenon), however, that it may be a while before any correction is seen. On the other hand, there is a strong resistance level created by extrapolating previous tops and bottoms and using the Phi #1.618. This is just above $1,600. If gold can move above this level and confirm its move, the next target would be in the $1,800 range. This would be quite a rally from here, but such a move does not seem very likely over the next few months – at least not yet.
This week we did see prices reverse slightly and they are now consolidating. No breakout has yet been seen and our previous comments remain up-to-date. The situation continues to be quite similar to what we saw late last year (triple top) and it is clear that the consolidation at that time was quickly followed by a decline.
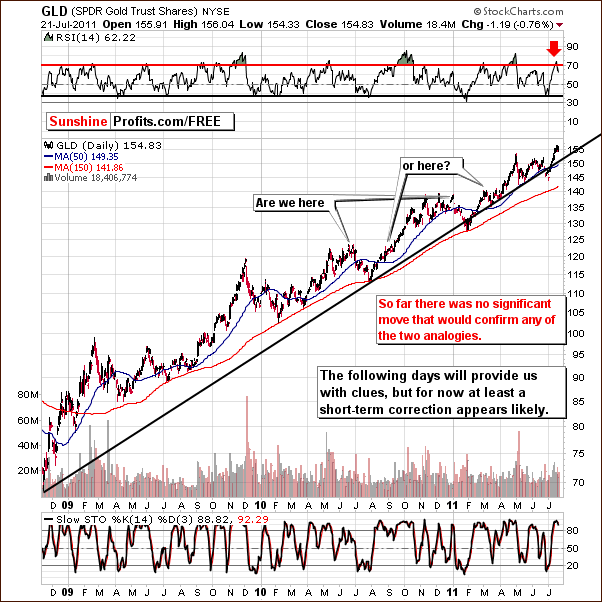
In this week’s long-term GLD ETF chart, the situation remains somewhat unclear with the two possibilities discussed last week still on the table. You may recall that we stated the two possibilities to be a decline to the 50-day moving average or a small correction to be followed by a rally. Either way, at least a short-term correction still appears likely but what we have seen to this point is not enough to allow for a valid comparison to any particular point in the past and thus the correction does not appear to be over. It is simply a tough call at this time to identify which previous pattern is most likely to be repeated. The jury remains out and we will continue to monitor this situation and report to you accordingly.
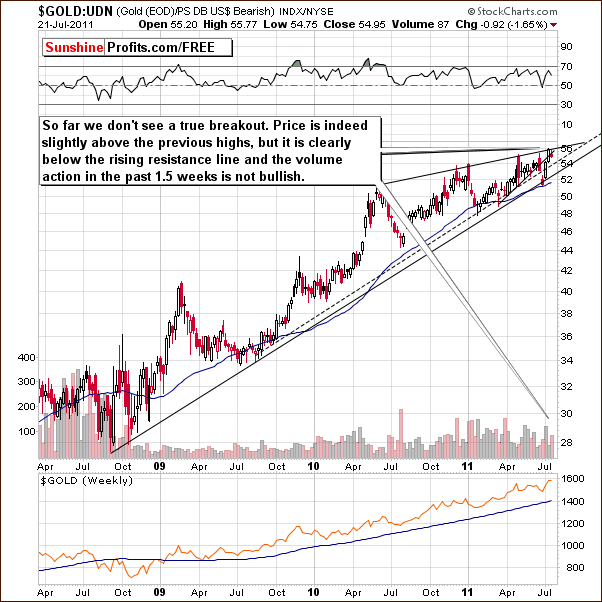
In gold’s long-term chart from a non-USD perspective, we have seen a pause as the recent rally reached the resistance level created by previous tops. We have not seen a breakout and the recent volume levels have been somewhat bearish. Last week, gold prices rallied on low volume levels and this week we have seen declines on greater volume. This is a bearish development and when considered along with the pending resistance line, another rally from here is not a very likely scenario.
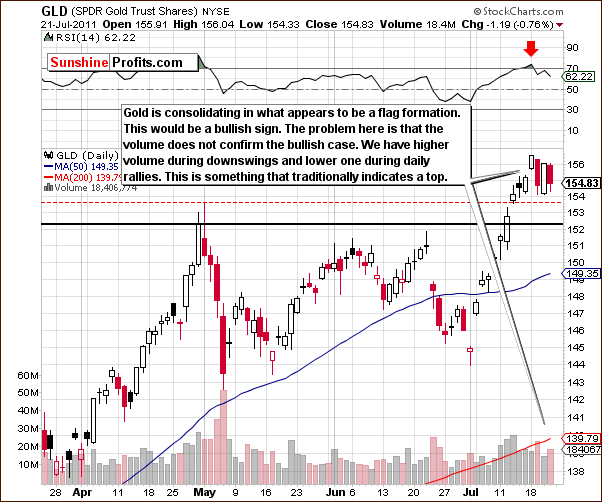
In this week’s short term GLD ETF chart, we see that some consolidation has indeed been taking place. As we discussed in yesterday’s message, volume levels have not been confirming the bullishness of this consolidation. Declining prices have been accompanied by higher volume as compared to the volume levels seen with rising prices. This was also clearly seen in Monday’s top. In short, the recent price action looks more like a top than like a continuation flag pattern.
Summing up, not much change was seen this week in gold’s performance. Price levels are close to where they were a week ago and although there has been a brief consolidation, we have not yet seen what we have been expecting. The situation is not in tune with previous periods of consolidation and declines in terms of size yet. We simply must wait a bit longer to see how it all plays out with the decline being more probable. In other words, the situation is more short-term bearish than not and only a confirmed breakout above the $1, 603 level will change our sentiment to bullish.
Silver
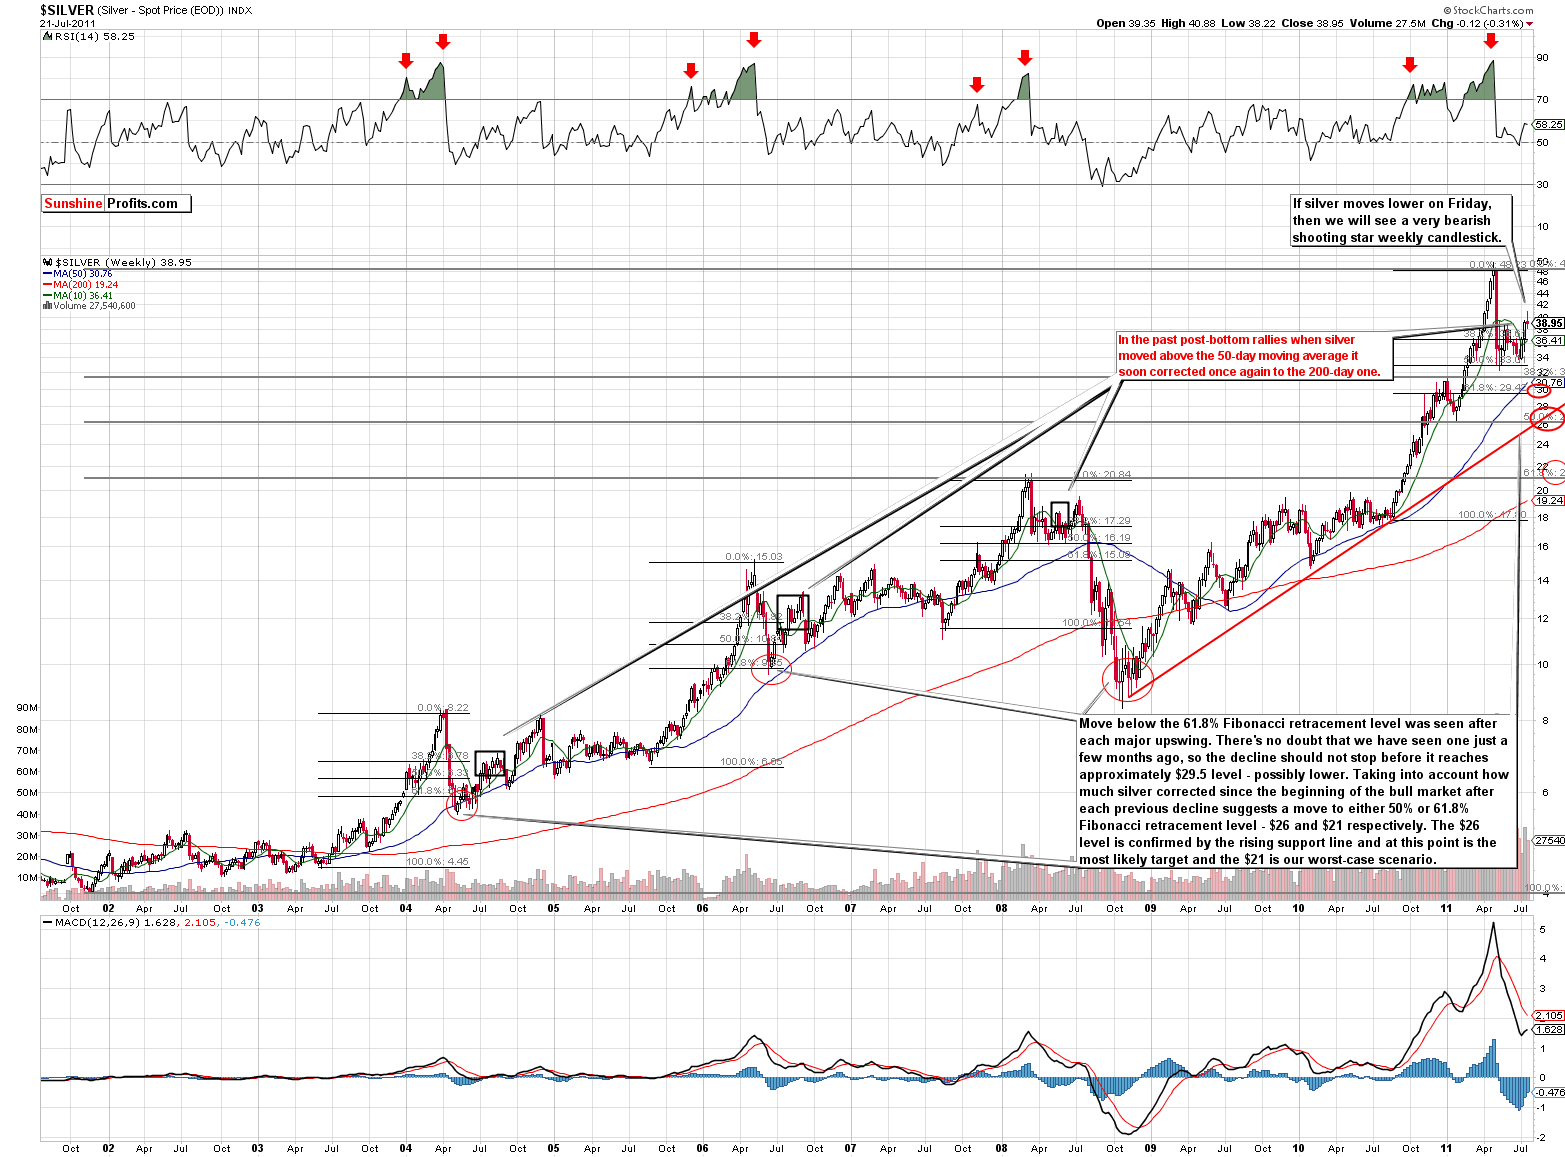
In this week’s very long-term chart for silver (please click the above chart to enlarge), we have seen much higher prices followed by a slight decline. In a new development, there’s a good possibility that we’ll going to see a bearish shooting star candlestick pattern based on weekly prices if silver’s price declines on Friday. This pattern – especially when based upon weekly closing prices – is an important reversal sign. The odds of this happening appear to be fairly high. The situation therefore appears short-term bearish at this time.
Speaking of short term, let’s take a look at the chart below:
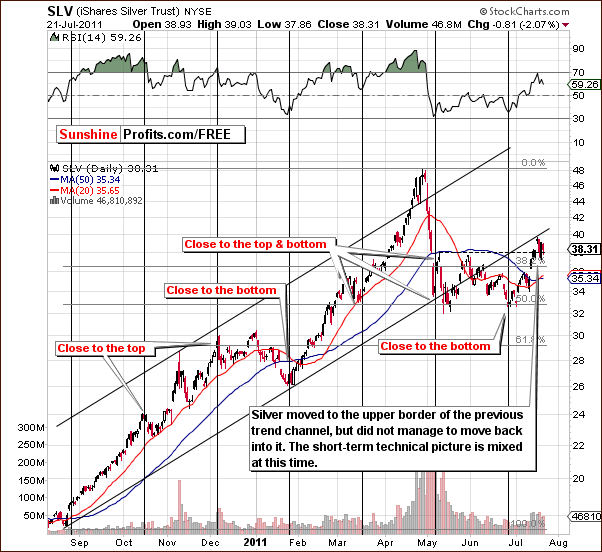
In the short-term SLV ETF chart this week, prices have moved to the previously broken rising trend line. Prices did not move above the line (bearish sign) but have consolidating in a manner similar to what has been seen in the gold market this week. The late May highs have been surpassed and this is a bullish sign. The technical picture therefore appears mixed for the short term.
Summing up, the overall situation for silver appears rather bearish when both: the weekly candlestick pattern possibility and the short-term chart itself are considered. This is a rather bearish combination especially in conjunction with the present outlook for gold.
Gold and Silver Mining Stocks
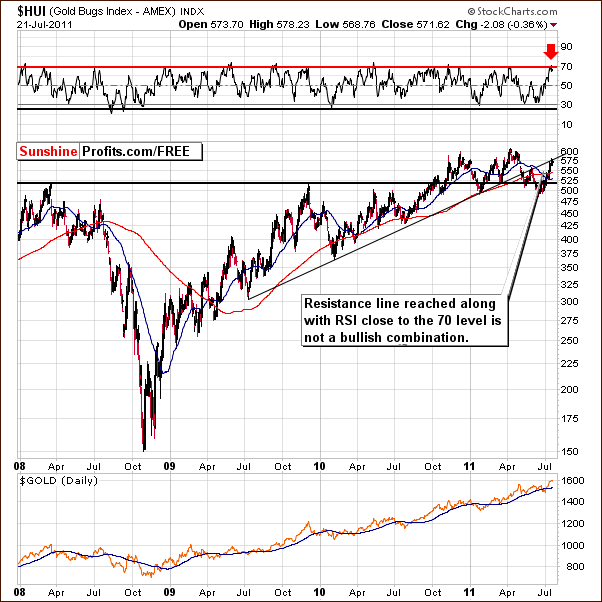
In this week’s HUI Index chart, little has changed and the chart is basically the same as what we presented to you last week. We continue to see a sell signal from the RSI level and the index level is at a noteworthy resistance line. No significant decline has been seen yet but it does appear to be quite likely in the near future.
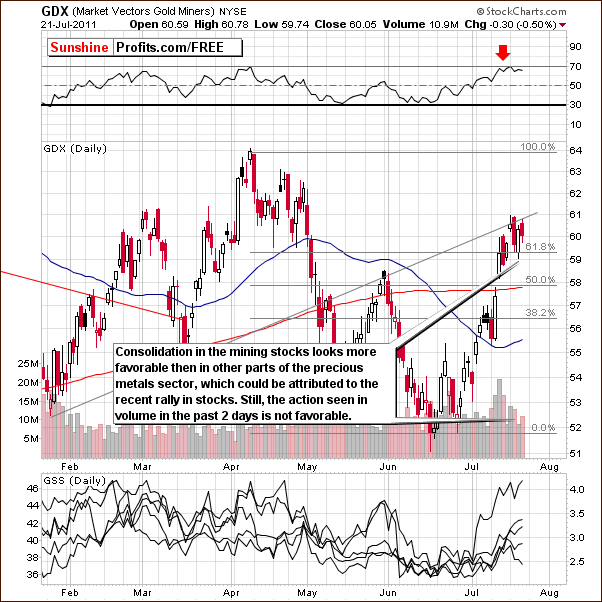
In this week’s short-term GDX ETF chart, we see more of the same, although the situation is a bit more bullish here. A recent consolidation resulted in a bit higher mining stocks’ prices than it was the case with the underlying metals.
Thursday’s decline was less significant here than were the declines for gold. The volume action seen was not too bullish however. The price decline on Thursday was accompanied by higher volume than was seen in Wednesday’s rally. It is possible that the sign of strength seen here is at least partly attributable to the recent rally in the general stock market.
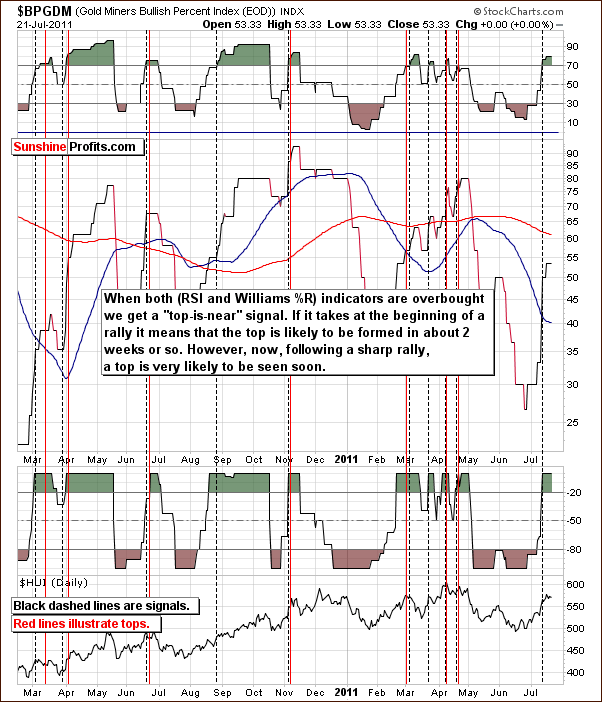
In the Gold Miner’s Bullish Percent Index, we still see the overbought signals which were in place last week. The RSI and the Williams %R continue to warn that the top is near. At least a short-term correction is likely based on this information.
As a reminder, the above index is a market breadth/momentum indicator that is calculated by dividing two numbers: the amount of gold stocks on the buy signal (according to the point and figure chart, which emphasizes strong moves while ignoring small ones) and the amount of all gold stocks in the sector). After analyzing this index thoroughly we found that one of the best ways to approach it is to use RSI and Williams %R indicators – when both are overbought then a local top is likely to be seen soon – which is the situation today.
Summing up, the general stock market will likely have a considerable impact on whether gold and silver mining stocks underperform or outperform the precious metals in the days ahead. At this point, the trend for stocks remains down but some signs have been seen to indicate that the situation could turn bullish (miners’ relative performance to metals during this week’s consolidation). There are some mixed signals and it appears best to analyze gold and silver mining stocks by looking at the underlying metals. The situation, therefore, appears to be short term bearish there as well.
Letters from Subscribers
One of our Subscribers sent us an opinion rather than a question, but we include it here for the benefit of those who would like to learn more about technical analysis. At first it might not make any sense, but please bear with us for a few sentences and it will get cleared up. Malcolm writes that “The key is to be absolutely open and honest and use the Andrew’s Pitchforks, and if possible, confirm with the Ichimoku. That is my opinion for what it is worth.”
Andrew’s Pitchforks is a technical indicator that uses three parallel trendlines to identify possible levels of support and resistance. The trendlines are created by placing three points at the end of identified trends. This is usually achieved by placing the points in three consecutive peaks or troughs. Once the points have been placed, a straight line is drawn from the first point that intersects the midpoint of the other two.
The Ichimoku Cloud is a versatile indicator that defines support and resistance, identifies trend direction, gauges momentum and provides trading signals.(In Japanese the name of this indicator translates into "one look equilibrium chart".) With one look, analysts can identify the trend and look for potential signals within that trend.
Our comment is that Andrew’s Pitchforks is a way to draw trend channels (support and resistance lines) in a slightly different way than we do by connecting the local bottoms or tops. We believe that by doing the latter we can create more accurate targets, so it seems that adding Andrew’s Pitchforks into our arsenal doesn't provide much additional gain, as it is just a slightly different way of doing what we do anyway. Naturally, you can use it along with our analysis or utilize it in any other way – it’s perfectly fine with us.
Similarly, the Ichimoku Clouds are another way to approach the moving averages. Again, moving averages is something that we have been using ourselves and we believe that this way of "slicing the data" is already being taken care of. By using both moving averages directly and through Ichimoku techniques, we would be doubling the emphasis for this particular approach (and thus giving relatively less weight to trends, indicators and cycles). Similarly to the case with Andrew’s Pitchforks, the final decision is up to you.
Another Subscriber asked if gold could ever move $100-$200 in a day. Our answer is that it is certainly possible, most likely in the third stage of the bull market. In early May gold moved lower more than $30 in one day. If gold was trading at approximately $5,000, then a move of similar range (percentage wise) would amount to approximately $100. However, the volatility is likely to increase in the following part of the bull market, so moves above $100 are certainly possible.
Please note that it will be these volatile times when the technical, cyclical, fractal analysis will be of particular importance. Not necessarily to time weekly moves, but to make it much more likely that the major tops and bottoms are detected. Naturally, there are no sure bets, but without these tools (and relying on fundamental information alone) one's chance for making good transactions will be very limited at that time.
Another Subscriber sent us a link to an article that discusses the prospects for silver. The argument is that although there is more silver coming to the surface from mining activity, industrial demand is getting bigger and all the mining and recycling will not meet the total demand from industry alone, and that is without taking into account the investment demand. We agree that the fundamental situation in silver remains favorable.
"On Friday, July 22nd the Hong Kong Mercantile Exchange will start trading dollar denominated silver futures contracts with the hopes of tapping into the growing demand for the metal in China and India." One of our subscribers wondered how the above might impact the silver market.
The ability to trade silver on a new exchange is surely positive news for the silver market as it makes it available for new investors to enter the market. They will do so with futures contracts, but ultimately, some of the investors will take physical delivery of their silver and this will further amplify the strong investment demand for the white metal. On the other hand, it will also be easier to speculate on the price silver, so the volatility will increase as well.
Summary
The situations in both the currency markets and the general stock market remain tense at this time. The economic uncertainty in Europe has had an almost daily impact upon currency valuations and has been a mix of good and bad news lately. This has led to a lack of clear vision with respect to the future direction for the indices of both the euro and the dollar. The situation is also affected to some extent by the US Debt limit situation which has yet to be resolved in Washington DC. The way the USD Index moves past the support/resistance lines will likely determine its next big move.
The short-term outlook for precious metals has changed very little since last week. It appears quite bearish when analyzing volume levels and this is mainly due to gold’s failure to move above the $1,600 level decisively. It seems that gold’s price could decline before we see a second and likely successful attempt to take out this level.
Several factors are in play which suggest that lower prices in the precious metals sector are more likely than not. Consequently, it seems that a continuation of the recent consolidations to be followed by eventual price declines is the most likely scenario. Mid-August seems to be a good estimate as to when the final bottoms will be seen.
Our next Premium Update is scheduled for Friday, July 29th, 2011.
This completes this week's Premium Update.
Thank you for using the Premium Service. Have a great weekend and profitable week!
Sincerely,
Przemyslaw Radomski

