
Gold seems mercurial lately sliding up and down causing some gold investors to grey prematurely. Technical analysis is not an exact science nor does it act as a crystal ball, but there is comfort and even beauty to be found in patterns that asset themselves every once in a while. And now we are in such a self- similar pattern and continue to believe that higher prices for gold are imminent. We have written previously about the long-term buy signal from the SP Gold Bottom Indicatoralong with many other signals that suggest that now is the time to go long with a portion of one’s speculative money. The recent ups and downs in gold prices this week do not invalidate our position.
Speaking of ups and downs, gold futures traded lower Wednesday probing for a bottom along with most other commodities after failing to trade above the psychologically important $1,700 an ounce level in the previous session. Gold shot higher earlier this week after Fed Chairman Ben Bernanke signaled U.S. interest rates would remain at current ultra-low levels for a few years. Bernanke is already on the record saying he’ll keep US rates low until 2014. This week he reiterated the message, saying, “Further significant improvements in the unemployment rate will likely require a more-rapid expansion of production and demand from consumers and businesses, a process that can be supported by continued accommodative policies.”
If we look back, at the end of February gold was especially hard hit, following Ben Bernanke’s announcement that there would be no additional quantitative easing. This caused the price to fall below its 200-day moving average, a rare occurrence. Our subscribers were well prepared with a Market Alert the day before urging them to stay away from speculative long positions. In previous times when the price fell below its 200-day moving average (about 30 times over the past ten years of the bull market) gold stayed down for less than two weeks.
The fundamentals for gold are in place-- rising wealth in China, Europe’s financial instability and high fiscal deficits in the U.S. Real interest rates are still negative in many countries and we now have Bernanke’s assurance that they will stay that way in the U.S. for the foreseeable future. Although the U.S. debt situation has not been front-page material for a while let’s not forget that the Fed’s balance sheet is deep in the red. The European Sovereign debt crisis is creeping back into the financial news headlines this week, with Spain in focus amid its financial problems. Even though the markets seem to feel that the worst is over, any significant heating up of the EU debt crisis would support safe-haven gold buying.
This Wednesday Goldman Sachs reiterated its position that investors should buy the precious metal. Goldman Sachs remains bullish on gold, citing the familiar fundamentals-- low interest rates and subdued economic growth as catalysts for gold prices to rise this year.
Goldman economists expect another round of quantitative easing from the Federal Reserve will weigh on the U.S. dollar and push gold higher. From Goldman:
Gold prices remain too low relative to the current level of real rates. Under our gold framework, US real interest rates are the primary driver of US$-denominated gold prices. However, after being remarkably strong in the first half of 2011, this relationship broke down last fall, with gold prices falling sharply in the face of declining US real rates, as tracked by 10-year TIPS yields. While gold prices have returned to trading with a strong inverse correlation to US real rates since late December, at sub-$1,700/toz they remain below the level implied by the current 10-year TIPS yields.
Thegold market’s expectation that real rates would be rising along with economic growth may help explain this valuation gap.We believe that despite last fall’s decline in 10-year TIPS yields, the gold market may have been expecting that real rates would soon be rising along with better economic growth, leading to a sharp decline in net speculative length in gold futures. Accordingly, a simple benchmarking of real rates to US consensus growth expectations suggested a level of +40 bp by year end. Our models suggest this higher level of real rates would be consistent with the current trading range of gold prices. As we look forward, our US economists expect subdued growth and further easing by the Fed in 2012, which should push the market’s expectations of real rates back down near 0 bp and gold prices back to our 6-mo forecast of $1,840/toz.
The firm says that strengthening U.S. economic data would represent a growing risk for gold.
“We reiterate our view that at current price levels gold remains a compelling trade but not a long-term investment,” Goldman says.
Meanwhile, protests in India against tax hikes on non-branded gold jewelry and gold imports stretched well into their second week, with local media reporting some jewelers and traders were holding a day-long hunger strike against the levies. India is the world’s top gold consumer, and the demonstrations are reportedly frustrating imports during a seasonally strong period for demand.
The jewelers are protesting a doubling of taxes on gold imports to 4% and a 1% excise duty on jewelry. Representatives of small jewelers across India say the tax would put a particularly heavy burden on them and their clients. The wedding season, during which gold consumption peaks, is usually from late October to December, followed by a brief interruption of a few weeks, which are considered inauspicious. It then resumes from late January to June.
Just late last week, the president of the Bombay Bullion Association, was widely quoted in the Indian media as saying the taxes would lift retail prices by 6% and warning of a huge drop in demand. If this were to take place, India would lose its status as the world’s largest consumer of gold to China.
New Delhi first slapped a 2% hike on gold in January to start plugging the holes in the government’s finances and the country’s current account deficit, a measure of the nation’s debt to foreign creditors. Gold demand was also cited as a factor in the slide of the rupee last year, which lifted the costs of India’s import bill.
As it was the case many times previously, we’ll begin this week's technical part with the analysis of the US Dollar Index. We will start with the very long-term chart (charts courtesy byhttp://stockcharts.com.)
USD Index
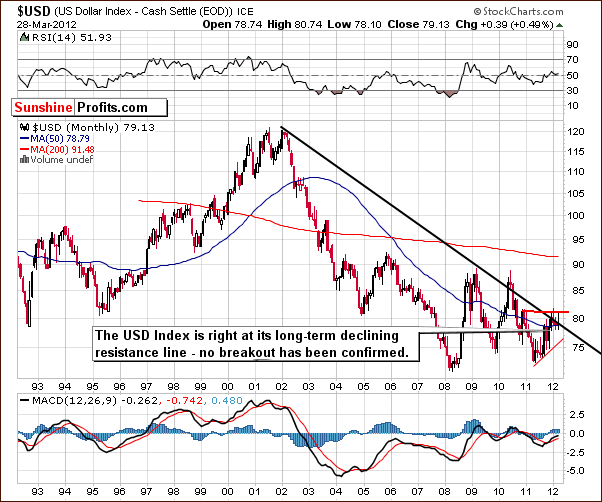
Our first chart this week is the very long-term USD Index chart. This week the index moved a bit lower, down 1.64 or 2% since last Thursday. It is no longer close to its 2011 high and prices are now visibly below the 80 level and more or less at the long-term resistance line. No breakout has been seen so far.
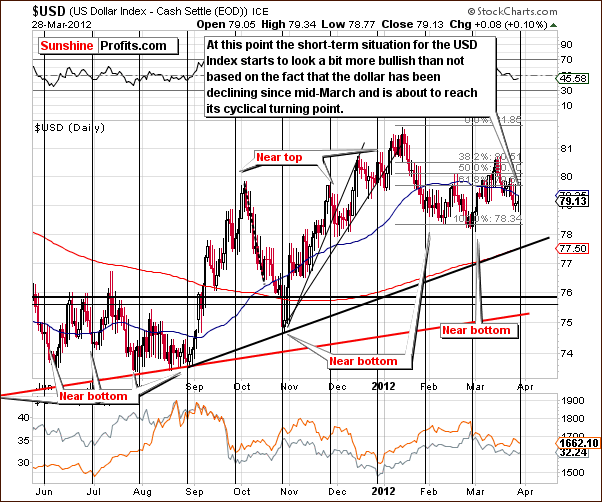
In the short-term USD Index chart, it appears that we may see another small rally in the days ahead. A cyclical turning point is at hand, and with declines having been seen for a couple of weeks now, a local bottom could form followed by a small period of moves to the upside. If it does occur, it will likely be short lived since the main, medium-term trend is now down.
Although the very short term may see some strength here, this does not necessarily translate to weakness in the precious metals sector. A rally in both gold prices and the USD Index would result in gold appreciating from a non-USD perspective. In fact, this is something which appears to be in the cards as well. This topic will be discussed in detail later.
Summing up, the medium-term outlook remains bearish but a very short-term move to the upside could be seen. This is not expected to have any serious bearish impact on gold, silver or the gold and silver mining stocks.
General Stock Market
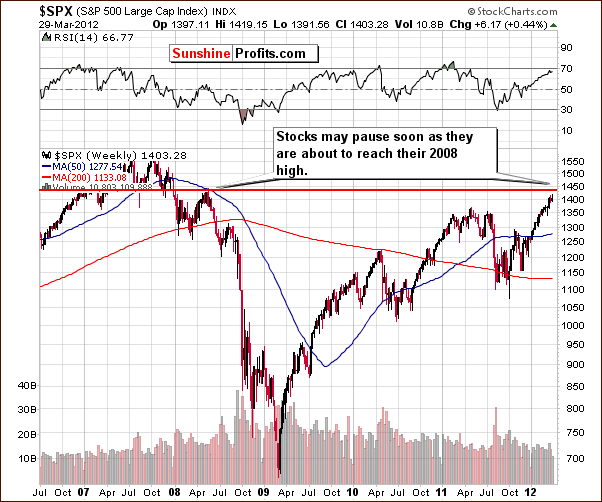
In the long-term S&P 500 Index chart, it seems that stocks may pause soon, as they’re about to reach their 2008 highs. Thursday’s closing index level was just 2-3% below this resistance line. If prices decline from here, they will likely not go lower than to the level of the 2011 highs, which would be a pullback to about $1,360 level or so, roughly 5% below the highs of four years ago. We would then expect the rally to continue in a manner similar to what was seen in late 2010.
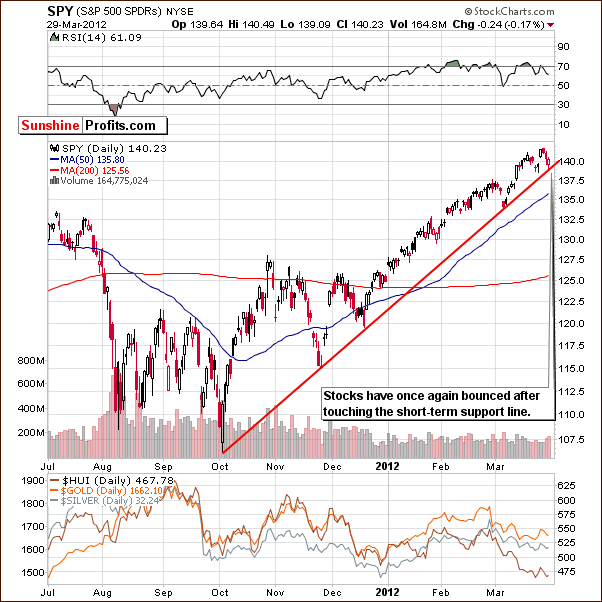
In the short-term SPY ETF (proxy for S&P 500) chart, we see a bit of a different picture. Here, stocks are at a short-term support line, so it seems that the next short-term move will be to the upside. It’s likely however that this move will be somewhat short-lived based on the previously discussed situation on the long-term chart.
Summing up, stocks seem likely to move a bit lower in the coming days or weeks after a local top is formed in the 1,440 range, close to the resistance line created by the 2008 high. Then a correction back to $1,360 or so, the level of the 2011 high, appears probable.
Correlation Matrix
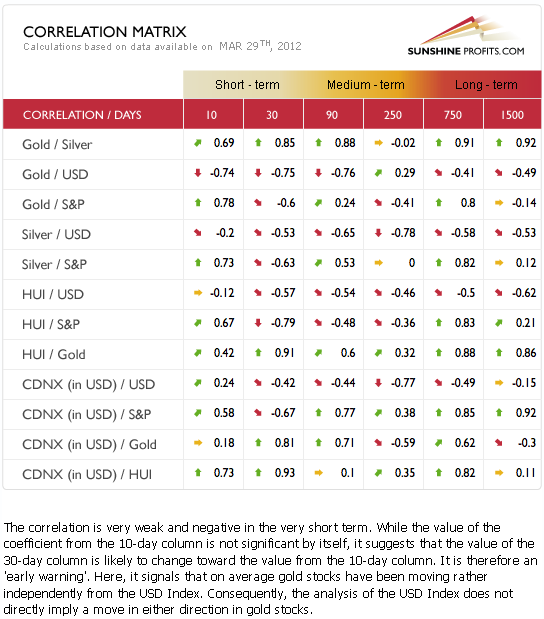
The Correlation Matrix is a tool, which we have developed to analyze the impact of the currency markets and the general stock market upon the precious metals sector. The situation with coefficients this week is little changed from a week ago. In last week’s Premium Update, we stated:
Generally the precious metals and the USD Index have a negative correlation and the same holds true between the precious metals and the general stock market. This is the situation with these markets today and this means that gold, silver and the gold and silver mining stocks are likely to move in the opposite direction of the USD Index and the S&P 500. Overall, a bit uncertain relationship between metals and USD, and a bit uncertain short-term direction in which stocks will head in the near term, makes us believe that we have rather mixed implications for precious metals. Consequently, it simply appears best to focus on the precious metals markets at this time to get a clearer view of their most likely future price paths.
These statements remain valid, as the currency and stock markets have not had any major developments over the past five trading days except the USD Index moving closer to its cyclical turning point. The coefficients this week are not very strong with many of them in the range of -0.5. It continues to seem much better to focus on the clearer technical situations in the gold and silver markets as opposed to what we now see in currency and stocks.
Gold
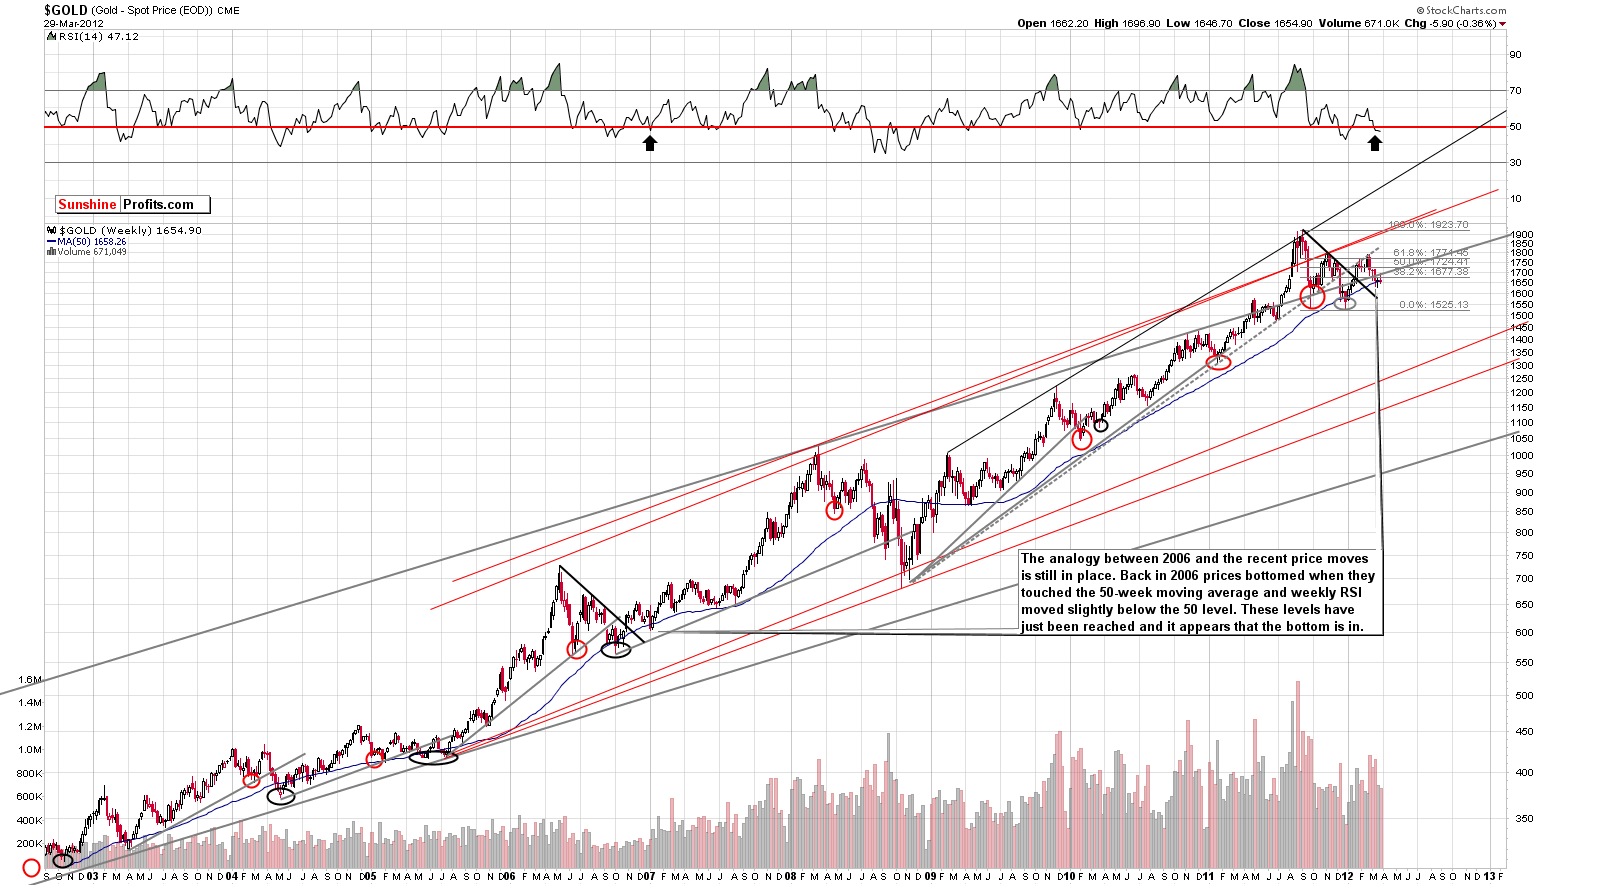
This week we begin our gold section with a look at the very long-term chart (please click the above chart to enlarge). This chart is basically unchanged this week, so last week’s comments still hold true. Gold prices moved sharply higher early in the week and then corrected this move. The RSI level suggests that gold prices still have a way to go, and this is consistent with what we see in our analysis of the self-similar pattern from2006-2007. All in all, the very long-term implications remain bullish.
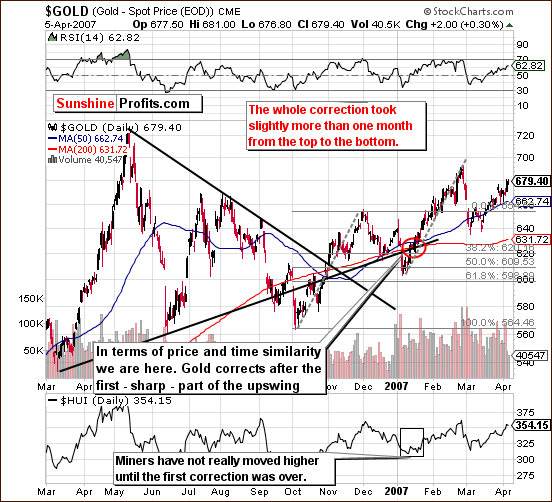
Examining the chart from 2006-2007 allows us to focus on the self-similar pattern in much greater details. We see that this week’s gold price action indicates that the bottom phase has been completed, and we now can compare our current gold market situation to the first small correction phase seen in mid-January 2007. We’ve indicated where we are today in terms of price and time similarity with a red ellipse. Gold actually corrected after an initial sharp rally back in 2007 and then continued the rally in the following week. The 1.5% correction in the past three days followed a two-day jump in which gold’s price rose slightly more than 2.5%. It appears that a rally in the week ahead is very probable based on the 2007 trend.
Beneath the gold price chart, we see the HUI Index performance of early 2007. Gold stocks did not perform too well initially, as a double bottom pattern developed. The move to the upside was not seen until gold completed its sharp correction and then showed another quick rally. For these reasons, we expect to see a rally in the HUI Index once gold prices begin to rise. More will be said on this topic later in the Gold and Silver Mining Stocks section.
It’s interesting to look at the sizes of both rallies seen in late 2006 and early 2007. The rally preceding the correction and the one which followed it are noted with a gray, dashed line in the above chart. Note how the two paths are similar. Each rally topped out at about the same percentage increase and each was also approximately two months in length. The implications for 2012 point to prices moving to the level of their previous high, in line with target levels discussed in last week’s Premium Update and close to the $1,900 level for spot gold. This is approximately where a repeat of the late-December 2011 – late-February 2012 rally would take us.
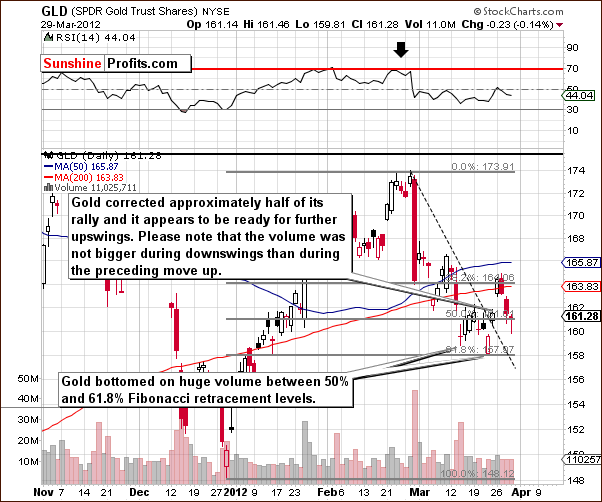
We now turn to the current GLD ETF chart in order to analyze the self-similar pattern for the short term. The GLD ETF rallied on March 23 and March 26 and this week corrected about one half of this rally. Volume levels were not huge and, more importantly, not bigger on moves to the downside, so the declines seen in recent days are likely nothing more than a correction within the current rally – the verification of the breakout above the declining short-term resistance line. The intra-day reversal seen on Thursday also has short-term bullish implications, so it seems that the correction may be over here, and the rally could very well continue immediately.
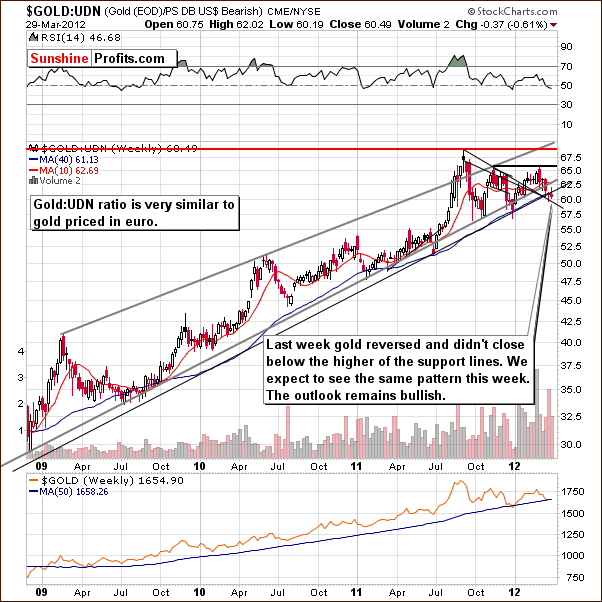
In this week’s chart of gold from a non-USD perspective, not much has changed from last week. A small move below the rising support line has not been confirmed so no breakdown has been seen. If gold rallies or even holds its current price level, the breakdown here will likely not be confirmed. For these reasons, the outlook here remains bullish.
Summing up, the bullish case for gold is still present this week, and we still expect spot gold to move to the $1,900 trading range. Comparisons to the self-similar pattern of 2006-07, current RSI levels, and daily trading volume analysis all support this bullish outlook.
Silver
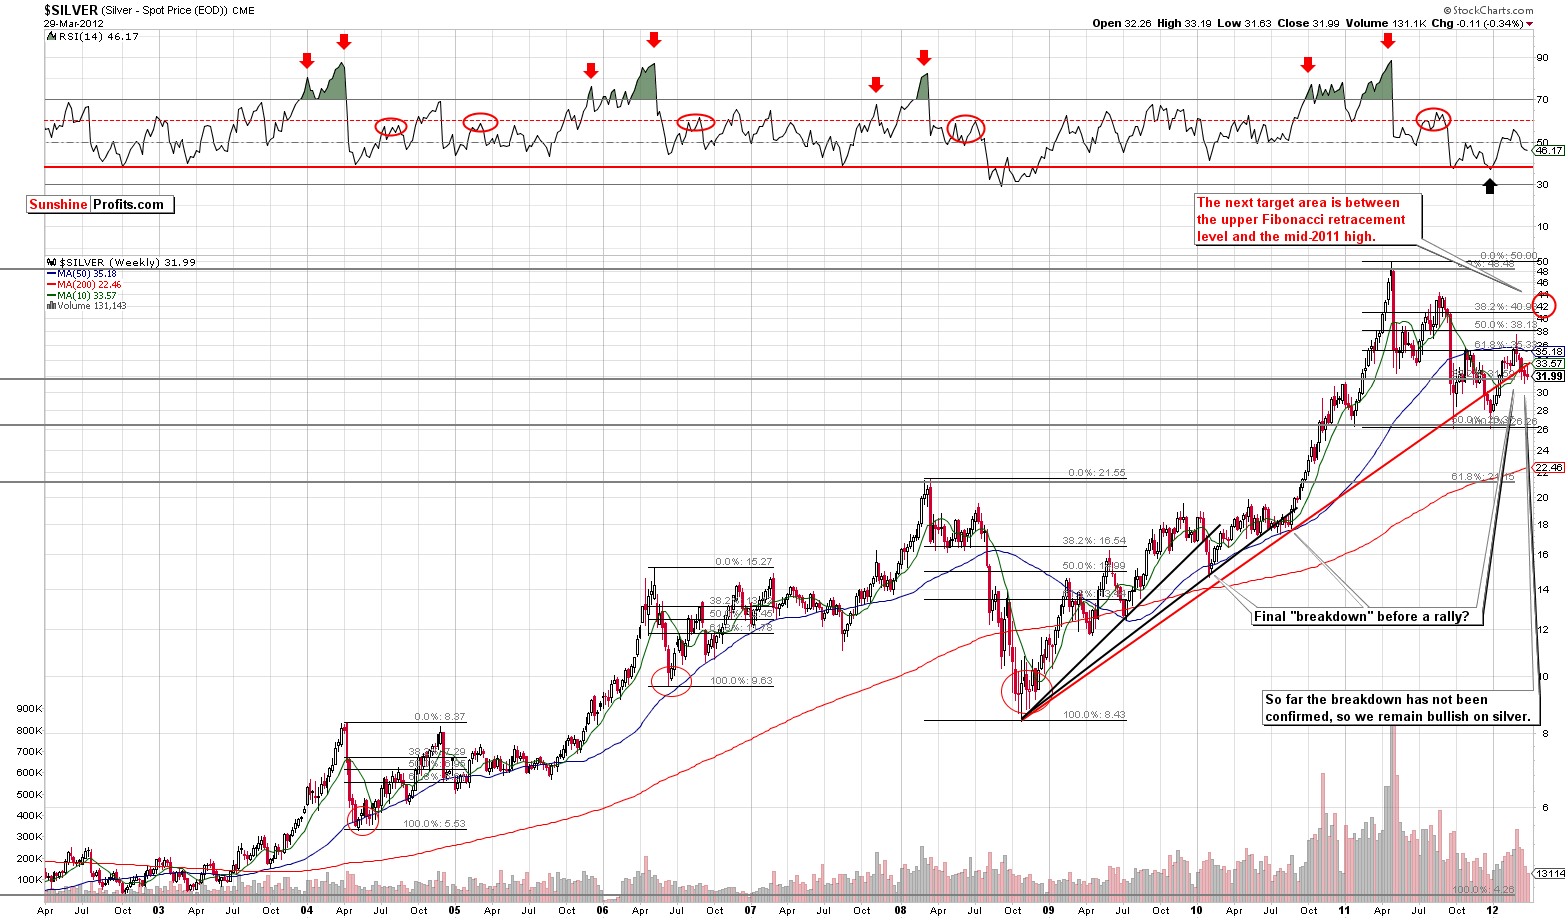
We begin this week’s silver section with a look at the long-term chart (please click the above chart to enlarge). This chart is unchanged from last week, and what could be the final breakdown before a significant rally still appears to be in progress. Previously stated target levels are still in place, with spot silver likely to move to the $40-$45 trading range, and the outlook here remains bullish.
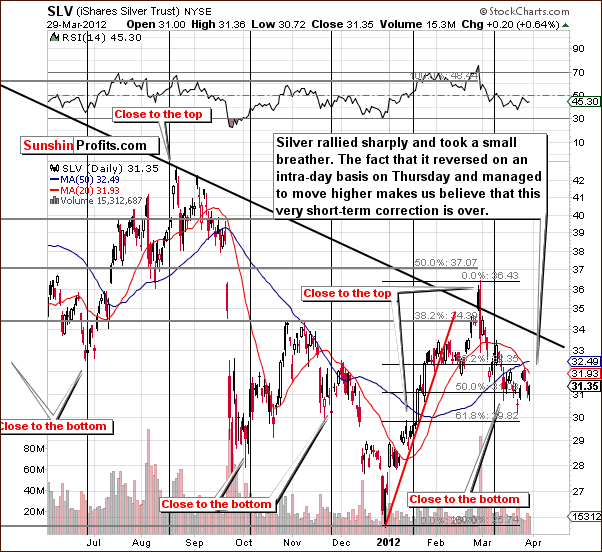
In the short term SLV ETF chart, we saw a rally this week and silver then took a short breather. Prices rose again on Thursday, however, and since that happened after an initial move lower on that day, this appears to be a bullish short-term sign. Indications are that the correction is likely over, and higher prices will soon follow.
The closest resistance level is slightly above $33.50 here, which corresponds to $34.50 for spot silver. We do not expect any significant declines from this level once it is reached. It appears that the white metal is now ready to break through this next resistance level and the upside potential here is substantial.
Summing up, the situation for silver remains bullish and the short-term correction appears to now be over. It seems likely that silver will break through the next resistance level and prices will likely move much higher thereafter.
Gold and Silver Mining Stocks
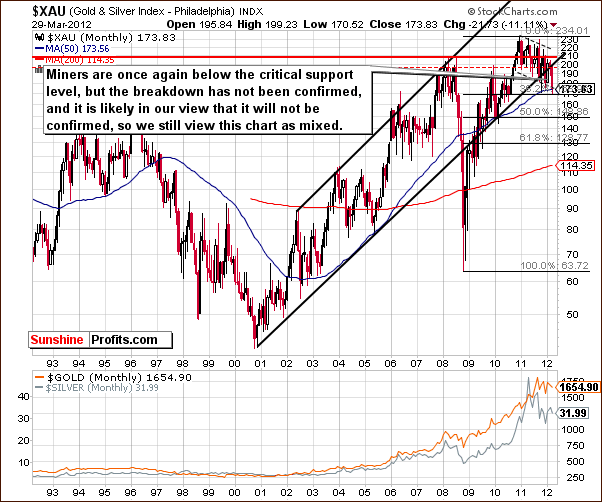
In this week’s very long-term XAU Index chart, very little has changed since last week. The situation is still not too encouraging here as the miners are indeed below a critical support level. This breakdown has not been confirmed, however, so the situation seems to be best described as mixed.
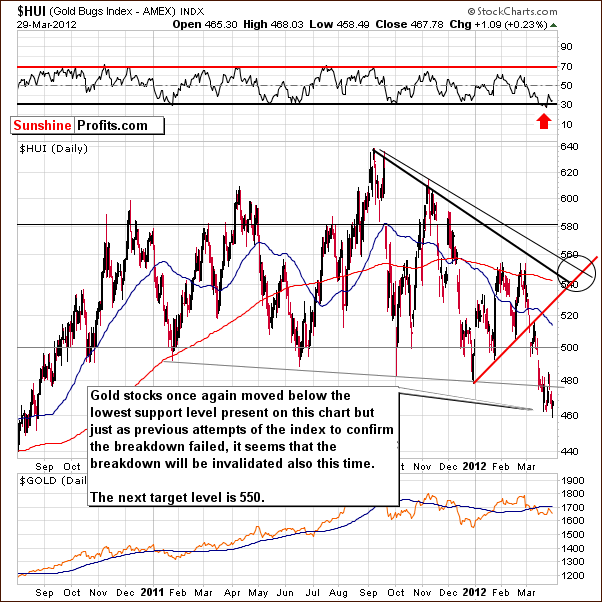
In this week’s medium-term HUI Index chart, we see that the bottoming process appears to still be in progress. This is quite comparable to what was seen in the 2006-07 self-similar pattern. With the short-term correction period for gold and silver likely over, it’s probable that higher price levels will be seen soon for gold stocks and the HUI Index will likely move to the 550 level in the weeks ahead.
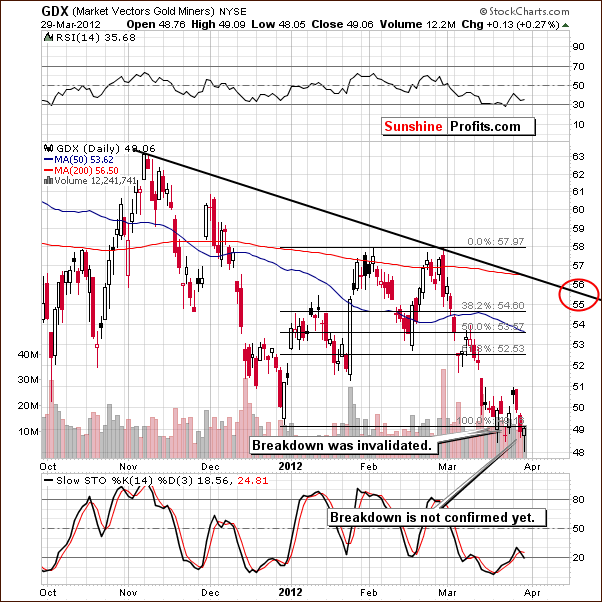
In the GDX ETF chart this week, the analogous target level of $55 is in place. The breakdown here has not been confirmed on a short-term basis and was invalidated on its previous attempt as well. Here too, we expect a move to the upside based on recent developments in the gold and silver markets. The RSI levels here, which are still close to the 30 level, also support this bullish outlook.
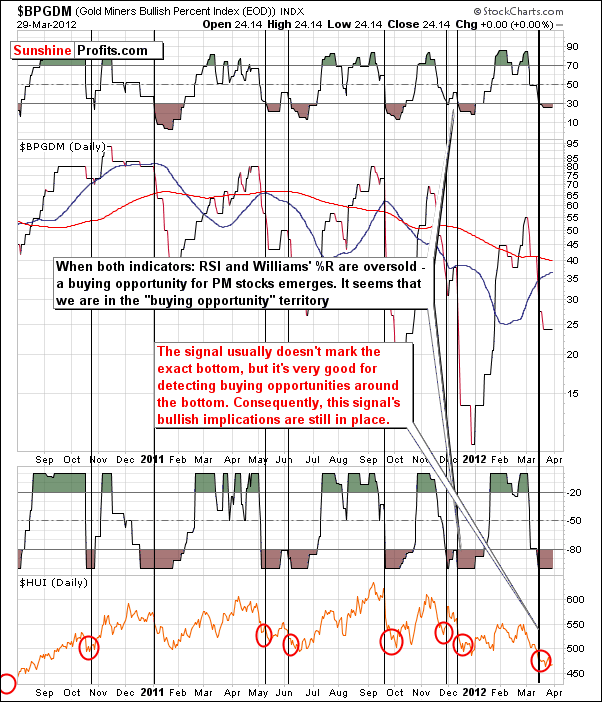
In the Gold Miners Bullish Percent Index chart, both indicators are still confirming the current buying opportunity. This is not surprising, given the fact that the miners have not moved higher this week. Please note that these indicators do not signal the bottom with perfect precision. They flash when the bottom is close at hand, and this is still very much the case this week.
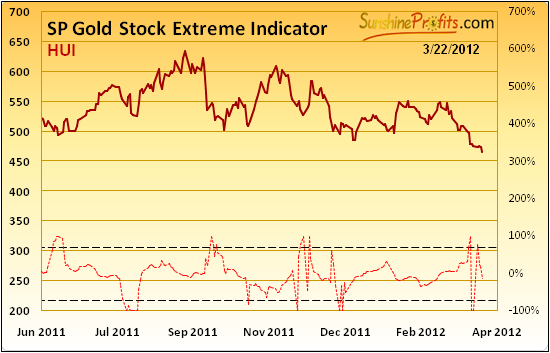
We have included a Sunshine Profits Gold Stock Extreme Indicator in this section since it is mainly related to the performance of the mining stocks. Naturally, it has profound implications for gold and silver as well. This week we have two more buy signals here from the closing prices seen on Wednesday and Thursday.
This is yet another confirmation that gold’s bottom is in, and long positions for gold, silver and the gold and silver mining stocks appear to be a good idea right now. Keep in mind that this Extreme Indicator has been very reliable since 2008.
Summing up, analysis of the gold and silver mining stocks this week confirms the existence and validity of a self-similar pattern with 2006-2007. The price patterns of gold, silver, and the mining stocks appear ready to rally in the weeks ahead.
Junior Mining Stocks
As stated in the Key Principles section, the list of top juniors will be updated approximately every 4 weeks, so this is the Update that should contain the revised version of the lists. Actually, we’re a little ahead of our schedule, but we tweaked our algorithm for choosing stocks, so we didn’t want to keep you waiting.
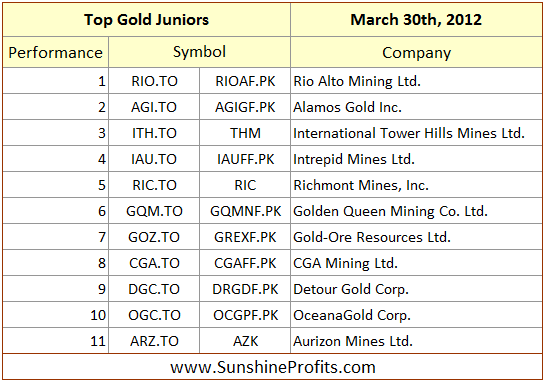
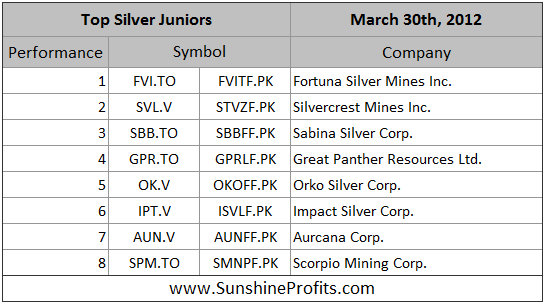
There are a few changes in the above tables compared to the previous ones. First, we decided to move RIO.TO to the gold list, simply as it is no longer a silver company – we still like this company a lot, however since Mexican Silver Mines Ltd. combined with Rio Alto Mining Ltd., it drifted from silver to gold-copper projects and keeping it in the silver ranking is not really justified. Intrepid Mines Ltd. were hit based on changes in mining regulations in Indonesia and the company dropped to the 4th position in our ranking. It might be too early to sell at this point, because the damage to the company’s stock is likely already done and the rebound may be on its way. We plan to monitor this company closely as the precious metals sector moves higher and based on co IAU’s strength decide whether keep this company or to substitute it with other juniors.
We also received a question if it’s a good idea to invest in New Gold, Inc. – generally this company looks solid, however it is in our view too big to be viewed as junior, so we will not include it in our junior rankings.
Please note that we’ve recently written that we favor junior mining companies to big senior producers. The current bullish case for the general stock market in the medium term makes us continue to believe that this is a good way to approach the mining sector. As you may see in the last 4 rows in this week’s Correlation Matrix, there is a very strong correlation between juniors and main stock indices – consequently, what’s bullish for stocks, is also bullish for juniors.
Letters from Subscribers
Q: Could you please tell me how you came up with a price target of $5000 for gold? Do you have a chart to show how you projected that?
A: Not really. That's not a precise target - we don't think that gold will move precisely to $5,000 and then plunge. It’s a milestone that we believe will be reached and that gold will probably move above. We estimated it by adjusting the 1980 high by the unaltered inflation numbers (shadowstats.com) and then conservatively rounded it downward.
In other words, we believe that gold will at least approximately match its previous inflation-adjusted high and that it will probably surpass it.
Q: This is an interesting article. Opinionated, no BS:
http://www.321gold.com/editorials/moriarty/moriarty032612.html
XAU components:
http://finance.yahoo.com/q/cp?s=%5EXAU+Components
A: Very interesting. We are very eager to see how miners perform once both stocks and gold are above their previous highs. Right now people have so many alternatives to gold investing other than gold stocks that much stronger demand for gold doesn't have to translate into much (!) stronger demand for gold stocks. It could translate only into moderately (!) stronger demand for gold stocks and stronger demand for ETFs, ETNs and similar. Again, the link between metals and miners is in place, and we may be indeed at a major buying opportunity. However if both gold, and stocks move above their previous highs and miners continue to lag, we will likely suggest lowering the exposure to this sector.
We'd like to note that Mr. Moriarty is actually using TA in a semi-standard way while writing about not using it at all. He still uses the principle that history rhymes, recognizes that markets are emotional and even provides a chart. We’d also like to note that XAU is not made up of senior gold shares, HUI is. XAU includes both gold and silver companies (PAAS, SSRI, and SLW).
Q: In the last PU you recommended the May options on GLD. This is quite a bold statement, so you must be pretty sure the price will increase. Options with such a short expiration quickly lose their value. I myself bought the June options around $165 before the fall and I'm still in the red. But if you recommend the May options, I am counting on the projected growth with June options.
You currently see the price of gold increasing to around $1,900. Does this have to be in May, or might there be a break over the summer, and this level would be achieved in the autumn? What is the probability?
If you see it happening in May, then can we count on a signal if the price temporarily falls by $20 / $30 / $50? (It probably won't go straight up to $1,900.) Or perhaps you could provide us with a projection of a correction along the way?
A: Yes, we are quite confident that the rally will be seen in gold, and yes, June options appear appropriate as well. At this point we estimate the probability of a significant rally in gold at 80%. We view the probability of the $1,900 level being reached before June at 65% and we view the probability of the $1,900 level being reached before the end of the year at 80%. Please note that May options are not an investment recommendation – we don’t make such, as we’re not investment advisors.
Generally, we don't aim to trade each and every move up or down, but in this case if we believe that a $50 correction is in the cards, we will likely suggest moving out of the market unless we view the subsequent rebound to be very sharp and unpredictable. In other words, if we believed that a $50 move was in the cards, but at the same time we believed that even if it took place then gold would likely rebound within 1-2 days and then move $80 higher, then we would prefer to stay long gold as the odds of capturing the downswing would be quite low.
Q: I just heard on CNBC that Dennis Gartman prefers gold in Japanese yen. Is there an ETF that investors can purchase that is available for this? It would be very useful if you could list all the gold vehicles short and long for subscribers. Thanks.
A: We don't know of an ETF that would simulate gold's performance in yen.
Generally, "buying gold in yen" breaks down to buying gold in your local currency and then buying futures on the YOUR_CURRENCY:JPY currency pair or another similar instrument that moves up in value when your currency appreciates against the yen.
Yes, this means betting on the forex market, something that makes over 90% of traders lose money, so we don't advocate it. Plus, you would need to dedicate some of your cash as a deposit for the currency trade, instead of simply buying gold with it.
So, we suggest simply trading and investing in precious metals without any forex additions, as gold will likely move higher in all currencies.
Summary
The situation in the precious metals sector continues to develop as we have indicated in recent weeks and also as described by the self-similar pattern which we believe is still very much in place. Our target levels for gold, silver and the HUI Index remain valid, and it appears that the rally has already begun in the gold and silver markets. We expect the gold and silver mining stocks to follow with their own rally very soon.
Target levels remain as follows: $1,900 for spot gold, $40 to $45 for spot silver, 550 for HUI Index, and $55 for the GDX ETF.
The situations in the USD Index and the general stock market seem a bit unclear for the upcoming two week period. The USD Index may move a bit higher and a small move to the upside may be seen for stocks as well. Both moves appear to probably be short-lived, however, with stocks likely to soon correct and a subsequent move to the downside seemingly in the cards for the USD Index.
At this point, the self-similar pattern and other technical indications seen in the precious metals sector itself appear to be better suited for analysis than attempting to draw conclusions from the unclear situation in the other markets.
All in all, we suggest being long with both: speculative (dedicated to trading) and long-term investment capital.
This completes this week’s Premium Update. Our next Premium Update is scheduled for Friday, April 6, 2012.
Thank you for using the Premium Service. Have a profitable week and a great weekend!
Przemyslaw Radomski

