
It’s tough being a lone voice saying that gold prices will go up when they have tumbled and the financial press is writing obituaries for the gold bull market. It’s also encouraging being a lone voice saying that gold prices will go up precisely because it means that the general sentiment is very bearish and this is what we see at major bottoms. Gold has gotten clobbered and silver has taken a beating as Treasury yields surged and markets are moved by optimism that a recovery has gained traction. Fears over an implosion in the Eurozone seem to have receded.February’s jobs report signaled a strengthening recovery. Greece’s widely expected default has momentarily taken Europe’s sovereign debt crisis off the radar screen. UBS’s Edel Tully has lowered the one-year price target of gold to $1,550 an ounce, a 12.7% downgrade.
Yet, it was the case that many analysts were quite bullish at the end of February 2012, when we suggested waiting on the sidelines… Since then we have gotten a long-term buy signal from the SP Gold Bottom Indicator along with many other signals and suggested that now is the time to go long with a portion of one’s speculative money. In last week’s Premium Update we wrote that the buy signal is still in place and that the implications of the SP Gold Bottom Indicator are long term. The recent declines in gold prices last week and this week do not invalidate it in any way, we said.
Another one of our indicators, the SP Gold Stock Extreme Indicator, also shows a bullish signal having moved through the upper dotted line. This indicator has been very good at spotting short term and medium term bottoms since 2008. It has, in fact, been 100% accurate as far as short-term bottoms are concerned. This serves to further reassure us that being on the long side of the precious metals market is a good place to be right now, despite the clamor and noise all around us.
But there is no denying that it is emotionally difficult to be long gold right now, as we cautioned when we suggested it. The metal has now fallen almost $150 an ounce from a Feb. 29 high.
What does all this mean for gold?Is it necessarily true that an economic recovery is bad for gold?
We would like to remind you that gold did not begin its stellar bull run in 2008 when the financial crisis hit. It began long before when the economy was peaches and cream, the future looked rosy and Lehman Brothers brokers took fat bonuses to their homes (which were rising in value.)
There are no indications the Fed will begin to hike rates any time soon, given the dismal U.S. housing markets. That is a bullish scenario for gold. There is a palpable threat that crude oil prices may go through the roof if an Israeli-American-Iranian conflict will disrupt the flow of oil through the Strait of Hormuz. The European sovereign debt crisis is far from over, and one of the remaining PIIGS might still fail. Portugal is seen by many as a major candidate, while Spain and Italy will have to weather through in the medium-term. And we have already lost track of how many trillions the U.S. government owes. The increasing numbers of Indians and Chinese who are entering the middle class and whose cultures value gold, will buoy up demand and, as we have indicated, there are still many uncertainties and structural problems in the world today.
Fed Chairman Ben Bernanke this week lambasted the gold standard, saying that such a system handicaps the government’s ability to address economic conditions."Since the gold standard determines the money supply, there is not much scope for the central bank to use monetary policy to stabilize the economy," the former Princeton Economics professor told students at George Washington University. “Under a gold standard, typically the money supply goes up and interest rates go down in a period of strong economic activity—so that's the reverse of what a central bank would normally do today…” Adopting the gold standard, he said, “means swearing that no matter how bad unemployment gets you are not going to do anything about it.”
In any case, the problem with a gold standard is there just isn't enough of the yellow stuff, Bernanke said.
Perhaps Bernanke was taking aim at Texas congressman Ron Paul, who advocates the closure of the central bank and a return to a gold standard where every dollar issued must be backed with equivalent reserves of precious metal. Proponents of the gold standard believe that given the power to print money, policy makers will do more harm than good by making decisions that prioritize short-term benefits over longer-term costs.
Bernanke defended the need for a central bank.
"The one thing people don't appreciate, I think, is that central banking is not a new development. It's been around for a very long time," he said, citing the creation of the Swedish central bank in the 17th century.
Speaking of Sweden being an early bird and a harbinger of things to come, Sweden seems to be doing away with coins and paper money. In Sweden, just 3% of the economy is powered by tangible money. Public buses don’t accept cash and even churches have installed card readers to take donations. It has gone so far that even some bank branches refuse to take money, preferring to deal with electronic transfers only. The European average of cash transactions is 9%, and in the US it is 7%. The trend is clear --cash is on its way out. So go ahead and start spending all those jangling coins you have been saving in the cookie jar. The day is coming when governments will stop minting coins and printing bills, marking a paradigm shift in human economic history. It wasn’t that long ago when there weren’t such things as credit cards. Of course, every one of our transactions will be recorded in various databases. We continue to suggest physical gold and silver ownership (in addition to other assets and trading capital) just in case things don’t develop too smoothly in the coming years.
We’ll begin this week's technical part with the analysis of the US Dollar Index. We will start with the very long-term chart (charts courtesy by http://stockcharts.com.)
USD Index
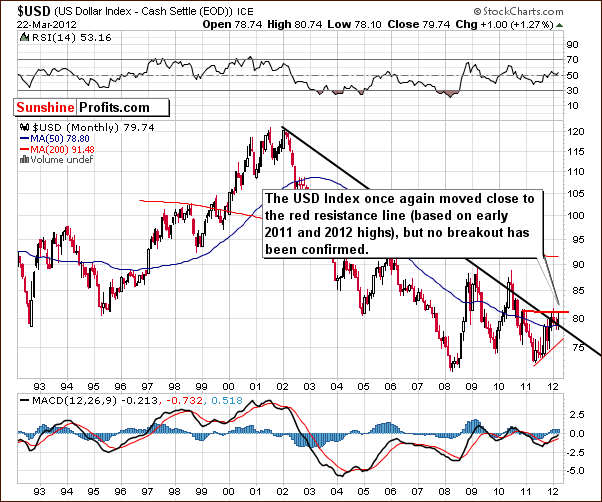
Very little has changed this week and the USD Index has been struggling between two support and resistance levels based on previous highs. Importantly, no breakout has been seen here and the situation remains tense. Overall, things are more bearish than not here because the major trend has been and continues to be down.
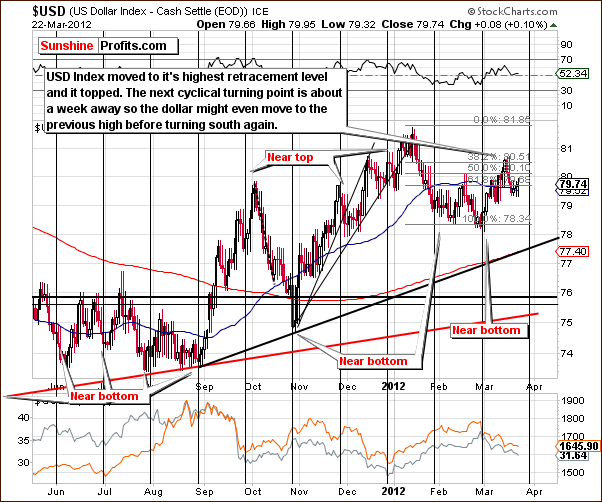
In the short-term USD Index chart, we see a decline in the index level this week after a move up to the highest Fibonacci retracement level. At this point, another move to this 61.8% level could be seen with a decline likely to follow.
Another possibility is a period of sideways trading to be followed by a decline. Eventual move to the downside is more likely than not based on the major trend here. Another point to keep in mind is that the next local top could be seen fairly soon since the next cyclical turning point is just around the corner. This would likely also be followed by a period of decline.
Summing up, very little has changed in the USD Index since last week. Thursday’s close was within a half point of where the index closed last Thursday. In short, the situation appears slightly more bearish than not.
General Stock Market
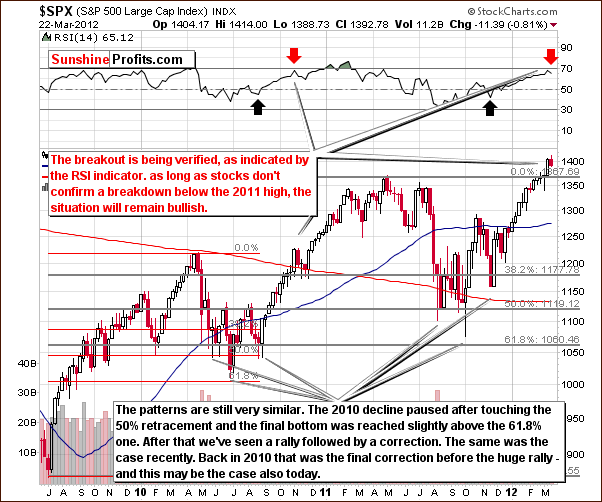
In the long-term S&P 500 Index chart, a small correction has been seen after the recent sizable rally. It is actually fractal in nature, quite similar to trading periods in mid-2010 and mid-to-late 2011. The correction may not be over, but the trend will remain up if stock prices hold above the 2011 high which is slightly below 1370. Any breakdown below this level would have to be invalidated quickly in order to maintain the bullish outlook here.
In the short-term S&P 500 Index chart, it appears that the correction may be over quite soon. We could see a move below the short-term support level, but the price levels of the previous highs (seen on the previous chart) are more important. If stocks decline and then rally, this would not surprise us either. Some consolidation appears quite likely here.
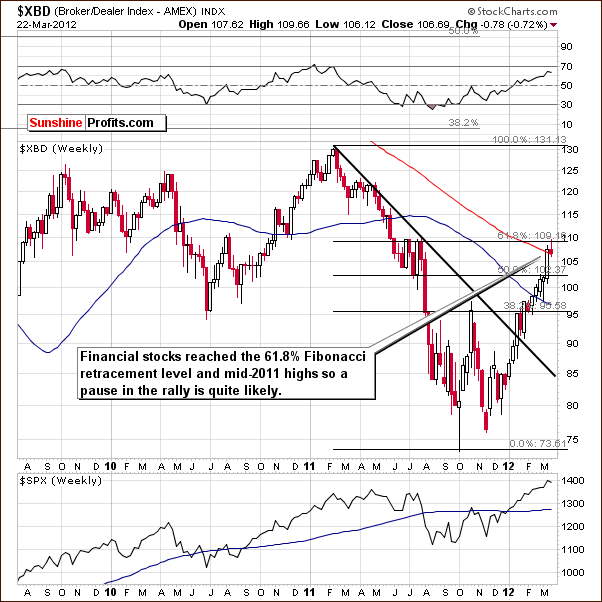
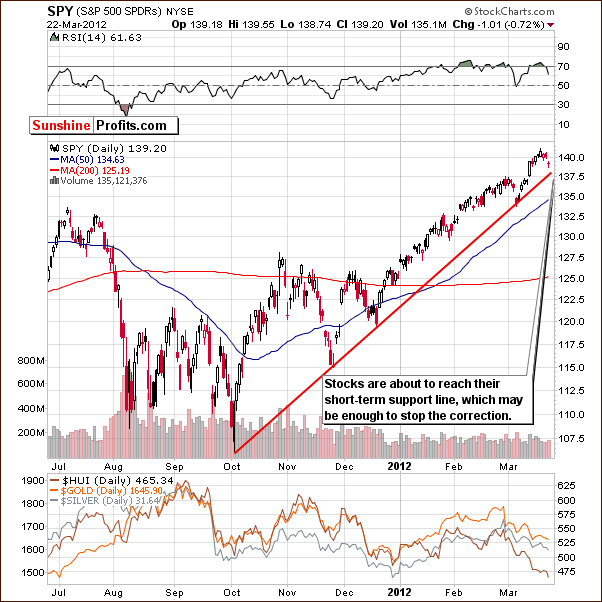
Turning now to the Broker Dealer Index (a proxy for the financial sector), we see that 61.8% of the previous decline has been corrected here. The financials have reached the highest resistance level and a pause appears quite likely at this time. This is a bearish short-term indication and some consolidation, possibly to the 102 level and the 50% Fibonacci retracement level could be seen before the rally resumes.
Summing up, the situation in the general stock market is a bit unclear for the short term but remains bullish for the medium term.
Correlation Matrix
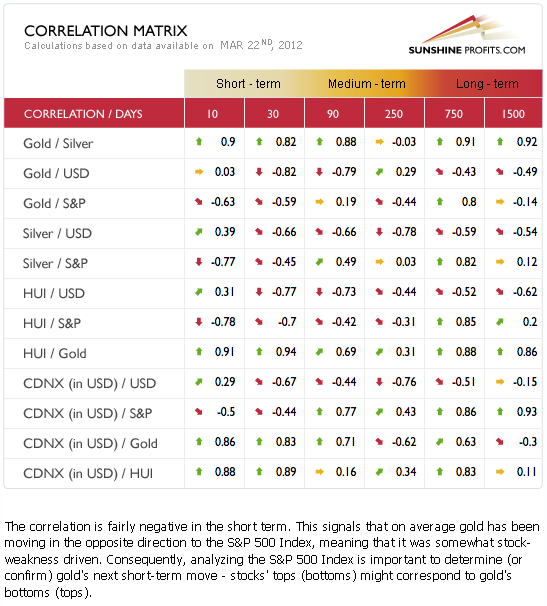
The Correlation Matrix is a tool which we have developed to analyze the impact of the currency markets and the general stock market upon the precious metals sector. Generally the precious metals and the USD Index have a negative correlation and the same holds true between the precious metals and the general stock market. This is the situation with these markets today and this means that gold, silver and the gold and silver mining stocks are likely to move in the opposite direction of the USD Index and the S&P 500. However, the 10-day column suggests that the negative correlation between USD and metals is weakening.
Overall, a bit uncertain relationship between metals and USD, and a bit uncertain short-term direction in which stocks will head in the near term, makes us believe that we have rather mixed implications for precious metals. Consequently, it simply appears best to focus on the precious metals markets at this time to get a clearer view of their most likely future price paths.
Gold
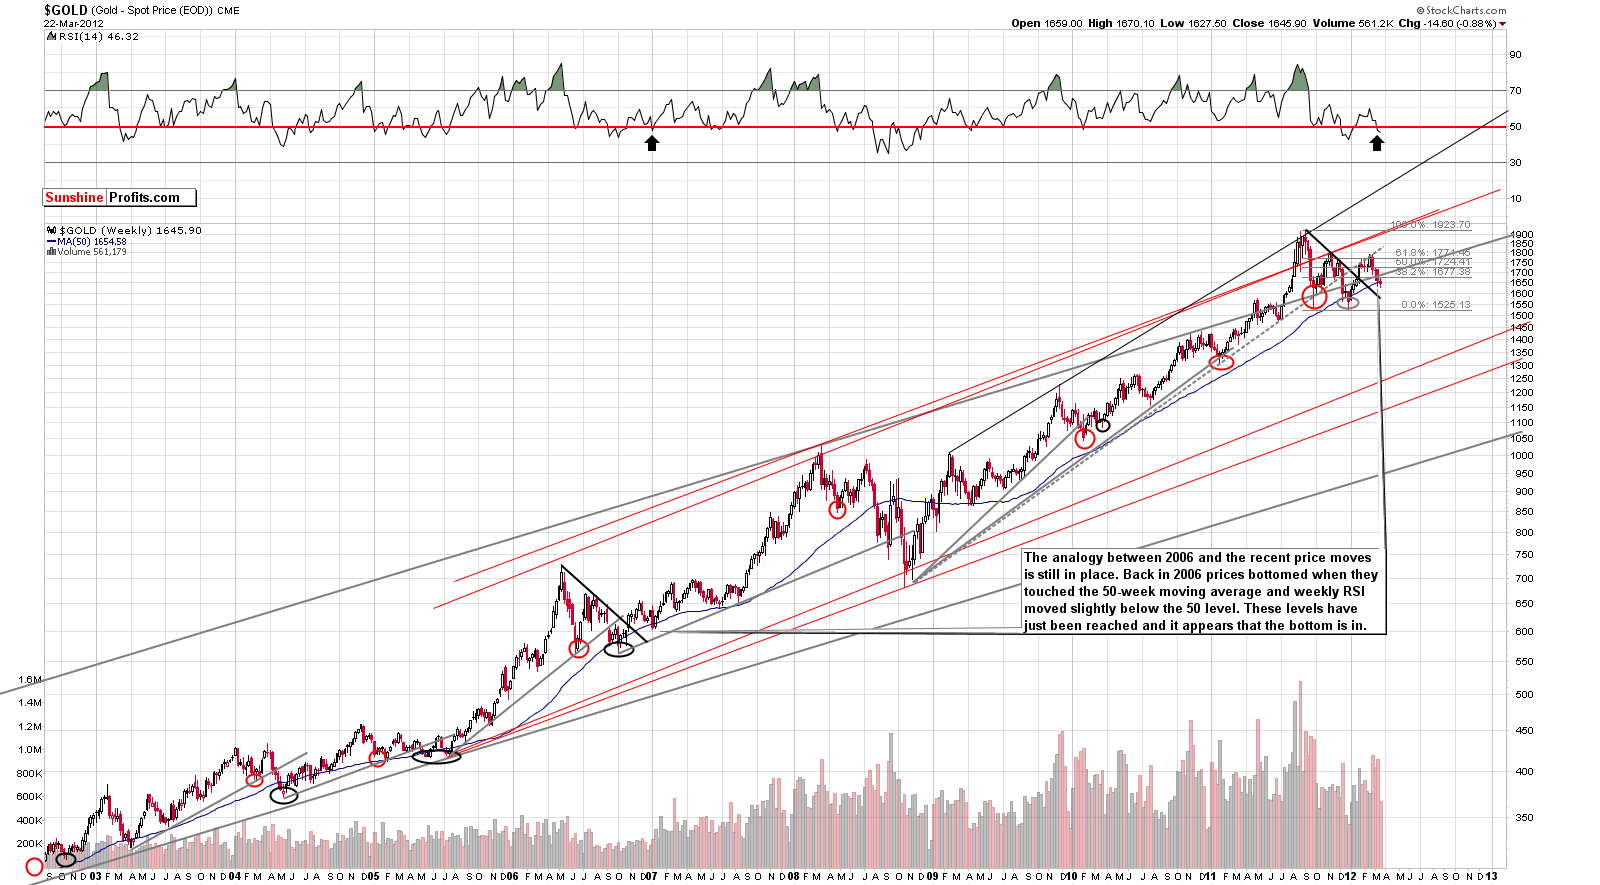
This week we begin our gold section with a look at the very long-term chart (please click the above chart to enlarge). This chart is basically unchanged this week and last week’s comments still hold true. This week saw gold rally early and then decline once again. The RSI level is below the 50 level and the self-similar pattern from the very long-term perspective is still very much in play. The implications are still bullish, in fact, even more so than they were last week.
Back in 2007, gold’s price held below the 50-week moving average for about two weeks – precisely, there were two weeks that included prices below the 50-week average. This time around, gold’s price moved below this average last week and did so once again this week. So now we have seen two weeks below this important support level in 2012. This is one more commonality which shows the similarity between the current trading pattern and the one seen five years ago.
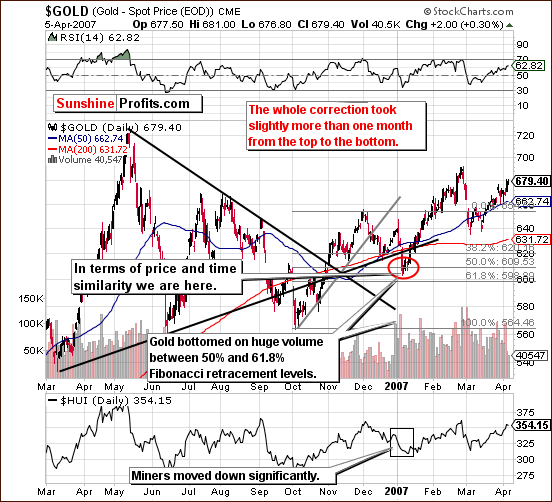
Taking a look at the chart from 2006-2007, we see that we are still in the range of the local bottom in our trading pattern. Gold did not rally sharply immediately but rather consolidated for several days before the start of a very sharp rally. During this early 2007 consolidation period, the performance of mining stocks was not very encouraging, but they did rally in the weeks and months to follow.
It seems valid to focus on the time that elapsed during the period of correction. A closer look shows that it was approximately a month before the final bottom was seen in 2007. The shape of the trading pattern is a bit different this time, but once again the length of time has been about one month.
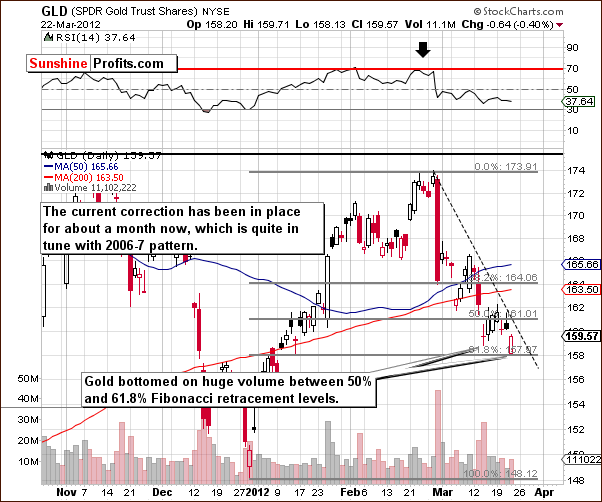
We now turn to the current short-term GLD ETF chart. Continuing our discussion on the length of time, we see that the first local top was on February 23rd and from then until today is precisely one month. With a self-similar pattern very much in play, it is actually more probable now than it was last week that gold’s bottom is now being formed.
Last week, the target price area (between 50% and 61.8% Fibonacci retracement levels) was filled perfectly and the same is true this week. It seems that the rally will start either on Friday this week or next week.
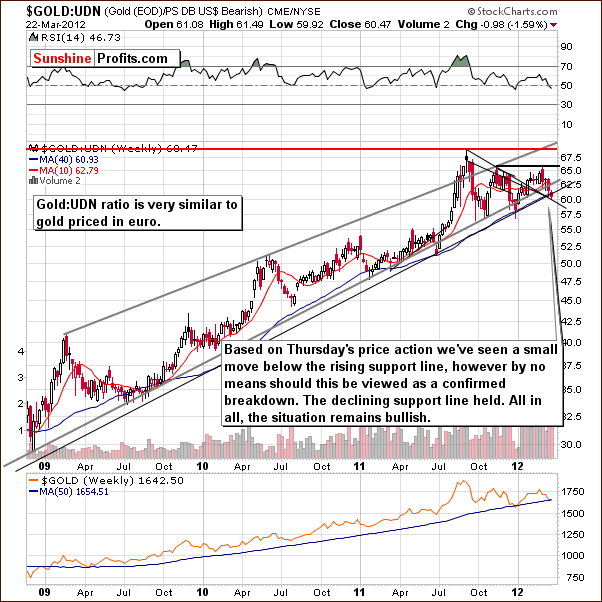
In this week’s chart of gold from a non-USD perspective, we have a bullish picture once again. A small move below the rising support line was seen here but the declining medium-term support line held perfectly. The move below the upper line in our chart is quite small, so the situation here remains bullish.
Summing up, the self-similar pattern remains very much in place and we continue to believe that higher prices for gold are just around the corner.
Silver
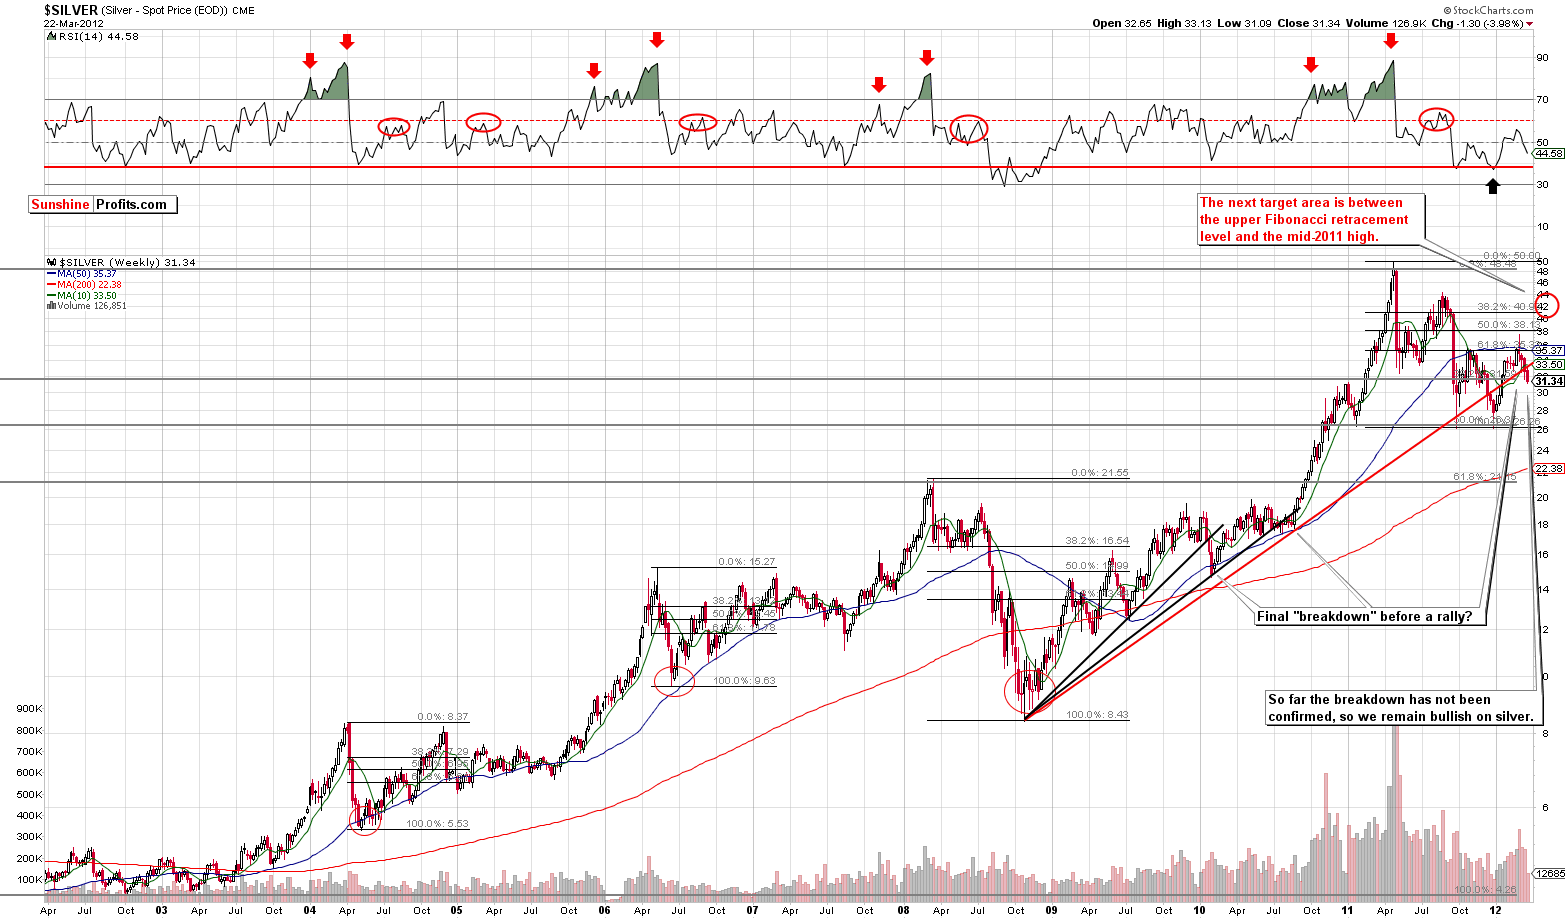
We begin this week’s silver section with a look at the long-term chart (please click the above chart to enlarge). Silver’s price declined a bit this week but we are not overly concerned. Gold performed well on Thursday after declining initially as it came back late in the session to recover over 80% of its intra-day decline and close down less than a quarter of a percent for the day. This show of strength has positive implications for the white metal as well.
Silver’s price decline does not invalidate the bullish picture here. Such moves have been seen numerous times. Silver often “brakes down” from a technical level and then rallies. This was the case in mid-2007 just before the rally which took silver above $20 for the first time in many years.
We also see a possible (bullish) reverse head-and-shoulders (starting in September, 2011) pattern in the chart. This further confirms our upside target level of $40 to $45. This target area is between the upper Fibonacci retracement level and mid-2011 high.
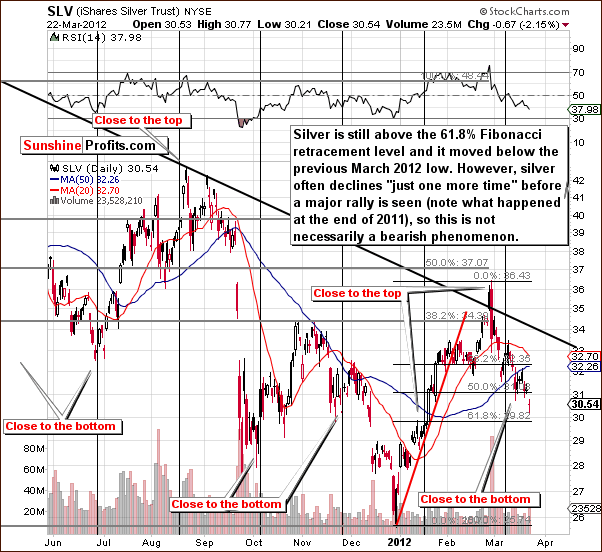
In the short term SLV ETF chart, we see that silver’s price has moved lower but is still above the 61.8% Fibonacci retracement level. Once again, silver’s intra-day volatility is often quite strong and without really bearish implications. It seems that a decline below the level of previous lows will not mean much bigger downswing in the days to come.
Summing up, the situation remains bullish for the white metal as it continues to be closely tied to gold.
Crude Oil Prices
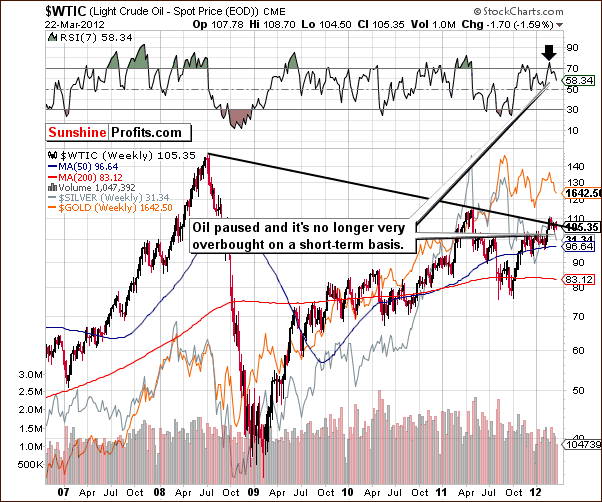
We now look at the crude oil price chart. A few weeks ago, we discussed the likelihood of a pause in the rising prices of crude oil. We stated in our March 2nd Premium Update that “crude oil prices reached an important resistance line this week. A pause is likely in the rising price trend. Once we see a consolidation, there will likely be a breakout followed by another price rally. It does appear that a consolidation is likely to be seen first, however.”
We expected prices to eventually move higher and we have now seen the expected period of consolidation. It appears that the time for higher prices is now. It could be the case where commodities and precious metals could move higher together, somewhat fueled by Ben Bernanke’s recent comments as well.
Summing up, crude oil prices have corrected relatively as we expected. The situation now appears bullish for the medium and long-term.
Gold and Silver Mining Stocks
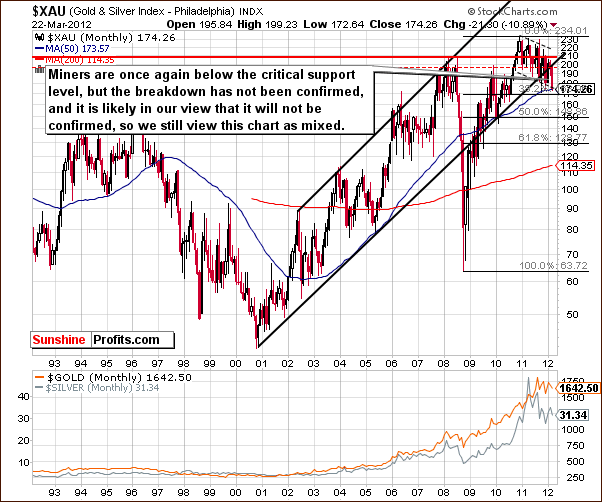
In this week’s very long-term XAU Index chart, the breakdown is still not confirmed. The miners remain above the medium-term support line but below the very long-term resistance line. Many more days below this line are needed before the breakdown is confirmed in this very long-term chart. Overall, the situation here remains mixed.
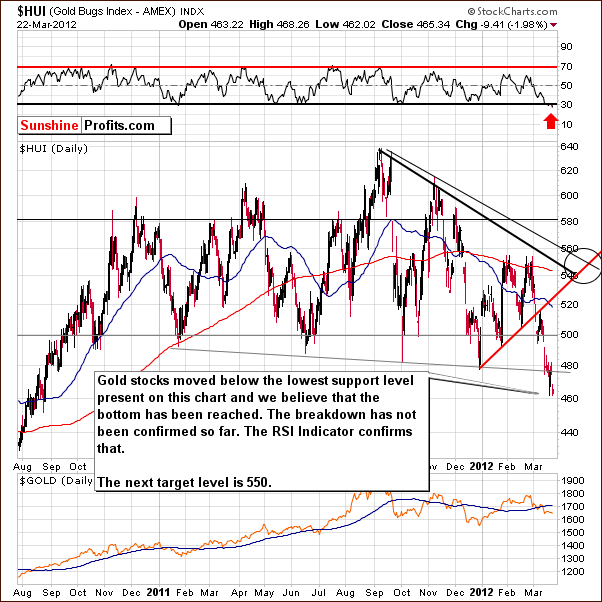
In this week’s medium-term HUI Index chart, we also have a breakdown which has not been confirmed. The first attempt was immediately invalidated and it appears that a second attempt is likely to be unsuccessful as well. This is based on RSI levels and the situation in gold. The target level to the upside remains at 550.
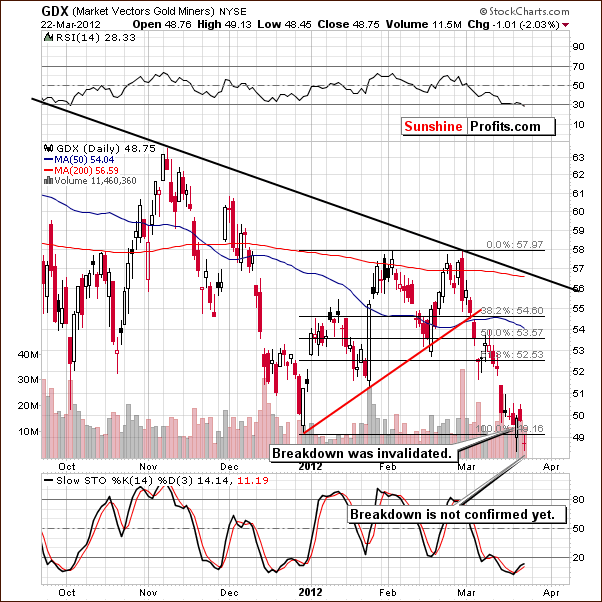
In the GDX chart this week, we see further evidence that the breakdown has not been confirmed. Prices moved below the previous low temporarily and are now there once again but this is not viewed as a confirmation. The breakdown is simply not in and the situation is still bullish right now. The RSI level remains oversold and below 30 as well.
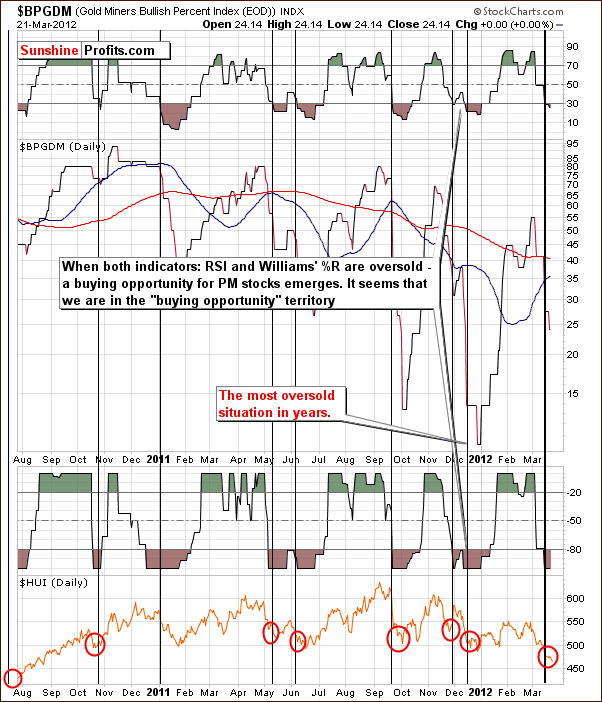
In the Gold Miners Bullish Percent Index chart, we see that the two important indicators, the RSI and Williams’ %R are both below oversold levels. This has been a very reliable indicator pointing to a bottom being seen very soon situation. These signs have been in place for several days now, so the suggestion is that the bottom is in or very, very close.
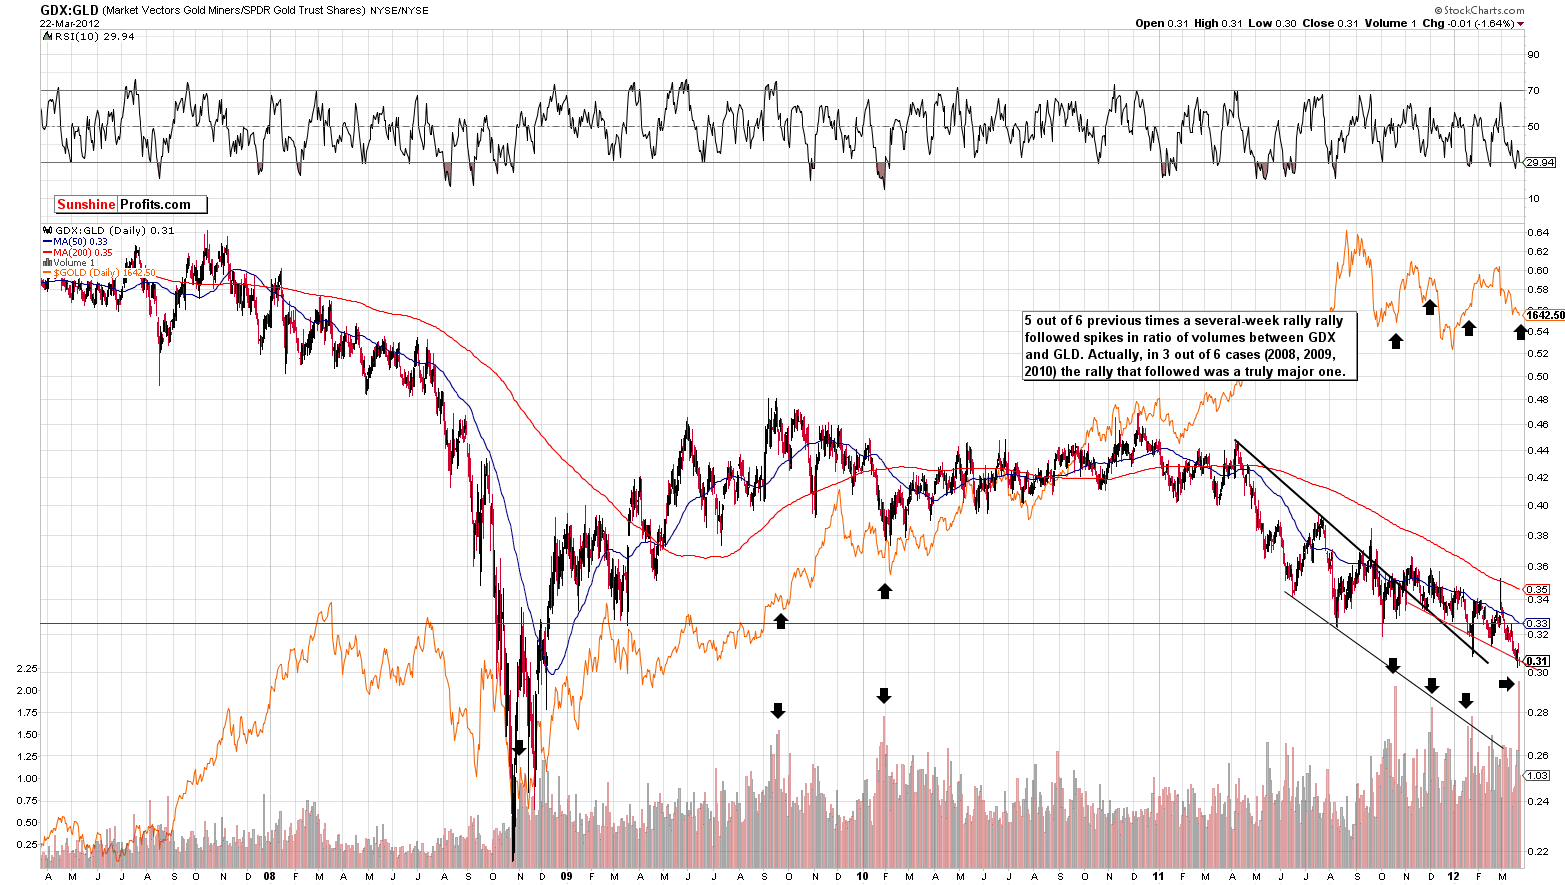
In the gold miners to gold ratio chart (please click the above chart to enlarge), we are going to take a slightly different approach this week. Instead of focusing on the poor performance of mining stocks relative to gold, we will analysis their volume levels with respect to those of the GLD ETF. Here we see an extraordinary event in this ratio. The gold mining stock volume has been exceptionally high as compared to that of the GLD ETF.
This type of situation has only been seen a few times in the past and in five of the six previous times, a rally of at least a few weeks duration followed. The one exception was in December 2011. At that time, a rally had just been seen and the RSI level was well above 50, so the situation was overall quite different from other cases.
In the other five instances, rallies of at least a few weeks duration followed, including three major rallies. These were the rallies which followed the 2008 bottom, the September-October 2009 bottom, and the post correction rally in early 2010.
Summing up, the situation doesn’t look too encouraging for gold and silver mining stock investors at first glance. However, taking into account volume spikes and the reliable Gold Miners Bullish Percent Index, a fairly bullish picture emerges. While not as bullish here as is the outlook for gold, it still seems that the whole precious metals sector could very well rally together in the very near term.
SP Indicators
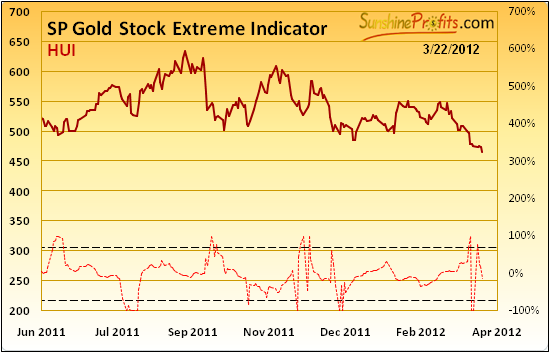
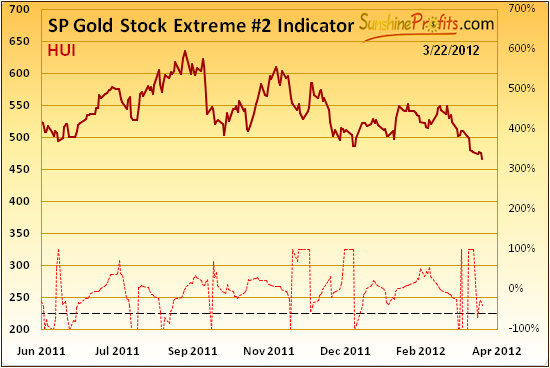
We feature our two SP Gold Stock Extreme Indicator charts once again. We have seen multiple signals from each chart for some time now and this provides further confirmation of a bottom formation for gold. The implications here have been and remain very bullish. What we said in last week’s Premium Update remains accurate and up-to-date:
In the SP Gold Stock Extreme Indicator, we see a very bullish signal as the indicator has moved through the upper dotted line. This indicator has been very good at spotting short term and medium term bottoms since 2008. It has in fact been 100% accurate – a bottom formed each time shortly or immediately after the indicator moved above the upper dotted line. This reassures us that being on the long side of the precious metals market is a good place to be right now.
Letters from Subscribers
Q: I notice that there is a DOUBLE EXTREME indicator on two consecutive days. Does the second DOUBLE EXTREME indicator cancel out the first, or change the trend in any way?
A: We interpret it as a confirmation that we are still in an "extreme" situation. Please note that this indicator is generally dedicated to spotting short- and medium-term bottoms in mining stocks, and works on gold and silver anyway, because they are so closely tied to them, at least in the short term. Consequently, when looking at the signal and estimating if it's a buy or sell signal please take into account the previous move in the miners. Without a doubt, the recent move in miners was down, so we view the signals as bullish.
Q: As has been the case for some time, the miners respond more quickly to a drop in spot gold than a rise. Moreover, they never seem to fully recover, no matter the change in sentiment. (See, for example, where GDX/spot gold was in 2008, and where it is today; also, just recently, where GDX was at gold 1650, GDX's subsequent drop to about $50, and its failure to recover even as gold has moved back above the 1650 level). And this has continued, even as the general market has moved up. The bottom line is, the miners have done more than continually lagged, they have continually lost ground.
So would you agree that the miners are good at best for short term trades, but poor for long term investments?
Could you comment on the fact that your target for spot gold is 1900+, while the HUI target is only 550? Why isn’t the HUI target higher, and is it time to bail on the miners, at least for gold? It seems that, for whatever reason, the miners are increasingly not the way to go.
A: Right now, we are concerned about miners’ long-term performance relative to both gold and the main stock indices. With gold and silver moving higher, miners will likely move higher as well. They might finally catch up now, or they may have simply entered a bear market relative to gold. At this point there's not enough evidence for that. However, if miners are lagging after gold, and stocks move above their previous highs, then we will most likely suggest at least considerably limiting long-term exposure to the mining sector. That is not the case yet.
Q: Regarding the relationship between gold ETFs and gold bullion in terms of price fluctuations: it seems that as long as they are both in tandem, the price of bullion gold can be manipulated easily and is also subject to wide swings based upon market fear, etc. Will the true current value of gold only occur when the two act separately and if so, when will that happen?
A: There is not much of a connection between gold and related ETFs (and derivatives), other than the ease of investing and access to information. Even if people dealt with pure physical metals, but they were able to do so quickly, conveniently and while informed about past transactions' prices, we would still have wide price swings. Sure, more ways to invest (ETFs, ETNs, CFDs, other derivatives) make these short-term trends more important, but eliminating these vehicles would not eliminate price fluctuations, as the prime reason for them is investors’ emotionality, and that's a factor that will never go away.
The value of gold/silver can trade differently from related assets only when the current financial system collapses or when it's very close to doing so. Until that time, any differences in pricing will be largely eliminated through arbitrage. The bottom line is, buy some physical gold and silver in case the system collapses, but don't limit your portfolio to just these assets because it will likely make you miss out on many profit opportunities.
Q: When you said in the March 6th alert, "traders should prepare themselves emotionally for the scenario in which metals move temporarily lower for a few days and then form a bottom," could you name a likely bottom figure for silver? It's been more than a few days (two business weeks, in fact, since the Monday buy alert), and the downside doesn't seem to be relenting. Every move up is countered by a move down at twice the strength. I'm "emotionally" cool with the scenario, but margin calls do come eventually if the price keeps dropping.
A: We continue to believe that metals are either right at the bottom or very close to it. With gold above $1,600 and silver above $30, the situation will remain bullish unless something major happens (breakdown on huge volume, for instance – in which case we would let you know our thoughts via Market Alert). Please note that metals didn't rally yet, but they didn't move much lower in the past weeks either. The upside potential is still much greater than the downside risk.
On a side note, with respect to silver and using derivatives, since the white metal is known for its short-term volatility and the tendency to take just "one more sharp dive" before soaring, it might be a good idea to use options instead of futures, if you have decided to use derivatives.
Q: How long do you think the bull market in precious metals will last? Also, what would be a good exit strategy? I've suffered a lot of losses during 2011 and am in the red overall. I am wondering if I have time to make it back going forward. I live in Canada and I need to navigate the currency trade when I sell and with the US dollar losing value, it gets worse day by day!
A: We believe the end of the bull market in precious metals is at least 2 years away (95% probability in our view) and probably more than 4 years (70% in our view).
In any case, we expect gold to move above $5,000 before topping out and we expect to see silver well above $200. We also expect prices to rise in all currencies, so it seems that you will have plenty of time to get your money back from the market and make a lot more before the bull market is over. Please note that most investors should trade only a part of their capital and use most for long-term investments.
Q: In 2006-07 there was a big expectation of inflation and commodities took off. Pinetree Capital, representing a lot of stocks on the CDNX in precious metals, uranium, and oil and gas,went way up. Do you see the same thing unfolding now?
A: Generally yes, however not necessarily to the same extent. The upswing in Pinetree Capital doesn't have to be as big as the one in 2007.
Q: Why do the weekly chart formations look so different from the daily ones for the mining stocks and even for the metals themselves on www.stockcharts.com? To me, the weeklies really more resemble some sort of high-level consolidation (albeit short-term). If this is the case, maybe it is more of a buying opportunity than if you focus on the daily charts.
A: Generally, long-term charts provide you with long-term price projections and price paths. Short-term charts provide you with short-term price projections and price paths. We agree that the long-term charts suggest that the declines we've seen recently are all consolidations within a bigger uptrend.
Q: It feels like the same prelaunch pattern we've seen over the last ten years. In late 2008 I tried to convince myself that the same pattern was forming, only a bit bent out of shape – bit of a mistake.
It is kind of hard to see on the 10 year chart. What is the best way for me to view the chart with a logarithmic vertical scale? And can you recommend a timeframe for going long on some options at this point? (Obviously I would only do this with capital I can afford to lose.)
A: Well, the situation in late 2008 was very different from where we are today. The stock market had already been declining for many months, and right now we are in the wake of a sizable rally. The situation in the USD Index is also different today.
We suggest using a logarithmic scale, especially in the case of long-term charts (like a 10-year one).
If we had to choose a single set of options, May options appear appropriate to bet on the probable move up in the precious metals sector. Please note that we have 3 tools dedicated to options in the Tools section: The Option Pricing Model, Position Size Calculator (how to diversify between timeframes) and Pyramid Optimizer (also helps choosing optimal strike price).
Summary
The USD Index has been consolidating in the past week and the same has been seen in the general stock market. Once this consolidation is complete, it seems most likely that the USD Index will move lower and stocks in general will move to the upside.
It now seems best for precious metals investors to focus on the gold and silver markets themselves as well as those for the gold and silver mining stocks – the biggest weight should be put to the analysis of gold in our opinion. Based on our experience, it appears that this is the best way to analyze precious metals today in order to determine the most probable price paths which are ahead.
In the gold market, the self-similar pattern continues and gold prices appear to be at or very close to a local bottom. Since the yellow metal is closely tied to silver and the gold and silver mining stocks on a short-term basis, local bottoms are probably imminent in these other precious metals market segments as well. It seems that long speculative and long-term investment positions are well justified at this time.
Target levels remain as they have been for the past two weeks: $1,900 to $1,920 for spot gold, $40 to $45 for spot silver, and 550 for the HUI Index.
This completes this week’s Premium Update. Our next Premium Update is scheduled for Friday, March 30, 2012.
Thank you for using the Premium Service. Have a profitable week and a great weekend!
Przemyslaw Radomski

