
If you don't see charts in the essay below, please try accessing the PDF version by clicking here.
The roller coaster metaphor we used two weeks ago after the $90 flash crash in the price of gold seems appropriate this week as well. It must be tough out there for precious metals investors. Wednesday gold futures tumbled again. April-delivery gold fell $51.30, or three per cent, to settle at $1,642.90 an ounce, the lowest gold settlement price in more than eight weeks. The dollar strengthened and traders reacted to the U.S. Federal Reserve’s rate decision and policy statement in the previous session which buried any hopes for now of more monetary easing in the short term. Investors have been hoping that the Fed would take action again to spur the economy. The last round of quantitative easing, known as QE2, weakened the US dollar and sent gold prices sharply higher. After the market closed Tuesday, the Fed's upbeat comments about the US labor market dimmed hopes of further stimulus. Also Tuesday afternoon J.P. Morgan announced it had passed the government's stress testing and was declaring a dividend as well as paying back a big chunk of government loans. Most of the largest U.S. banks passed their annual stress test, underscoring the recovery of the U.S. financial sector. The U.S. dollar index traded higher Wednesday, hitting a fresh seven-week high, also bearish for the precious metals markets. Year to date, gold is still up 5 percent.
Sunshine Profits subscribers should have a much less queasy stomach. A day before the flash crash we sent out a Market Alert to stay out of the speculative long-term positions saving them from the gut-wrenching drop. And when we sent out another Market Alert with a buy signal on March 6th it was with a caveat – to be prepared emotionally for the scenario in which metals move temporarily lower for a few days and then form a bottom. We believe the price action of the past few days could be that the final bottom for this decline has already been reached, or, is very, very close to it.
Gold's sharp move lower will most likely spark demand from emerging markets such as India and China as buyers will come in lured by lower prices.
Interestingly, platinum out-performed gold and maintained a premium over gold for the first time since September, reverting back to the “norm” where historically (for the past 20 years) platinum trades higher than gold. Happily, we had previously suggested you to switch part of your holdings from gold to platinum.
About five years ago, platinum was worth about twice as much as gold. Platinum is 30 times more rare than gold and is more expensive to produce. Historically, gold has traded at 80% to 100% of the platinum price. The percentage fell in the 1990s to about 44% by 2000 when gold bottomed and generally stayed in the 40% to 60% range. It has traded at a discount to gold in the last six months with the spread rising to about $220/oz in December. In addition to being the rarer metal, platinum has industrial uses besides its role in jewelry. It recently rallied following a weeks-long strike at a top mine in South Africa.
According to a Bloomberg survey at a precious metals conference this week, gold is poised for a 21 percent gain in 2012, extending its bull market to 12 consecutive years. Bullion may rise to $1,897 an ounce in New York by Dec. 31 from $1,566.80 at the end of 2011.
They have plenty of reasons for optimism, despite the recent drops in price. Demand for gold has strengthened as Europe seeks to contain its debt crisis and China has displayed a growing appetite for gold. Governments have kept interest rates at all-time lows to shore up growth. Central banks have been net buyers for three straight years, the longest stretch since 1973, according to World Gold Council data.
They are not the only ones optimistic about gold. The specter of inflation is making some turn to the yellow metal.
“By the time inflation becomes evident,”says Paul Johnson of the $14 billion Paulson & Co. hedge funds, “gold will probably have moved, which implies that now is the time to build a position.”
And just recently the Islamic Republic News Agency reported that Iran would begin accepting payments from its trading partners in gold. This move further reinforces the universal currency and store of value aspects of the metal. Iran already allows its trade partners to pay in their native currencies. It has also accepted payment in the form of goods from both India and China. It will now take payment in gold.
If you have ever wondered where the SPDR Gold Trust ETF (GLD) keeps all its bullion, you might want to take a look this video. Click here to watch. Note – we still believe that GLD is not the best way to own the physical gold, especially for the long term. Let’s turn to the technical portion with analysis of the USD Index. We will start with the long-term chart (charts courtesy by http://stockcharts.com.)
USD Index
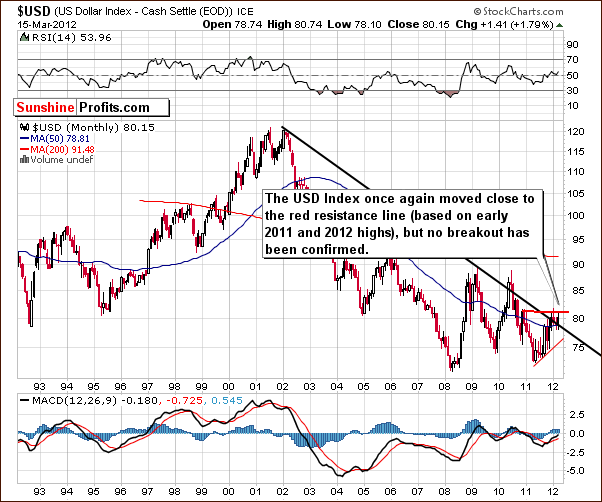
Our first chart this week is the very long-term USD Index chart. There have been some slight changes this week as the index level has touched the horizontal red line in our chart created by the early 2011 and 2012 highs. Prices then reversed and no breakout above this level was seen.
Concerning the long-term declining resistance line, prices have moved just above it but the breakout is not yet truly in. Prices would have to close the week and hold above this line for two more weeks for this breakout to be confirmed. Overall, the situation remains mixed here.
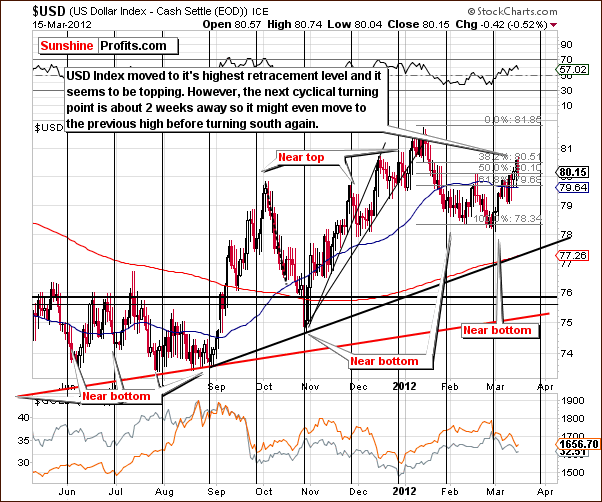
In the short-term USD Index chart, a correction is seen to the highest Fibonacci retracement level of the previous decline. It appears that a top is about to form. Prices could move a bit higher, though any significant increase seems unlikely, and the 2012 high will probably not be reached. Perhaps some sideways trading and then some declines will precede the next cyclical turning point which is about two weeks away.
Summing up, the USD Index situation is unclear for the short term and bearish for the medium term.
General Stock Market
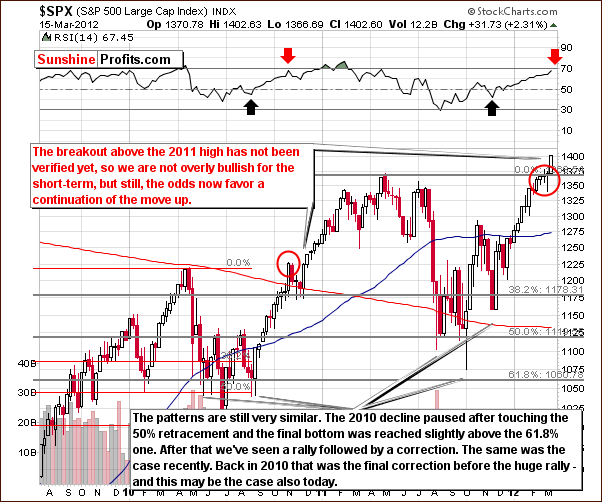
In the long-term S&P 500 Index chart, a significant rally was seen this week after last week’s period of consolidation. In last week’s Premium Update, we stated “We are not certain if the correction is over or if another move to the downside is coming or will stocks rally right away.”
We may not see any further consolidation at this time. Compared to 2010, much higher prices are possible before the next correction. On the other hand, we have not really seen any correction as significant as the one in 2010 and the current correction is not even visible in RSI levels. It seems therefore that more consolidation is possible here before the rally continues.
Overall, the situation is more bullish than last week but we still have a bit of caution. This is because the breakout has not yet been confirmed and two more weeks above the 2011 highs are needed before we are convinced that a big rally is likely to be seen soon. Of course, if stocks rally immediately from where they are today, the two more weeks issue will no longer matter.
Summing up, the short-term situation in the general stock market is a bit more bullish than was the case last week. It seems best described as moderately bullish.
Correlation Matrix
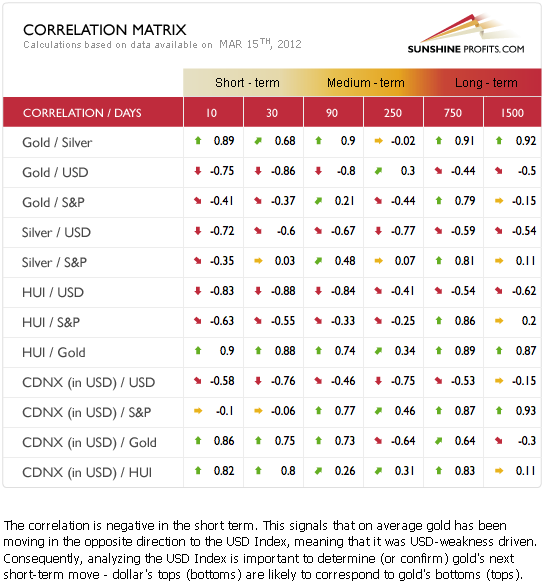
The Correlation Matrix is a tool which we have developed to analyze the impact of the currency markets and the general stock market upon the precious metals sector. The correlation between the general stock market and precious metals now appears to be negative to neutral, and this is generally not the case, especially given the past three months.
The general stock market simply does not appear too important for gold, silver and the gold and silver mining stocks in the short run. However, it does seem to matter for platinum (not visible in the above table), which has performed relatively well compared to the other metals.
The strong negative correlation between the USD Index and the precious metals continues. The implications appear bullish for the medium term and somewhat unclear for the short term.
Gold
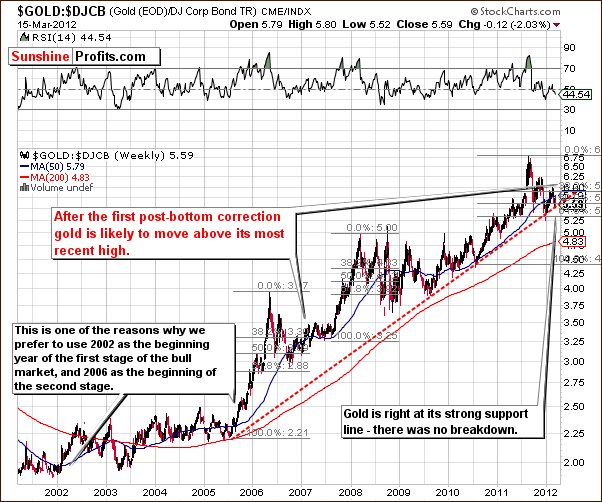
This week we begin our gold section with a look at the gold to bonds ratio. This provides us with the proper long-term perspective in viewing gold’s decline this week. Analysis of this chart suggests that the bullish trend definitely remains in place, as no breakdown has been seen below the long-term support line. Quite simply, the trend remains up.
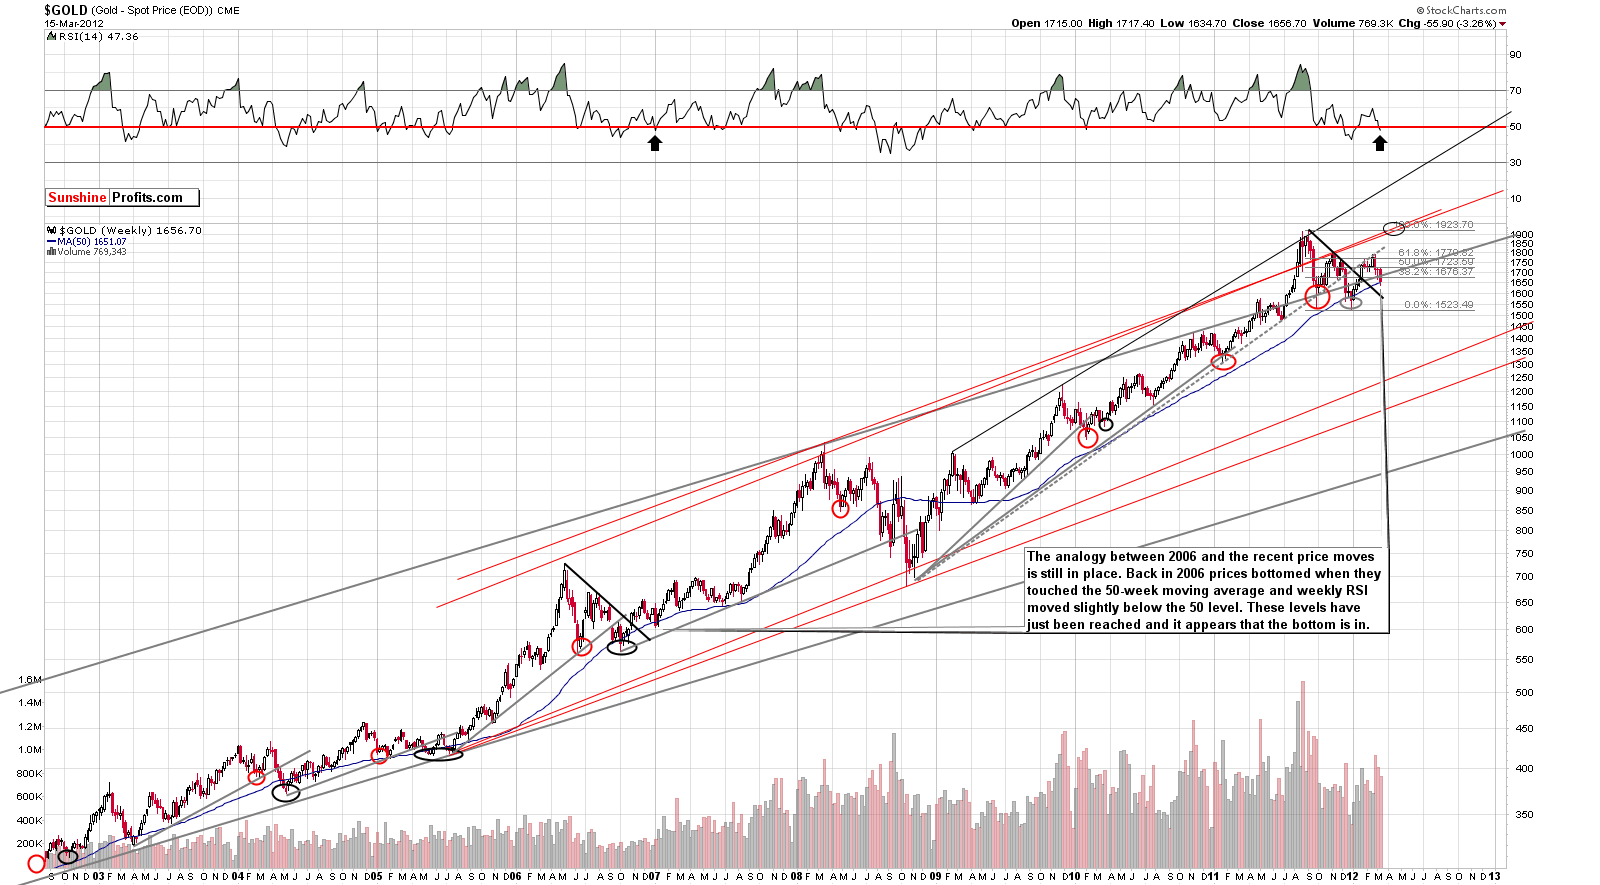
In the long-term chart for gold, we see that the important support level mentioned in last week’s Premium Update was reached this week. Quoting from last week:
This past week saw several important developments as gold’s price decline approached the 50-week moving average while the RSI level remained slightly above the 50 level. This is a bit ambiguous with respect to what likely seemed to be needed for the final bottom to form.
In the week since, gold’s price moved slightly below the 50-week moving average and has moved back above this level. In addition, the RSI moved below 50.
These two signs defined the final bottom seen in early 2007 and it appears that the current bottom is already in at this time. Also, the possible correction that we described last week appears to have happened already.
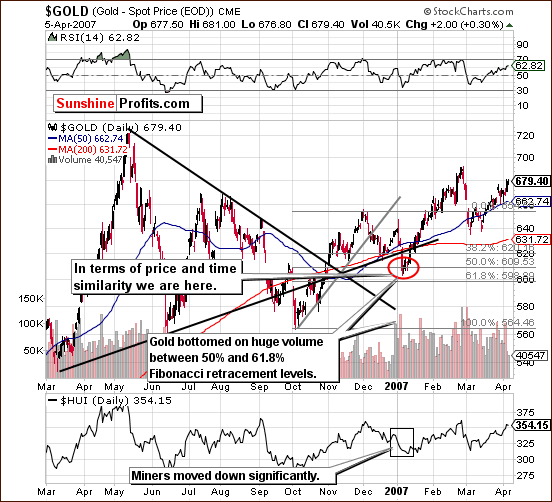
Taking a look at the chart from 2006-07, we see that the major bottom seen early in 2007 saw gold bottom half way between the 50% and 61.8% Fibonacci retracement levels. Huge volume levels also accompanied this local bottom. Furthermore, gold’s stock prices visibly declined at the same time and the RSI level moved close to but did not reach 30. Now let’s take a look at where we are today.
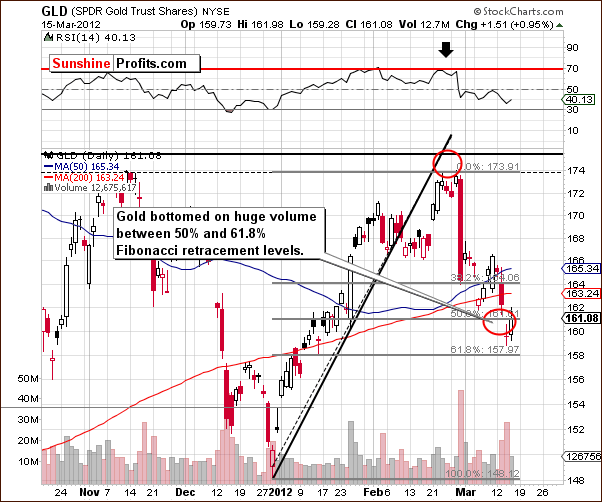
We now turn to the current short-term GLD ETF chart. Gold’s price has declined past the 50% Fibonacci retracement level but is still above the 61.8% level. In fact, on Wednesday, gold’s closing price was between the two and the bottom formed on significant volume. Also, the RSI level declined close to 30 and then moved back up. The situation is nearly identical to early 2007.
In our opinion, the striking similarities make our analysis this week quite reliable. Many factors are very much in tune and it is likely that this pattern will hold for the next couple of months. Keep in mind that it may take a week or so for the rally to really get underway.
Some might say that the bearish head-and-shoulders pattern is visible to some extent but a closer look reveals that this is not really the case. The shoulders are not really symmetrical. In early 2007, the pattern was even more visible and the target level based upon it was lower than the actual bottom that was formed. With the pattern less visible this time, and so many other factors aligned perfectly, it is likely that the bullish implications here will prevail.
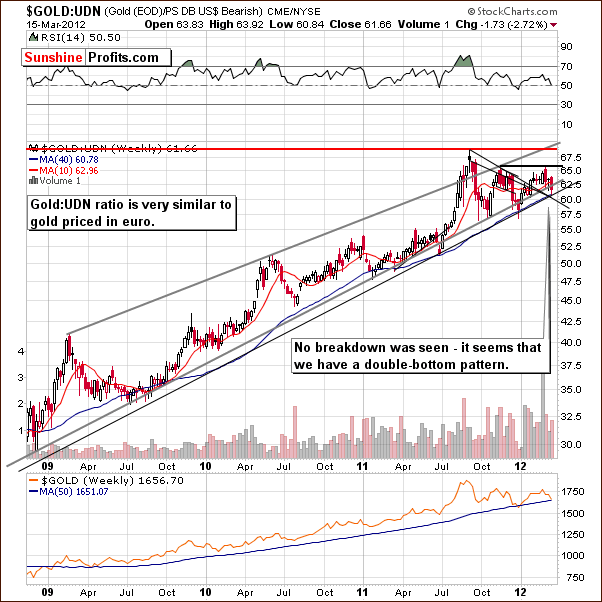
In this week’s chart of gold from a non-USD perspective, we have a confirmation of the bullish outlook we have seen in the previous charts. Another move to the downside target area, which was reached last week, has been seen and it’s likely that a double bottom will form and the ratio will then move higher. The breakout above the declining resistance line (based on 2011 tops) has been well verified and it seems that now is the time for the rally to begin.
Summing up, the situation in gold remains very bullish for both the short term and long term based on this week’s charts.
Silver
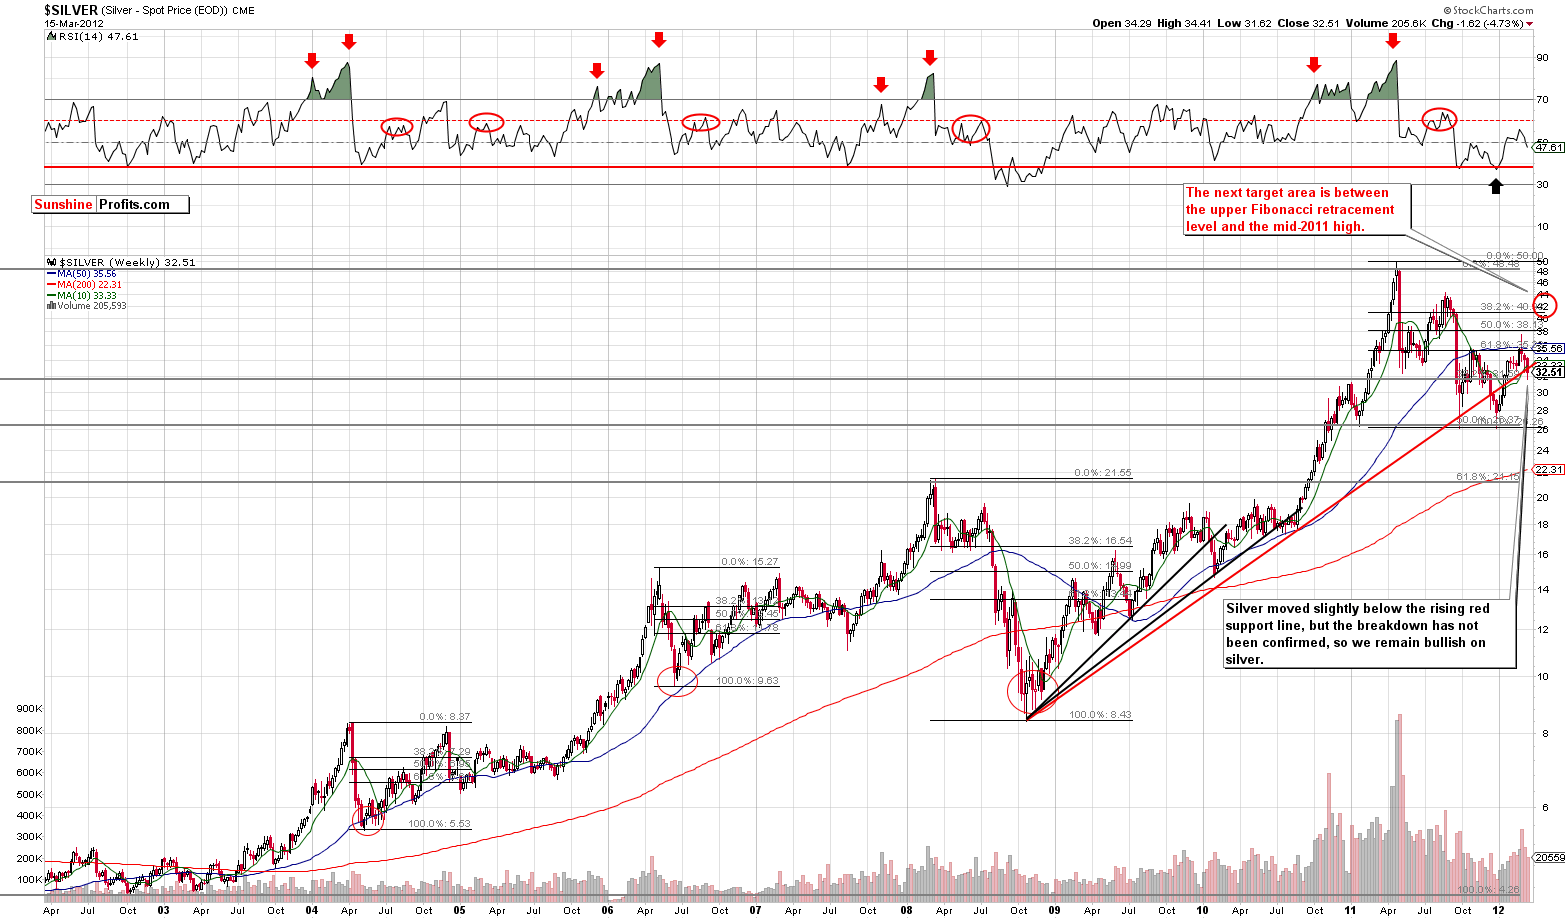
We begin this week’s silver section with a look at the long-term chart (please click the above chart to enlarge). There is little to add this week as our expectations for silver to follow gold are still very much in place. This week silver’s price moved slightly below the rising red support line and then reversed. The breakdown will only be confirmed if we see two more weeks below the previous support line. This is not likely to happen as we still expect silver’s price to move higher and surpass the $40 level.
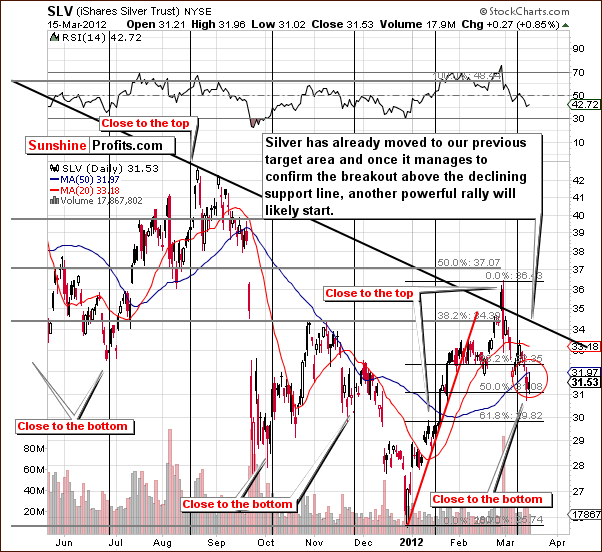
In the short term SLV ETF chart, we see that an apparent bottom has formed in the middle of the previous target area. Since silver as corrected in a way similar to gold, its final bottom is likely in as well. This being the case, when the true rally begins, silver’s price is not likely to pause in the $34 to $35 range. Prices could very well begin moving higher and continue all the way past $40.
Summing up, silver is likely to move higher in both the short term and the long term and follow trading patterns similar to that of gold.
Platinum
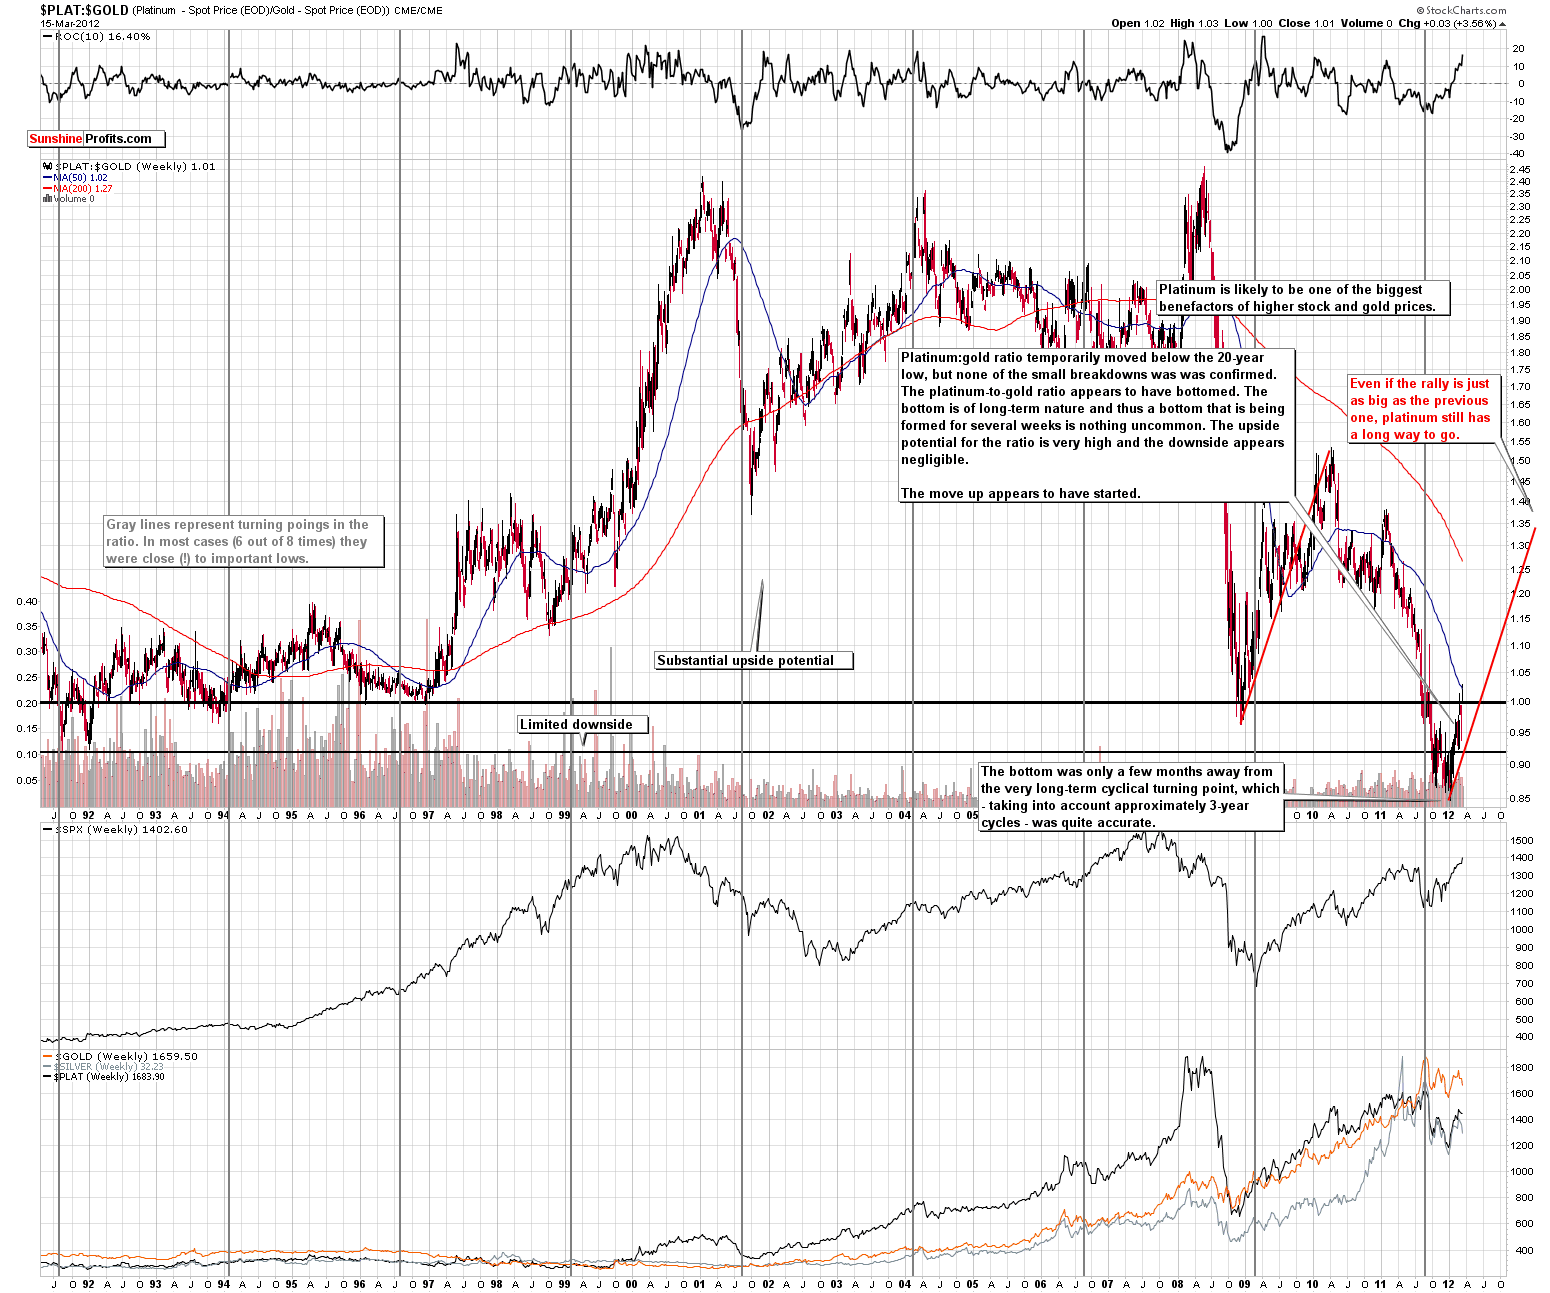
In the platinum to gold ratio chart (please click the above chart to enlarge) this week, we finally see the situation developing as we have described in previous updates. We now can see that platinum’s price has moved higher than gold for the first time in several months and for this reason, the ratio is now above 1. Several false breakdowns have been invalidated and platinum prices appear to be heading to the upside.
Even if the rally does not take platinum-gold ratio to its all-time highs and the rally is just as big as the one seen in late 2009 and early 2010, we still are in the early stages here and betting on higher long-term platinum prices appears to be a good way to go at this time. Short-run price deviations can be quite sharp but the important long-term trend will likely be steadily to the upside. Please note that with gold at $2000 and platinum-gold ratio at 1.3, the price for platinum would be $2,600 – over 50% higher than it is right now.
Summing up, it does not appear to be too late to enter the platinum market. We could say that the train has not left the station and its moving slow enough to jump on at this time.
Gold and Silver Mining Stocks
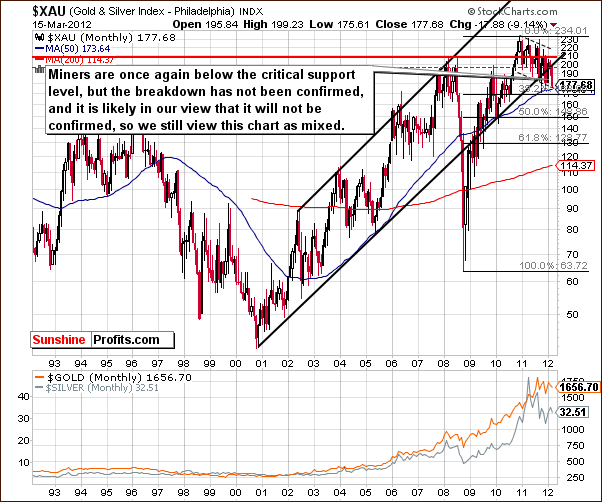
In this week’s very long-term XAU Index chart, we see that the index level has moved quite a ways down below the previous support line. Such moves have been invalidated many times in the past. The breakdown is therefore not truly in, and the situation here appears rather mixed.
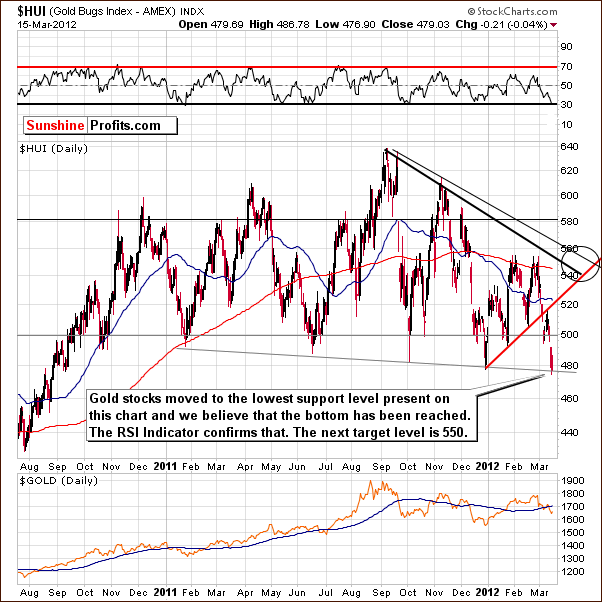
In this week’s long-term HUI Index chart, we see that the index declined heavily this week and compares favorably to the trends seen during the 2007 bottom when gold miners declined significantly as well.
The declines seen here this week have brought the index below the 500 level and to the lowest support line in this chart.
The bottom appears to be in and the RSI level at 30 confirms this. The next upside target level for this index is around 550, in a trading range where several resistance lines intersect. If gold prices move quickly and significantly higher, the gold stocks rally could be quite sharp as well.
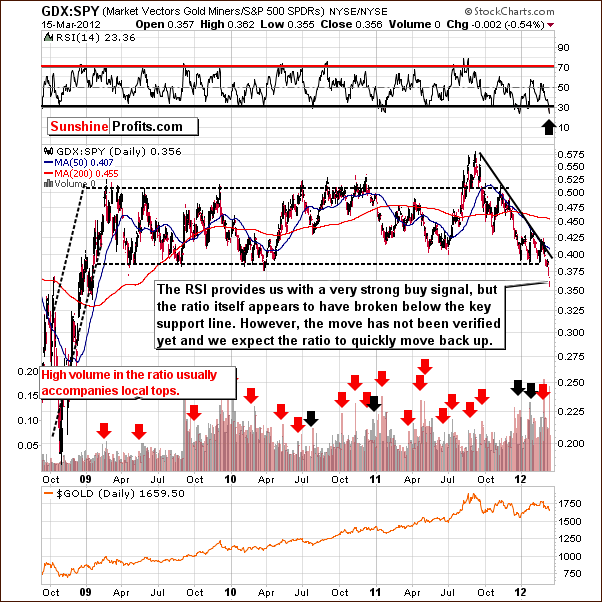
In the GDX:SPY ratio chart this week, a cautionary signal can be seen. While the RSI level gives us a strong buy signal, we also have a breakdown in the ratio itself. It is now below the level that has stopped several major declines in the past few years.
Due to the long-term nature of this ratio chart, a few more weeks below this level would be needed for it to have serious implications. This does not appear likely as the ratio will move higher when the miners begin their rally and this seems quite probable within the next week or two. If this does not develop as we expect, we will analyze this further and possibly discuss lower exposure to mining stocks and a move to gold and silver. Again, we don’t view the breakdown to be in yet and continue to be bullish for the short and long term for mining stocks in general.
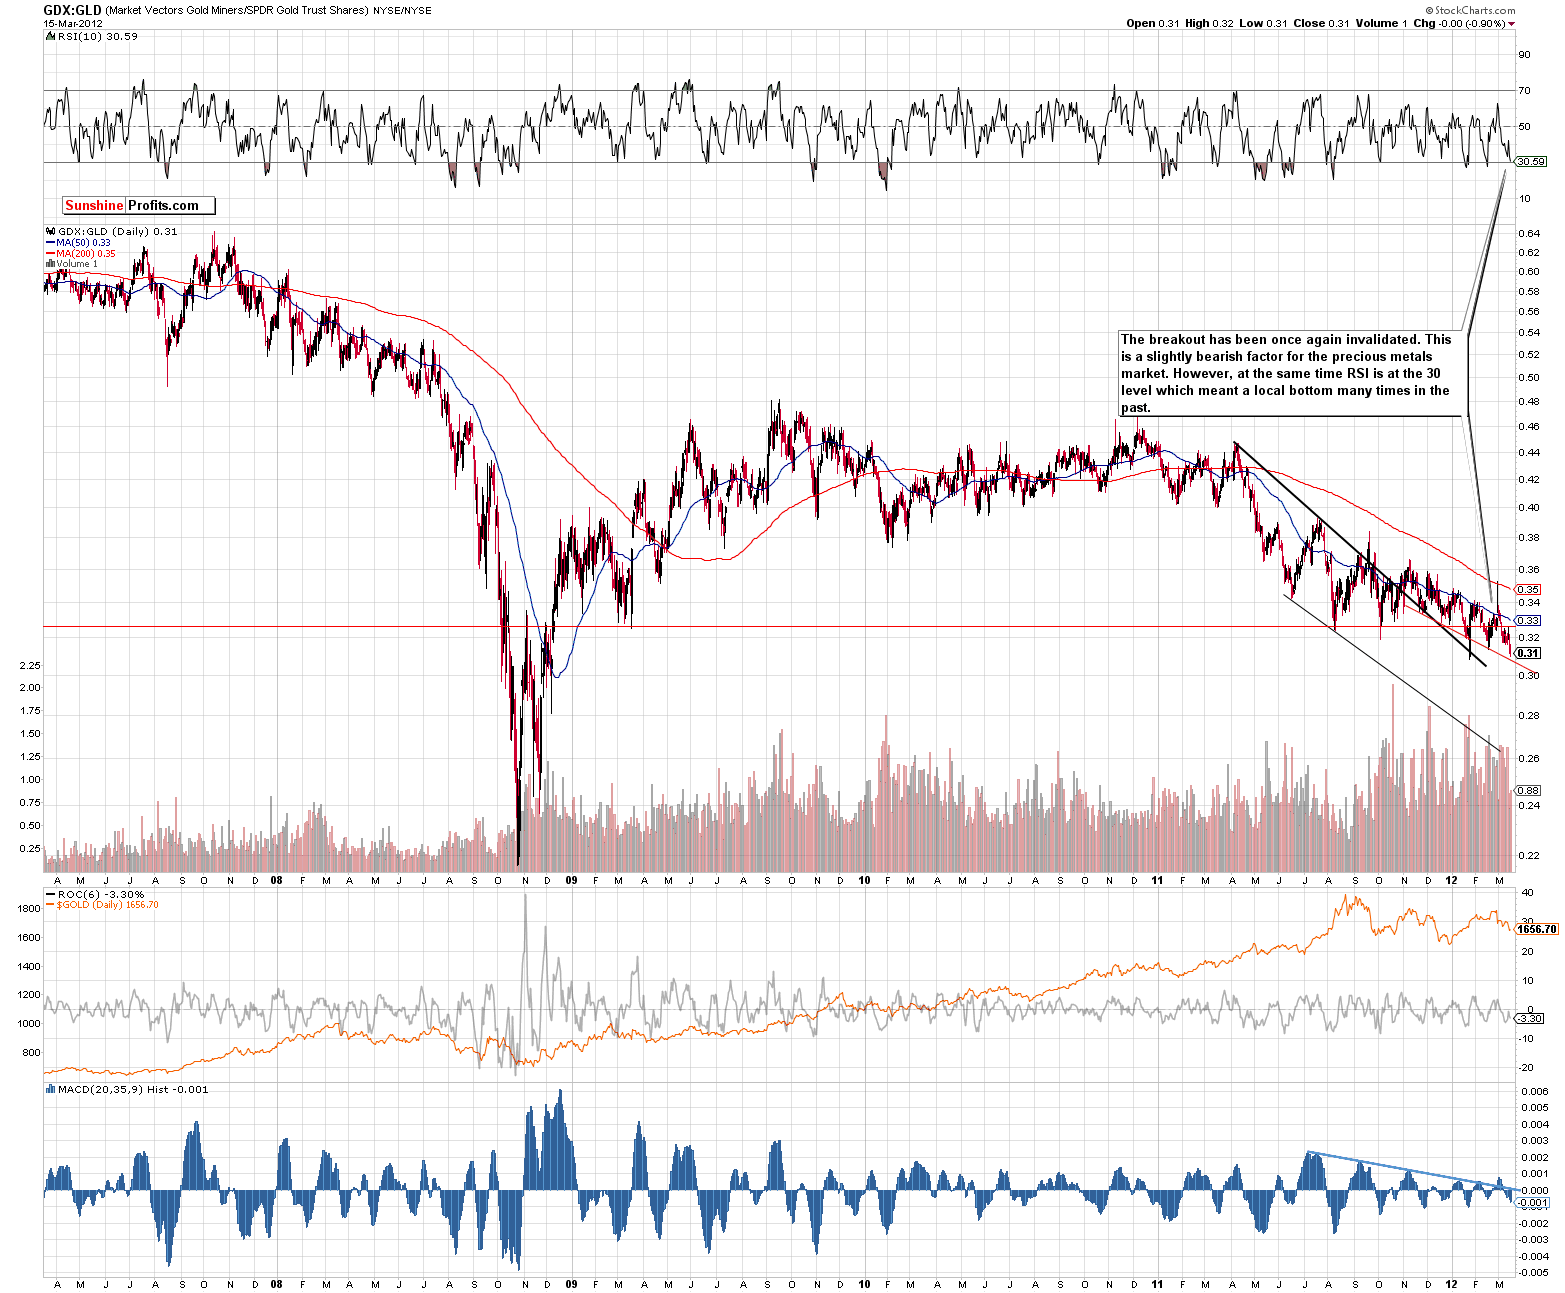
In the gold miners to gold ratio chart which shows the performance of mining stocks relative to gold, we see a performance which is not so good this month. The recent breakout was not confirmed and such a move needs to be seen in order to increase our confidence in the mining stocks. Only then will we become more optimistic here.
No breakout has been confirmed although the ratio has moved lower and is at its own support line. The RSI suggests a buying opportunity. All in all, the situation appears bullish for the short term and mixed for the long term.
Summing up, the short term appears bullish but this week some long-term cautionary factors have emerged. The situation is still bullish, but special attention to the mining stock analysis with respect to other market segments seems justified – we will keep you informed.
Sunshine Profits Indicators
The first point that we would like to make here is that the long-term buy signal from the SP Gold Bottom Indicator is still in place. Its implications are long term and the decline in gold prices this week did not invalidate it in any way.
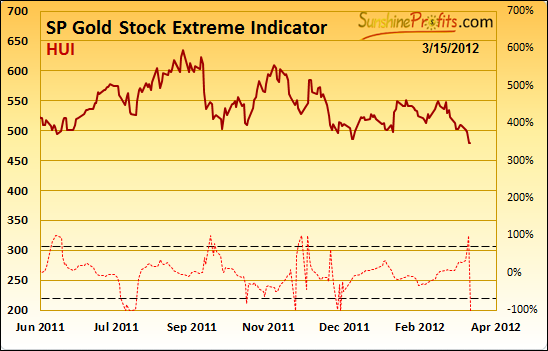
Additionally, in the SP Gold Stock Extreme Indicator, we see a very bullish signal as the indicator has moved through the upper dotted line. This indicator has been very good at spotting short term and medium term bottoms since 2008. It has in fact been 100% accurate – a bottom formed each time shortly or immediately after the indicator moved above the upper dotted line. This reassures us that being on the long side of the precious metals market is a good place to be right now.
Letters from Subscribers
Q: Regardless of the self-similarity patterns (which is not the most scientific tool out there), is there any chance that we currently see the beginning of the situation similar to what was seen in Sep-Dec 2011?
Additionally, what about the price seasonality? March-April is generally weak for the precious metals… Maybe the predicted rally will materialize so sooner than in April-May – during metal’s stronger months?
A: Naturally, self-similar patterns (just like any other chart pattern) are not scientific at all (but we are working on making them scientific, stay tuned) as they are not (as Karl Popper indicated) falsifiable. They are subjective and very much analyst-dependent and detecting these patterns is somewhere between art and science. However, that’s not the most important thing here. The most important thing in our view is simply that they work and are extremely useful as they provide both: price and time projections that – if previous patterns are really aligned – play out very well.
Is there any chance that gold will move even lower like in Dec 2011? Of course – there are no sure bets. At this time we view the chance of moving higher from here at about 80%, so there’s 20% for a significant move lower before the main trend resumes.
Seasonality – a picture can tell a thousand words, so let’s take a look.
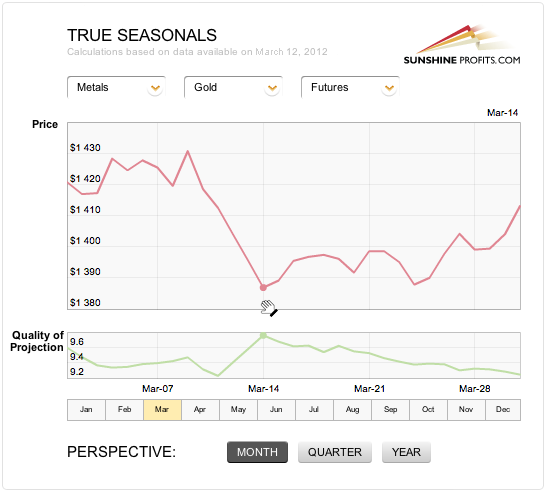
Please focus on the shape of the red line vs. dates instead of the prices on the vertical axis’ legend (technical glitch). While it is true that March is generally a weak month for metals, please note that the weakness is concentrated in the first half of the month and this impacts the whole March-April period. In fact, April is moderately-favorable month.
The most interesting part is that according to the True Seasonal (taking into account options’ and futures’ expirations as well as simple seasonalities) pattern, the bottom was likely to be seen on March 14th… Precisely when gold appears to have reached the bottom. Please note that the quality of projection measure on the chart is quite high for this date, meaning that the probability of bottom being in close to this date is high.
Q: When J.P. Morgan/ Chase (a Rockefeller/ Trilateral Commission/ Council on Foreign Relations group) short gold and silver the way they did, call it what you may, it's manipulation in what is supposed to be a free market! If I were in your shoes, the last thing I would want is to make “them” angry at me. The “ouch” factor from the T.C./C.F.R. folks could be very unpleasant.
A: Thank you for your support. Our approach is to be prepared for various outcomes and that's why we urge everyone to have some physical gold and/or silver that can be used as a safety belt or parachute – just in case everything else fails.
Q: I have two questions:
1.)Although the SP Long Term Junior Indicator says "Hold Seniors" how do I interpret that? Does it mean “switch your holdings from juniors and buy seniors” or just “HOLD seniors,” as in, if you have seniors, don't buy or sell them, just continue holding them?
2) SP Gold Extreme #2 indicator: The word “Extreme”–does this mean the HUI has reached an extreme position short-term, either top or bottom? If so, is it saying we've reached or are close to the end of a correction, in other words, that we should buy juniors?
A: The key issue that you need to keep in mind is the fact that we suggest dividing one's capital into long-term investments and short-term trading capital. The Long-term Junior Indicator is an indicator dedicated to long-term investments. We believe that this part of one's capital should be in the precious metals market at almost all times. However, we observed that juniors tend to lag seniors at some times and lap them at other times. Consequently, by switching from one asset class to the other, one can make money while remaining invested in the precious metals sector.
This is what the SP Long Term Junior Indicator is striving to help you with. The “switch from seniors to juniors” signal is seen when the indicator is below the lower dashed line and starts to move higher. Conversely, when the indicator is above the upper dashed line, and it starts to move lower, we see a "move from juniors to seniors" signal. Technically, this is what we saw, but the indicator moved lower very insignificantly and then continued its rally, so we don't view this signal as being truly in. That's why we continue to favor juniors over seniors for the time being. Another important thing to watch in order to time these switches is the general stock market, as it is particularly highly correlated with juniors. With a bullish picture for the stock market in the medium-term, we see juniors outperforming seniors.
Now, moving on to the "Extreme" indicators, you are correct that these signals mean an extreme position, either top or bottom. However, in the past year or so, almost all signals meant local bottoms. You are also correct to view the current signals as buy signals. Still, it's not about juniors because we view juniors as a long-term investment vehicle, not a short-term trading one. In other words, it's time to bet on higher precious metals prices from the long- and short-term point of view. While juniors are a good way to invest in the precious metals sector for the long run, we suggest using other means (gold, silver, senior mining stocks) for short-term trades.
Q: Can you please verify this and advise if the long positions for gold should be kept open? Is the call to go long too early? Thanks.
A: Thank you for the question. We've checked the essays, but there are really no arguments for gold's decline. There is a chart that shows a downtrend based on two tops and two bottoms and nothing else. Our broad analysis, including the analysis of self-similar patterns, suggests that these patterns will break to the upside more or less at the current time.
Q: Is it better to buy gold stocks and gold miners like GTU, CEF, GLD, GG and RGLD than to buy spot gold which is now around 1,650?
A: It depends if you meant long-term investments or short-term trading. In the former case - we don't have enough information about your portfolio to tell which is more appropriate. In the latter case, it seems that diversifying between gold and miners would be a good idea.
Q: I wonder if you would comment on whether AAPL:GLD yields a good ratio to use to buy either of the two. You use GDX:SPY in your analysis. Thanks.
A: This ratio is indeed interesting, however the main force driving it is not the price of gold, but the price of the Apple (AAPL) stock. Since we focus on the precious metals market and specialize in techniques relating to it, we don't think we can really comment on AAPL's performance in any way other than to say the company's fundamental analysis appears to justify its current price, but from a technical point of view, the stock looks very overbought in the short term.
There is no psychological mechanism that we can think of that could be isolated through the analysis of this ratio (which is also the case with GDX:SPY), so it does not seem that it adds insight to our analysis of the precious metals sector.
Q: Gold confiscation – any thoughts?
A: In general we see gold confiscation possible, but unlikely. Currently the US government can print enough paper money to simply buy gold from the market. However, in 1933 President Franklin Delano Roosevelt signed Executive Order 6102, "The Gold Confiscation Act," and for the next forty-one years it was illegal for U.S. citizens to "hoard" gold, so it wouldn't be the first time.
Some say “better safe than sorry” and we concur. So, it seems prudent to geographically diversify your assets. Allocating your holdings within different countries makes you less vulnerable to a possible gold and silver trading ban. Of course, it should be done with respect to the law.
If you have your physical gold/silver secure and speculate only with the capital that you can afford to lose, then you shouldn’t get too worried.
Q: I note that there are bearish engulfing candles appearing and confirmation of that today in terms of price action. If you were following this type of pattern, would Sunshine Profits have sent out a sell or close long positions alert?
Candle patterns are closely followed and do give good results as evidenced by price action today. Subscribers are holding long positions and waiting for a close alert to be sent out. I estimate that $1,618 could be achieved based on a Fibonacci retracement method or perhaps 100%retracementat $1,524.
A: We believed that the biggest risk was to be out of the market because of the implications of the self-similar patterns that are in place. There were bearish signals from candlesticks but there were also bullish signals present and in our view it was best to stay long and wait for either an immediate move up or endure the short-term decline and then ride the upswing. This approach ensured that we wouldn’t miss the rally just in case it started without an additional correction.
Note that we are not day-traders as we do not aim to catch the immediate-term moves. We might mention taking such positions every now and then, but this is not something that we recommend for most investors/traders.
Q: I bet you were sweating a bit over this - I thought you'd got it wrong, but (depending on the rest of today and maybe tomorrow) it's looking as though you've pulled it off. Many Congratulations (and fingers crossed)
One last thing, please, I'm not asking for advice but I'm so busy buying I don't have time to look up the best platinum plays ETFs or ETNs? An idea or two would come in handy. Would you recommend a bullion ETF of shares ETF ( or a single stock play) eg PLTM or PPLT???
A: Thank you for your kind words. PHPT (ETFS Physical Platinum ETF), in our view, is the best option for those looking for Platinum ETFs – for both: long term and short term. For long term investors, the fact that PHPT is physically backed is reason enough to consider it not only in the platinum space, but a good instrument in the overall precious metals segment. PHPT has high liquidity and years of market presence. Reasonable costs and tracking error also make PHPT a competitive ETF tool for the precious metals investor.
However, for long-term investors, PPLT is a good alternative. PPLT measures the same as PHPT in terms of key attributes such as liquidity and physical backing, but lags behind marginally because it is relatively new and does not boast of the same history and trust as PHPT. For short-term traders tracking error and costs are a drag.
Summary
The USD Index trends appear unclear for the short term and bearish for the medium term while the general stock market appears moderately bullish for the short term and bullish for the medium term. The implications for the precious metals sector are unclear with respect to the short term and rather bullish for the medium term. The impact of these markets upon the precious metals appears to have lessened somewhat recently.
The continuation of the self-similar pattern in gold’s long-term chart shows a remarkable alignment with what was seen in early 2007. Taking this into account along with our SP Gold Stock Extreme Indicator, and its breathtaking accuracy, it seems a quite reliable bet that gold’s final bottom is in or very, very close to being in. We base this on the bottom forming between the 50% and 61.8% Fibonacci retracement levels, strong volume, significant declines in gold stock prices, weekly RSI target and 50-week moving averages being reached. This is exactly what we saw more than five years ago.
The implications are very bullish for gold, silver and the gold and silver mining stocks. Some caution is present in the mining stocks but will likely be invalidated as gold and silver prices move higher and the mining stocks follow. Being on the long side with both speculative and investment capital, seems to be best right now. For those who have not yet entered the precious metals sector, it is strongly suggested now and even additions to open long positions seem justified.
There appears to be about an 80% likelihood that prices will rally in the month ahead and this is a very significant probability in our view. Since the probability of a move higher has increased, we believe that adding to your speculative long positions is justified at this time. Please note that there is always a chance that this will not play out, so be sure not to use all of your speculative capital for this position.
Target levels remain as they were last week: $1,900 - $1,920 for spot gold, $40 to $45 for spot silver, and 550 for the HUI Index.
This completes this week’s Premium Update. Our next Premium Update is scheduled for Friday, March 23, 2012.
Thank you for using the Premium Service. Have a profitable week and a great weekend!
Sincerely,
Przemyslaw Radomski

