
On Tuesday gold prices continued to break down, falling for a fifth consecutive day breaking below the 200-day moving average. We sent out a Market Alert with a buy signal to our subscribers after silver and mining stocks hit target areas we were anticipating, as described in the last Premium Update. Gold fell in 7 of the last 8 trading sessions, a sustained downtrend ever since last Wednesday’s precipitous plunge, which was one of the biggest sell-offs in recent memory. The gold “Flash Crash” even prompted a serious newspaper such as the Financial Times to run a headline stating “Flash Crash Rouses Suspicions of Witchcraft,” but more on that later.
On February 6th we suggested you to get out of your speculative long positions, and reiterated it yet once again just a day before the crash. But this week on Tuesday, our SP Gold Bottom Indicator flashed a long-term buy signal. The indicator is just one of the unique proprietary investment tools developed by Sunshine Profits, available only to our subscribers. We tend to take this particular signal seriously since it has proved to be uncannily accurate in the past.
In 2011, for example, it flashed a buy signal five times on:
- January 24th , right before a major bottom,
- June 29th , a few days before a major bottom,
- August 26th , followed by a $200 rally,
- September 27th , followed by a $150 rally
- Dec 19th, a few days before a major bottom
All in all - 5 out of the last 5 times this signal flashed, a substantial rally followed - either immediately, or a few days later. Along with the buy signal we cautioned that the general stock market hadn’t reached our target level yet. We wrote that we may (!) see another downswing in stocks which may (!) correspond to another move lower in the precious metals sector since the two are correlated right now. This means that those, who enter the market on Tuesday, must be emotionally prepared for a temporary move lower.
So, back to the flash crash --there has been much speculation in the press about the $90-plus an-ounce sell off from a high of $1,790 early last Wednesday which took place in the space of about 14 minutes. Most attribute the fall to what Fed Chairman Ben Bernanke did not say to Congress. The magic words that he failed to say were “QE3.” He didn’t rule it out, but neither did he say he would go for a third round. There really was nothing remarkable about the Fed chairman’s words, and certainly nothing to trigger this type of sell-off. It reminded many of the infamous stock market flash crash that took place on May 6, 2010 when the Dow Jones plunged 1,000 points within a short period for no particular reason. But this was not the first time that Bernanke’s words influenced the precious metals market. His hint of a second round of QE at a speech in August 2010 helped trigger a 15 per cent rally over the following four months. And then the Fed’s promise in August 2011 to keep rates on hold for two years provided the momentum for gold to rally to its nominal record $1,920 an ounce in September.
According to the Financial Times article; “Apparently, someone, or, rather, two someones with proprietary trading algorithms decided it was time to sell the futures equivalent of 31 tons of gold on the Chicago Mercantile Exchange. The crash happened between 10.40am and 10.54am eastern US time, with the biggest part of the decline taking place between 10.43 and 10.44, with a further drop in the couple of minutes before 10.54.”
Our comment is that even if it were two entities that ignited the downswing – wasn’t it the case many times in the past when only a few entities start a downswing?
Consequently, couldn’t it be that simply someone had to start it because the decline was very much in the cards based on emotional (a.k.a. psychological / technical) reasons that we outlined previously? Finally, couldn’t it be the case that the big entities that started the rally shared the same emotional approach that the rest of the market did?
This certainly could have been the case – in fact, it’s quite likely that it was actually the case and that’s why such “unpredictable” moves can be sometimes predicted (not all of them, but enough to make serious money on this phenomenon).
Moving back to the article – it claimed that gold is highly correlated right now with the yield on US Treasury Tips, the inflation indexed bonds. The two asset classes are so close that they trade very tightly on a minute by minute, or tick by tick basis. It took a long time from 10.54am Eastern Time all the way to 11.20am, for the Tips market to follow the gold price down, but the fall was much more mild, a bullish case for gold.
The bottom line of Wednesday’s crash is that somebody must have been happy to buy 31 million ounces of gold at a discount. The crash “shook out the weak hands”, the small investors and speculators who are flushed out of the market by stop loss sell orders and margin calls.
Let’s keep things in perspective. The crash was insignificant in the context of gold’s past performance - up some 500 percent or 19 percent annually over the past ten years and 14 percent this year through Tuesday evening before the flash crash.
If the Fed tightens monetary policy will that mark the end of gold’s decade-long rally?
At least for now the Fed has promised to keep rates at zero until 2014, which is very bullish for the gold market. Rates are on hold and it is not likely that it is going to change. We will move back to this topic in the “Letters from subscribers” section.
The Flash Crash reminded us that the world is full of surprises, some unpleasant. This past week there has more talk than usual about the possibility of war between Iran and Israel with perhaps the U.S. getting in on the action. Is it inevitable or just the rattling of sabers? In that gloomy scenario it would be good to hold gold and run for cover. It is impossible to predict the repercussions and unintended consequences of such an event.
If we need any reminder of how fragile the world is, this Sunday will mark the one-year anniversary of the Tsunami that devastated Japan.
To see if our SP Gold Bottom Indicator will hit the mark yet again, let's begin this week’s technical part with the analysis of the US Dollar Index. We will start with the very long-term chart (charts courtesy by http://stockcharts.com.)
USD Index
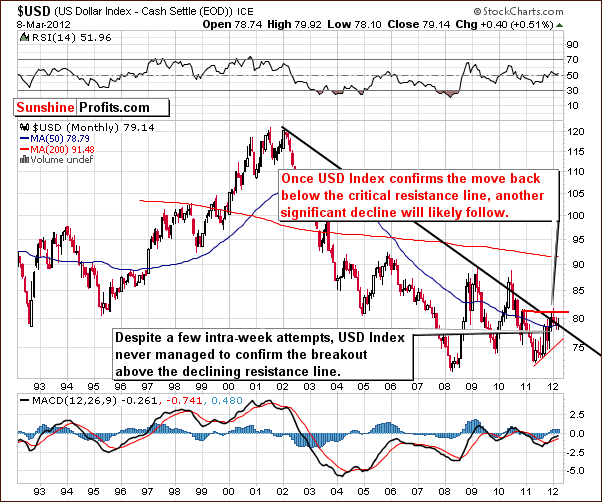
Our first chart this week once again is the very long-term USD Index chart. There has been no real change this week as the index rallied a bit early in the week and then declined. Thursday’s closing level is a bit more than a point higher than a week ago, so the overall change for the week is quite minimal so far.
The index level is still quite close to the long-term resistance line and no breakout has been seen. At this point, the odds appear to favor a continuation of a downtrend here in the USD Index.
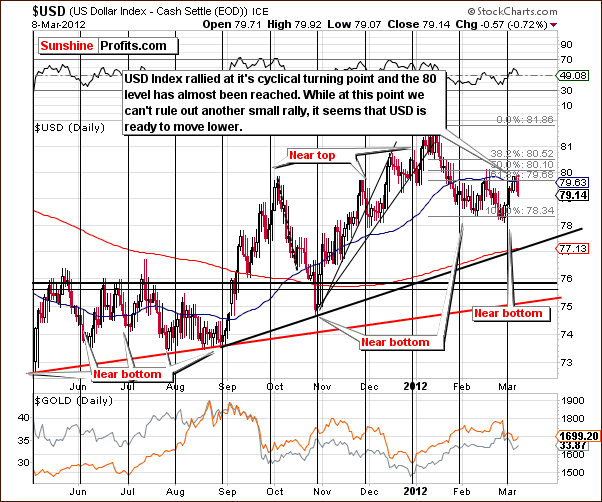
In the short-term USD Index chart, a small rally began after the cyclical turning point was reached, and the USD index approached the 80 level, reaching 79.92 only to decline thereafter. It is unclear whether the top is in or if higher index levels will be seen anytime soon.
The odds based on the long-term picture appear to favor a move to the downside with very limited upside potential from Thursday’s closing index level. The downside target levels at this time appear to be close to two important support lines in the range of 77 and 75 respectively.
Summing up, the situation is the USD Index is tense and at this time appears slightly more bearish than not for both: long- and short-term.
General Stock Market
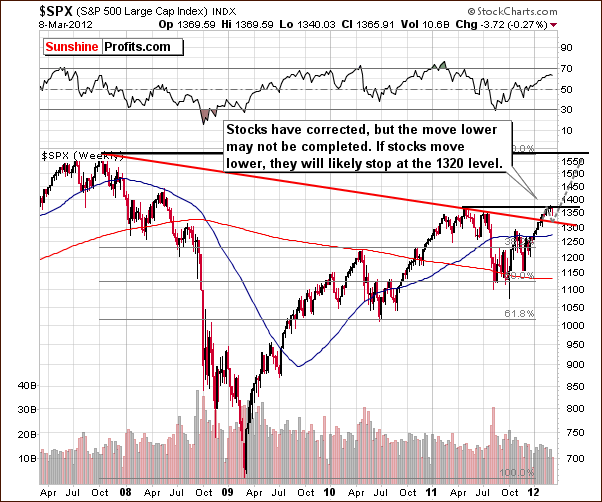
The long-term S&P 500 Index chart provides us with bearish indications this week. Target levels based on this chart in previous weeks were not reached as the S&P 500 moved about half way between the previous top and our previous target of $1,320. This downside target level appears likely when comparing recent trading patterns with those seen at the end of 2010. The decline so far has been small, so more consolidation is possible before the rally resumes.
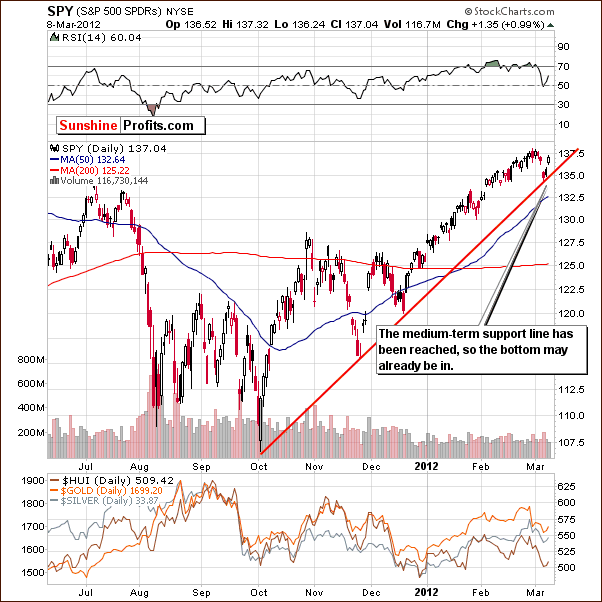
In this short-term SPY ETF chart, we see a correction to an important support line, followed by a move higher. This is a bullish indication and an immediate move to the upside is indeed possible from here.
Summing up, the long- and short-term charts provide us with different signals, so the situation in the general stock market is mixed with small moves to the downside possible. The S&P 500 will likely go no lower than $1,320 and this appears to be about 65% to 70% probable. We are not certain if the correction is over or if another move to the downside is coming or will stocks rally right away.
Correlation Matrix
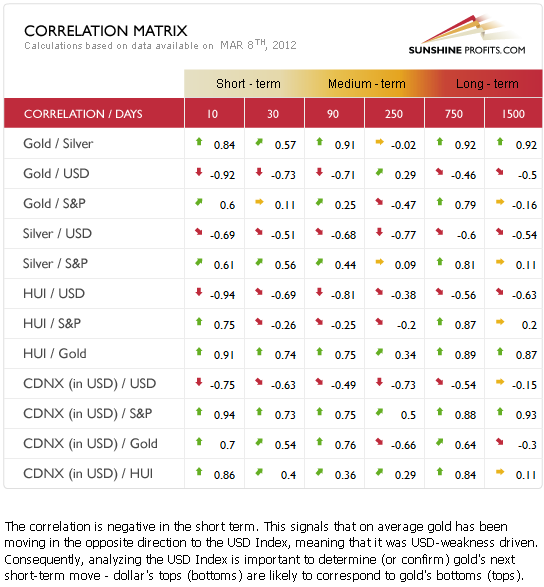
The Correlation Matrixis a tool which we have developed to analyze the impact of the currency markets and the general stock market upon the precious metals sector.
The coefficients between the precious metals sector and the general stock market weakened this week. The uncertainty in the stock market picture is therefore not as important for the precious metals, though it is a bit more important for silver than gold. The correlation between the USD Index and the precious metals remains in place and negative. The implications are more bullish than not for gold, silver and gold and silver mining stocks.
Gold
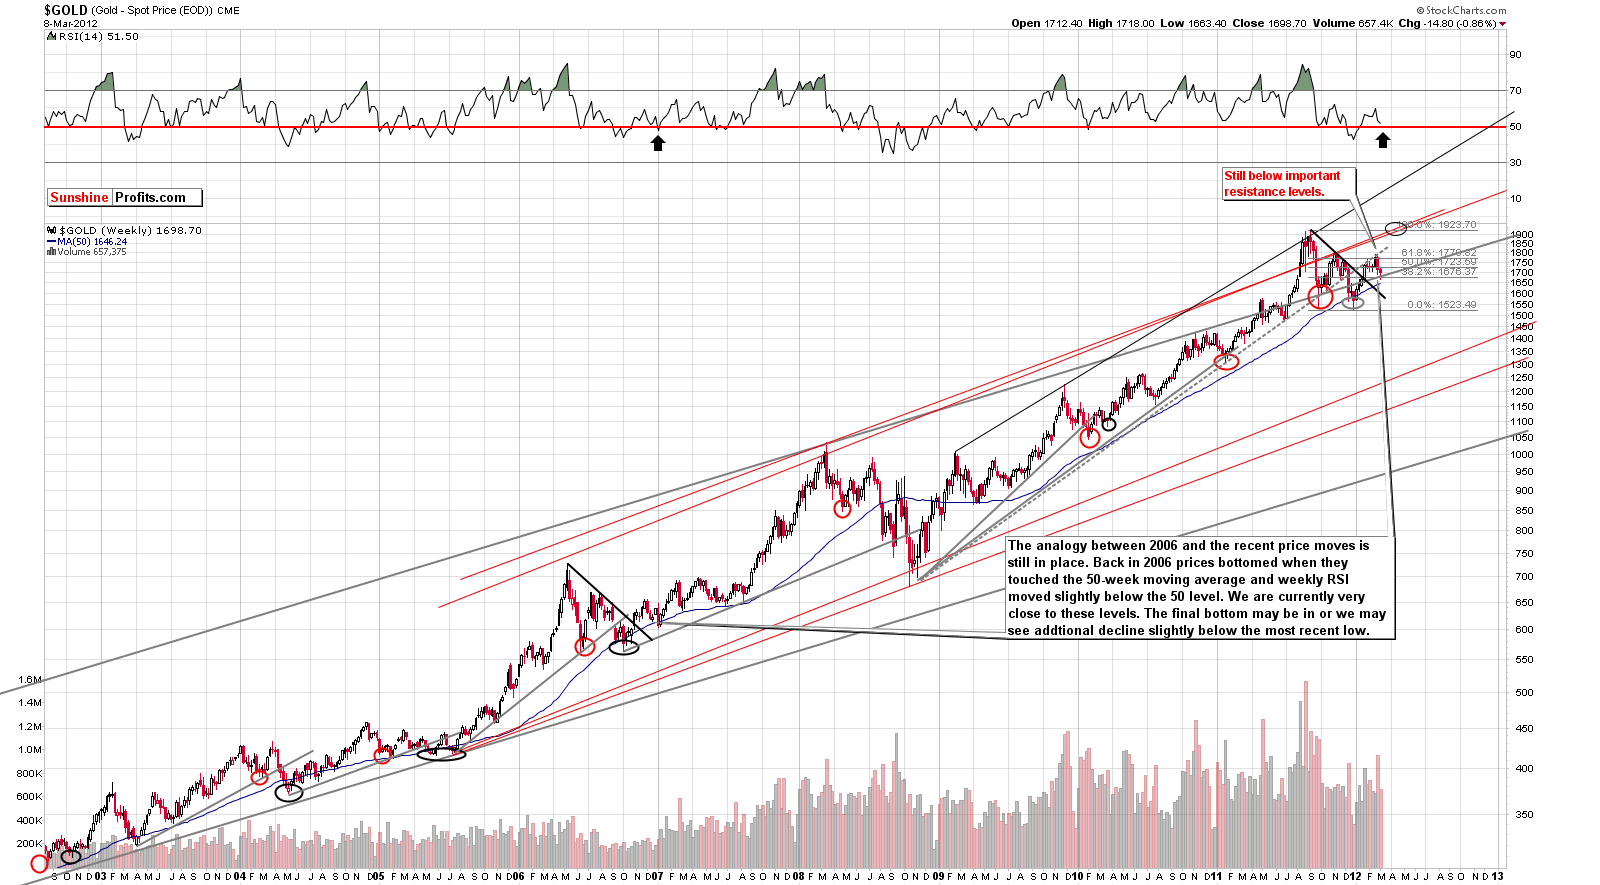
This week we begin our gold section with a look at the very long-term chart (please click the above chart to enlarge). This past week saw several important developments as gold’s price decline approached the 50-week moving average while the RSI level remained slightly above the 50 level. This is a bit ambiguous with respect to what likely seemed to be needed for the final bottom to form.
It seems that the moves may be close enough to the final bottom if, in fact, it’s not already in. The risk of being out of the market appears to outweigh the risk of being in the market at this time, as the downside is limited and upside is huge. Even with the ambiguities in this week’s trading patterns, we view the situation as bullish and feel it should be treated as though the local bottom has been reached.
The upside target level is in the trading range of the 2011 top, slightly above $1,900. We will be able to tell how breaking above this price level is perceived gold moves in fact close to it. This will be done at that time by analyzing volume levels, price path, studying the reactions of other markets and investors’ sentiment. A breakout to even higher price levels could be seen but it’s simply too early to tell.
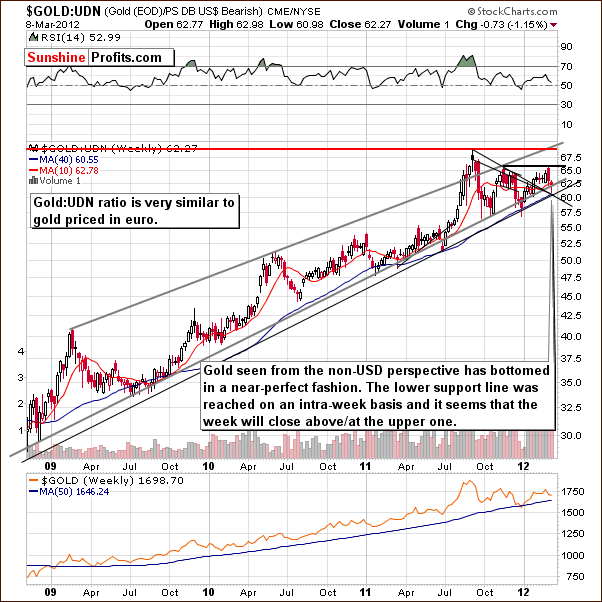
In this week’s chart of gold from a non-USD perspective, it appears that the bottom has formed perfectly.
In last week’s Premium Update we wrote the following:
With respect to the USD Index, we have a few possibilities for the coming weeks. If gold declines without any real action in the USD Index, the ratio here will likely move to 60 or so, where it will encounter the second support line. If however, the USD Index moves higher and gold prices decline, the non-USD ratio will likely trade sideways and then resume its rally in a week or two.
Gold corrected to its previous resistance line, which is now a support line with the bottom being reached just below the 61 level. The index then reversed and is now close to the upper support level. The situation appears clearly bullish at this time.
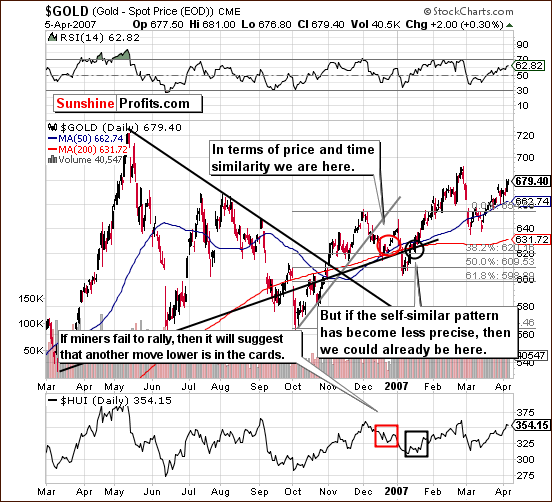
Looking back to gold’s 2006-07 chart, we have the most interesting analysis of this week’s Premium Update. We have attempted here to show how the trading patterns of gold in 2006 (red and black ellipses) may correspond to where we are in today’s market.
Technically, the red ellipse matches up pretty well as we see that gold had declined steadily, paused a bit, and then declined below the first Fibonacci retracement level. Taking the prudent approach, makes us consider the possibility that the self-similar pattern might be not as precise as we originally expected. Consequently, instead of an ABC (zigzag) correction, we could see (could have seen) just one slide. Consequently, the final bottom may already be in, a situation more closely aligned with the black ellipse in the chart.
It is possible that we are now at the beginning of a major rally as opposed to the beginning of a contra-trend move with a rally to follow. The big questions now are will there be a significant price drop and is there a way to tell if this is the beginning of a true rally?
The volume signals (something that we often use to check whether a move is a true one or not) from 2006 were somewhat erroneous but there was something which does allow us to distinguish between the two situations: the performance of gold stocks. During a fake rally, gold stocks declined even though gold’s price was rising. In the true rally, both gold stocks and gold moved to the upside together. We will continue to monitor the current situation and let you know what we find out.
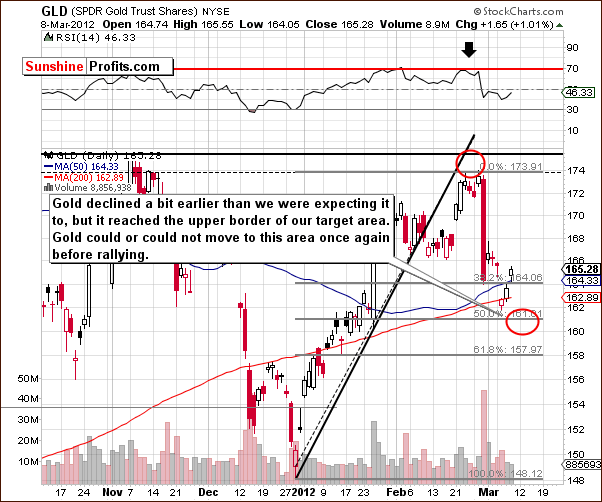
In the current short-term GLD ETF chart, it seems at first glance that the downside target level was not yet reached. It is important to note, however, that the upper border of this target level was in fact reached a few days earlier than expected. It appears that this should be viewed as the bottom being in with the only question being “is it a local or final bottom?” It’s too early to answer this with certainty.
It appears that waiting for prices to reenter the downside target area is not a good idea. If gold’s price moves higher, the upside potential is quite large, whereas any price decline would likely be quite minimal. For this reason, our recent Market Alert stated that the time was right for opening long speculative positions. The following is taken from Tuesday’s alert:
[we believe that] we are very close to the next local bottom and that we already are at the favorable buying opportunity right now. We may or may not have seen a bottom in gold, but it seems that waiting for the final bottom to be reached is not worth the risk of missing the rally in case it takes off later today or tomorrow.
Gold’s price moved up nearly 1.5% in the two days following Tuesday’s close gaining $23.50 in price during the two-day period.
Summing up, while it is not yet certain that the final bottom is in, it seems rather unimportant because gold’s price does not seem likely to decline much further and could actually move much higher very soon. The risk of being out of the market outweighs the risk of being in, so we continue to believe that betting on higher gold prices is justified even though a small price decline may be seen from here. Upside target levels appear to be in the range of the 2011 top, $1,900 or so, much higher than where we are today.
Silver
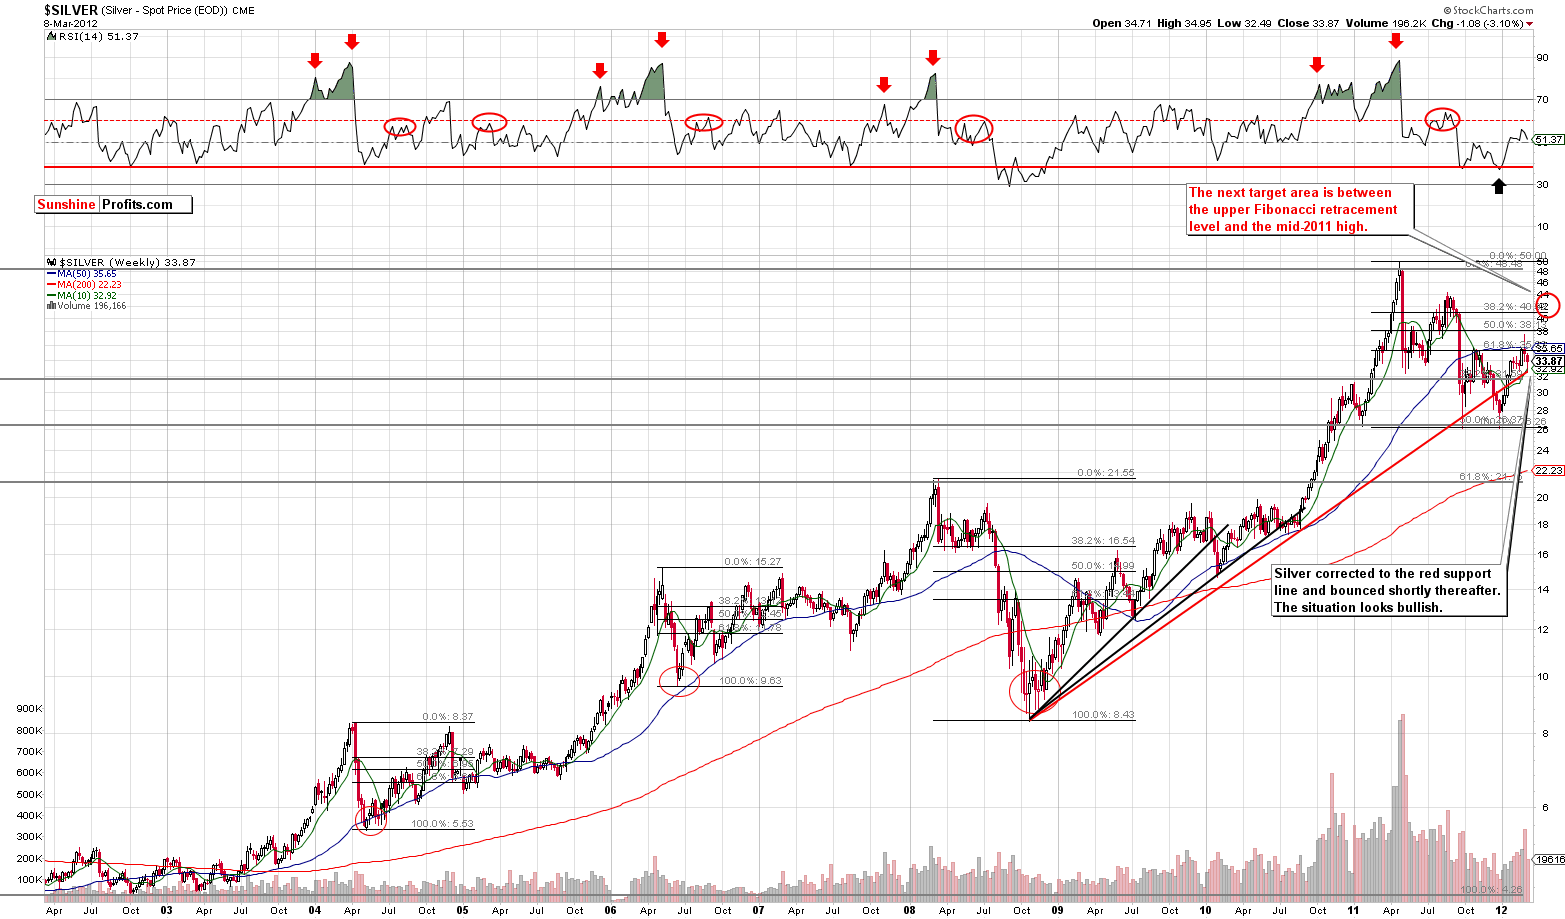
We begin this week’s silver section with a look at the long-term chart (please click the above chart to enlarge). Silver moved to the rising red support line and quickly reversed. This suggests that the bottom is in. The situation is bullish, but we could see another small move to the downside as was discussed in the case of gold.
Gold and silver are of course connected and usually move in the same direction. Consequently, based on the risk/reward situation in gold, our focus here should be on the positive potential of our investments and the upside for silver is quite large at this time. The next target level for the white metal is between $40 and $45, a price level between the upper Fibonacci retracement level and the mid-2011 high. Silver’s rally will likely pause when this initial upside target area is reached. We will have more to say about its next move at that time.
Looking at the very long-term chart for silver, where we get a cyclical turning point view, we can see that silver has recently bottomed right at the long-term cyclical turning point. This is a major event and silver is very likely to move higher in the coming months.
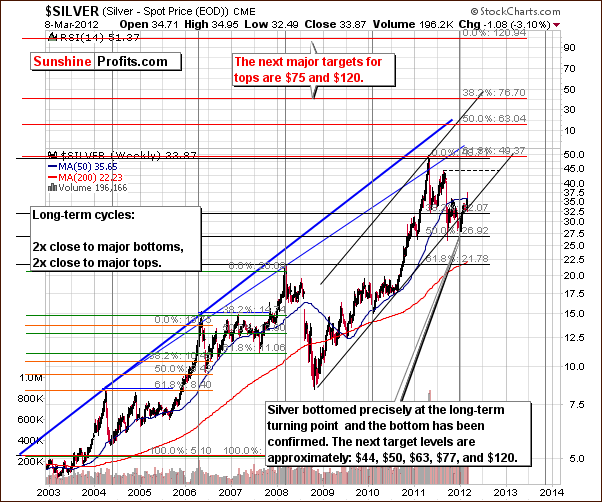
Its price has been moving up after the slight correction, which is visible in this chart and the next target level around $44 is based on the previous local top. Silver’s previous high, which was close to $50 gives us a second upside target level and this is followed by $63, $77, and $120 targets.
Now, $120 may seem unrealistic at face value but remember that $40 silver seemed unrealistic when its price was at $5. Back then, silver’s price moved to a level 8 times higher and today, $120 is less than 4 times silver’s current price. So, it’s not so unrealistic after all. Of course, the first group of target levels must be attained first.
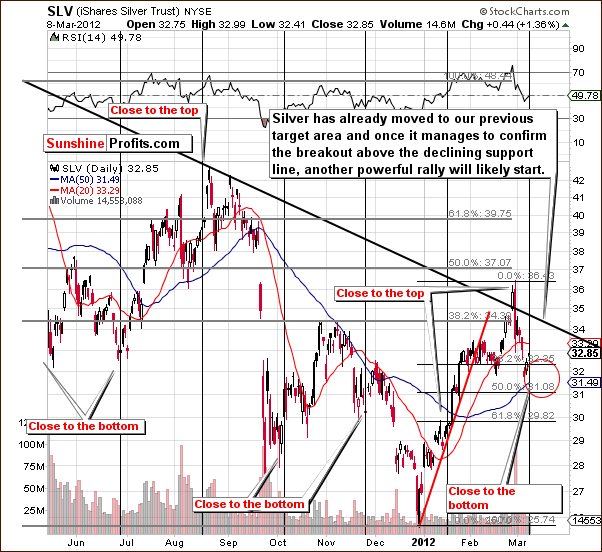
In the short term SLV ETF chart, the first thing we see from a technical perspective is that the medium-term resistance line has yet to be taken out. Silver failed to do so several days ago and its price then declined. We are now in a period as we watch for a confirmed move above this resistance line.
Once SLV moves above $34.50 (approximately $35.50 for spot silver) and the resistance line is taken out and the move confirmed, another significant rally should emerge. Prices are then likely to move to the previously mentioned $40 to $45 trading range.
Summing up, the situation appears bullish although silver could see a small price decline in the days ahead especially if this happens for gold. The upside potential greatly outweighs the downside risk with an upside target level between $40 and $45 for spot silver. A move to this level will be much more likely after the breakout above the declining resistance line which corresponds to a spot silver price of $35.50.
Crude Oil
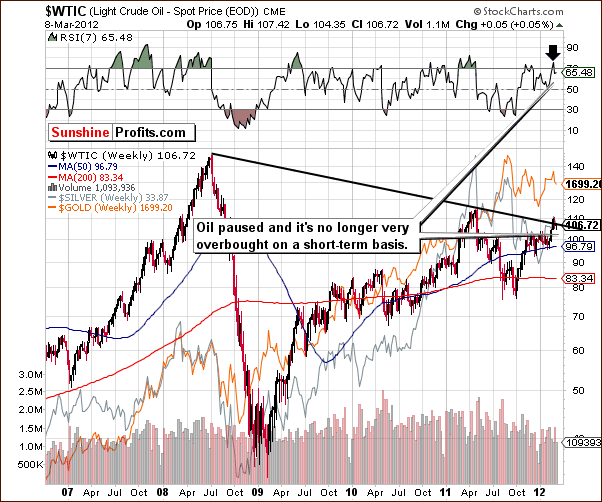
Last week we wrote the following regarding crude oil prices:
A pause is likely in the rising price trend. Once we see a consolidation, there will likely be a breakout followed by another price rally. It does appear that a consolidation is likely to be seen first, however.
Since crude oil corrected and is no longer so overbought, we may see a breakout and additional rally. This rally could take place along with the rally in gold, silver, platinum and related equities.
Gold and Silver Mining Stocks
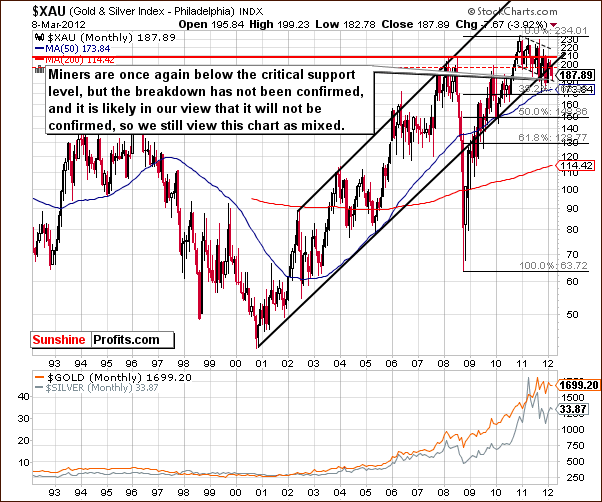
In this week’s very long-term XAU Index chart, we see a move below a critical support line, but this move has not been confirmed. This type of move has been invalidated many times in the past, so the situation at this time is best described as mixed.
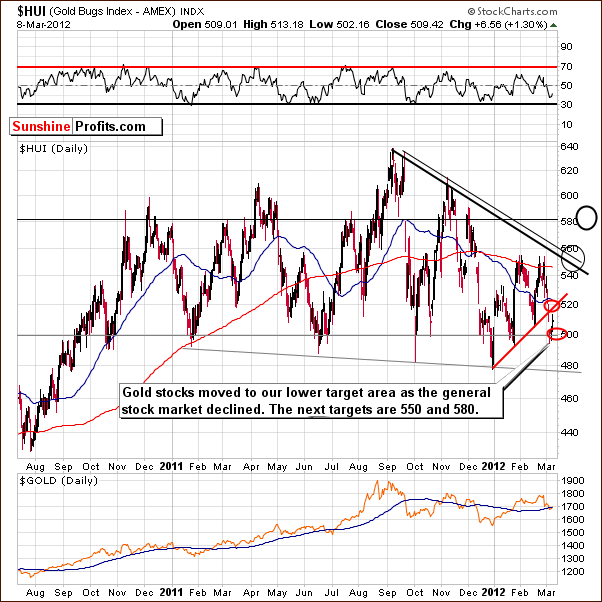
In this week’s long-term HUI Index chart, we see that gold stocks have bottomed at the lower of our two likely target levels. This level was reached as the main stock indices also declined. We have 2 near-term target levels to the upside. The first is close to 550, in the range of the 2012 highs and the second is close to 580. These target levels are likely to be reached in the weeks ahead (details are not clear). Mining stocks appear poised to move higher in conjunction with rising gold and silver prices.
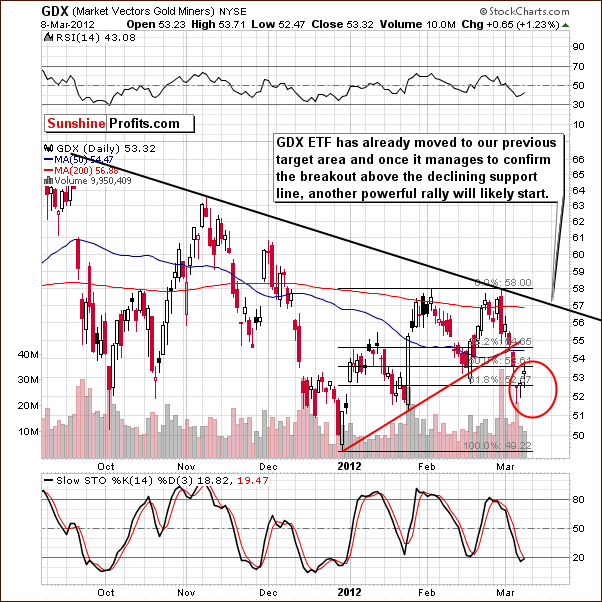
In the short-term GDX chart this week, we see that the downside target level has been reached and prices have reversed to the upside. A pause is likely to be seen around the $57 level. A breakout appears likely this time with a good possibility that prices will finally move above the declining resistance line. This may not happen immediately, especially if the metals prices decline in the days ahead, but it appears to just be a matter of time before the breakout is seen.
Summing up, based on the situation in the gold and silver markets, mining stocks may see a small decline in the coming week. Downside target levels have been reached, so a bet on higher prices is justified at this time. Target levels are $57 for the GDX ETF which corresponds to 550 for the HUI Index with a 580 subsequent target level ($60 for GDX).
Looking at mining stocks is important in the days ahead to identify the validity of a rally in the metals. If prices decline here and move higher in the gold and silver market, it is likely a fake rally. If both mining stocks and the metals move higher together, further declines will be unlikely for some time.
Sunshine Profits Indicators

As we reported in our latest Market Alert and at the beginning of this update, this week we have seen a long-term buy signal in our SP Gold Bottom Indicator as the indicator has moved to the dotted horizontal line (please click the above chart to enlarge). This has been seen only a few times in the past year, each has been a great buying opportunity, and we are at this point now.
In the above-mentioned Alert, we wrote the following:
Also, we don't have signals from our "extreme" indicators so far, but we may very well see them based on today's session (based on their construction, they are more likely to be seen after volatile days).
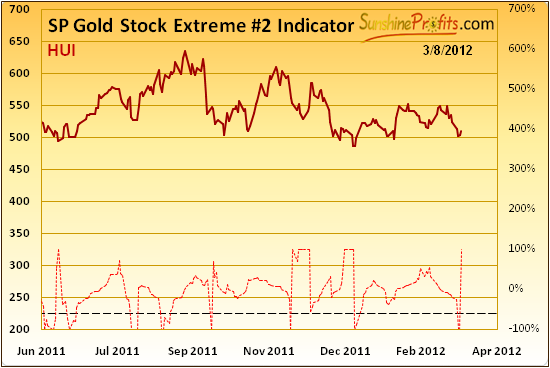
Actually, this is what happened. In our SP Gold Stock Extreme #2 Indicator chart, we have a confirmation of our first chart as the dotted horizontal line was crossed. Similar moves have corresponded to local bottoms multiple times in the past.
Based on Thursday’s closing prices, we have seen another signal.
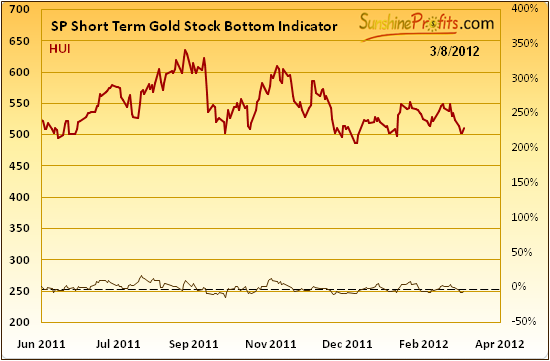
The last time the SP Short Term Gold Stock Bottom Indicator flashed a signal (based on Feb 16th, 2012 closing prices) we’ve seen a small rally that began immediately. Now, we have seen it once again, which is another bullish indication.
Consequently, since we have the long-term signal and a short-term confirmation, the odds of precious metals prices moving higher are increased. We have received the same signals from multiple charts and tools which increases our confidence in our analysis this week.
Letter from Subscriber
Q: You've probably seen this new Fed bond buying scheme:
Federal Reserve officials are considering a new type of quantitative easing that will attempt to boost the economy without accelerating inflation, according to a report published Wednesday. Analysts said the new approach would allow the Fed to move despite high oil prices.
Under the new approach, the Fed would print new money to buy long-term mortgage or Treasury bonds but effectively tie up that money by borrowing it back for short periods at low rates, according to a story in The Wall Street Journal. This “sterilized” quantitative easing, would use reverse-repurchase agreements to keep the money from flowing to bank reserves.
We were hoping to hear your thoughts on this? Thanks.
A: In short, we find it a bullish long-term factor for the whole precious metals sector.
By buying long-term mortgage or long-term Treasury bonds with much cheaper money, the Fed will effectively strive to push the long-term interest rates lower. The Fed buys long-term bonds which will drive their prices higher (demand goes up). Bonds are negatively tied to the interest rates, so these rates will move lower.
The Fed says that it's not inflationary, but that's not true. The implications are just camouflaged. Lower interest rates mean less foreign demand for long-term Treasury bonds, which means smaller purchases of USD in order to purchase these bonds. We might in fact see sales of bonds from foreign investors who bought these bonds at lower prices. In a way, the Fed will likely replace some foreign investors and this will be bearish for the USD Index.
The article talks about keeping inflation expectations low and that this would be dollar supportive and bad for gold. We disagree, simply because we think that a camouflaged QE is an inflationary factor, not the opposite.
It will be inflationary because it's an artificial behavior (not strictly market-related) that will increase the money supply as it will provide money to long-term borrowers (lower rates mean lower payments), which they will at least partly use to purchase goods and services. Possibly precious metals, too.
Summary
The situation in the USD Index is more bearish than not and the general stock market situation is mixed at this time. Together, this paints a bullish picture for the precious metals sector overall. The most important bullish signals come from the gold and silver markets as well as from Sunshine Profit Indicators – 3 of which are indicating buying opportunities.
We believe that open long speculative positions and open long investment positions in precious metals and mining stocks are justified at this time.
Target levels for the weeks and months ahead are $1,900 for gold, $40 to $45 for silver with close to $45 more probable especially after $35.50 price is successfully broken . The HUI Index has an upside target level of 550 with a second target level of 580. We will have much more to say on this once the first target level is reached. Gold, silver and mining stocks appear to have about a 75% probability of reaching their respective target levels within the next 3 months.
This completes this week’s Premium Update. Our next Premium Update is scheduled for Friday, March 16, 2012.
Thank you for using the Premium Service. Have a profitable week and a great weekend!
Przemyslaw Radomski

