
Gold futures pierced a key resistance ceiling in midday trading Wednesday, opening the door for a run to the $1,800 per ounce level. We sent a Market Alert yesterday saying that there is a 70% probability that gold will reach $1,800 before a bigger decline is seen, and that silver could climb to $35.5 or so and the HUI Index could move to 560. Investors were sorting through a batch of news, including Greece’s new bailout package, a stronger report on U.S. home sales and a slightly weak report on manufacturing in China.
This week we take a trip around the world to look at various stories that pertain to precious metals and we’ll begin with a stop in:
South Africa
For those who wonder about Wednesday’s rapid rise of platinum prices--$35.90 to finish at $1,720.80 an ounce-- the answer can be found in a miner’s strike in the world’s largest platinum mine in South Africa. Troops were sent in last week to quell violence in this month-long strike at Impala Platinum Holdings near Rustenburg, about 60 miles northwest of Johannesburg. The company, which mines more than a tenth of the world's platinum output, says it has lost 80,000 ounces of platinum production since the strike began and will lose an additional 20,000 every week it remains unsettled. The metal is used in a variety of products, from automobile catalytic converters to electronics. The price has also been supported by recent positive US economic data.
Poland
We’ve heard of Armageddon, but now there is Eurogeddon. This is a new fund started by a Polish economics professor aimed at making a bonanza in case the eurozone collapses and he’s taking gold into account. Krzysztof Rybiñski, a former deputy governor of Poland’s central bank, announced the launch of his new fund on Tuesday.
“For two years I’ve looked at the inability of politicians to deal with the euro crisis,” he said. “They don’t seem to have learned anything and are simply making matters worse. All of this will end with Greece’s bankruptcy.”
The fund’s strategy consists of shorting futures on European stock exchanges, shorting Italian bonds, going long on gold, US dollars, US bonds and put options on leading stock exchange indexes.
Spain
One way for economically troubled countries such as Spanish to get gold and silver is to get their hands on lost treasure found in sunken ships. It’s an especially recommended strategy if the country doesn’t have to go through the trouble and expense of finding, exploring and extracting the treasure. This week Spanish experts examined 595,000 gold and silver coins plucked from a 19th-century shipwreck and stored in a Florida warehouse. This was after a lengthy legal battle with the American treasure hunting company that recovered the trove. Two Hercules transport planes from the Spanish Air Force arrived in Florida to repatriate the treasure toSpain. It weighs about 17 metric tons and has an estimated value of several hundred million euros. The American company lost the legal battle to keep the treasure, recovered off the coast of Portugal in 2007 from the wreck of a Spanish frigate intercepted and sunk by the British in 1804.
Iceland
With all the credit rating downgrades of European nations, it is refreshing, even surprising, to read that Fitch upgraded Iceland’s bonds from “junk” to investment grade status. It wasn’t too long ago that Iceland was a basket case, on the very brink of the abyss after the October 2008 failure of its biggest banks. And now Iceland's unemployment is only 7.2%, and GDP growth is expected to come in at 2.4% this year. How is this possible? Iceland took a different path. It did not bail out its ailing banks -- it let them fail. Iceland's banks were so large, at about 10 times gross domestic product, that the country had no choice but to allow them to fail and see their creditors take the hit rather than the government. Is there a lesson to be learned here?
Turkey
Turkey remained the world's number one minter of gold coins in 2011, according to the latest data released by the World Gold Council. Turkey's central bank also added 63 tons to its gold reserves.
"Turkish investors appear to be increasingly troubled by the ongoing crisis in the Euro area, and these burgeoning fears are driving increasing purchases of gold for its insurance purposes," the GDT report says.
In the fourth quarter alone, demand for gold coins and bars in Turkey was 19.3 tons – a 142% increase on the same period in 2010.
United States
Colorado lawmakers are sponsoring a bill in the state Senate that would enable the use of gold and silver coins as currency. Utah already has a similar measure in place and 12 other states are considering such plans. Supporters are concerned about the strength of the U.S. dollar as the Fed’s dollar printing machine keeps working overtime. The bill has already cleared the Senate Finance Committee and needs a vote from the full chamber.
Iran
There are reports that Iran is turning to barter - offering gold bullion in overseas vaults or tanker loads of oil in exchange for food as new financial sanctions have hurt its ability to import basic staples for its 74 million people. Difficulty paying for urgent import needs has contributed to sharp rises in the prices of basic foodstuffs. New sanctions imposed by the United States and European Union to punish Iran for its nuclear program do not bar firms from selling Iran food, but they make it difficult to carry out the international financial trans-actions needed to pay for it.
Great Britain
With gold at records highs British thieves are targeting the homes of the British Asian community known to have collections of gold jewelry, often handed down for generations. The Guardian reports that the number of such robberies is increasing in Asian neighborhoods.
Also in Great Britain, a collection of Roman silver and gold coins found near Mildenhall by a father and son on farmland, have been declared treasure. The collection consists of 15 silver siliquae and one gold solidus. They date from 355 to 402, which is the tail end of the Roman occupation of Britain. A number of other finds have been made at the same site, with around 80 coins being uncovered in the last decade.
Singapore
The island nation will exempt investment-grade gold and other precious metals from a 7% goods and services tax to spur the development of gold trading. This will bring Singapore's tax treatment of investment-grade gold and other precious metals in line with the practices of other developed countries such as Australia and Switzerland. Officials hope this will develop gold trading and draw on Singapore's strengths as a financial and trading hub to lure asset managers to move their operations to there.
Since we can’t count on finding sunken treasure on the bottom of the ocean floor, or ancient Roman coins on our farmland, let's begin this week's technical part with the analysis of the US Dollar Index. We will start with the very long-term chart (charts courtesy by http://stockcharts.com.)
USD Index
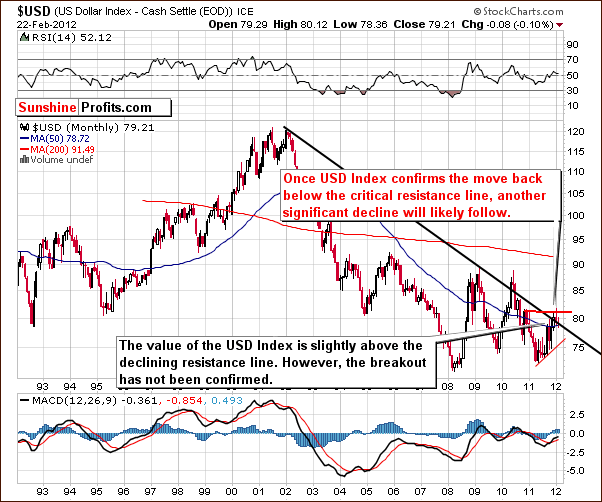
Our first chart this week is the very long-term USD Index chart. With no changes visible here over the past few weeks, our statement in last week’s Premium Update still holds. “There is basically no change this week as the daily index movements have been too small to be visible from a 20-year perspective.”
The situation in the USD Index from the very long-term perspective remains unclear.
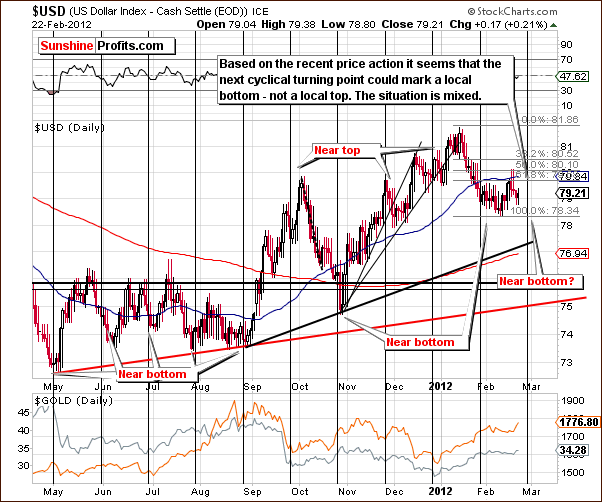
In the short-term USD Index chart, we do have some new developments this week. Based on the trading action of the past few days, it appears that the coming cyclical turning point could be a local bottom rather than a local top.
Since early February, the USD Index has been trading sideways, without a visible rally or decline. Consequently, it’s impossible to tell which way it will move after the next cyclical turning point. If the index moves higher in the coming days, it will likely reach a top in early March and then move lower. If however, declines are seen in the week ahead, a local bottom will likely be formed at the cyclical turning point with a rally to follow.
Summing up, the signals from the short-term chart are mixed, just as it is the case with the long-term chart. We believe that those betting on short-term currency trends should wait for a better opportunity to enter any positions. The situation seems too unclear at this time.
General Stock Market
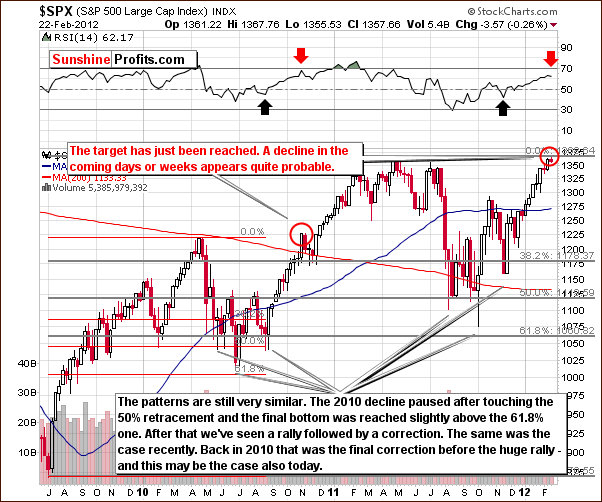
On the above S&P 500 Index chart, which looks at the broad market, we have seen a small increase this week followed by a slight decline. The 2011 high was reached validating our expectations of this point as a likely upside target level several weeks ago (in our January 27 Premium Update) when we stated that the next local top will probably be close to the level of the 2011 high.
Based on the similarity to 2010, a consolidation or period of decline is likely to be seen next in the general stock market. RSI levels are close to the range seen in October-November 2010 when the rally in stocks paused, only to resume with vengeance. In today’s market, the short-term outlook is bearish as stock prices are a more important factor right now, but a significant rally could very well be seen in the medium term (the medium-term picture is more blurry than the short-term one, though).
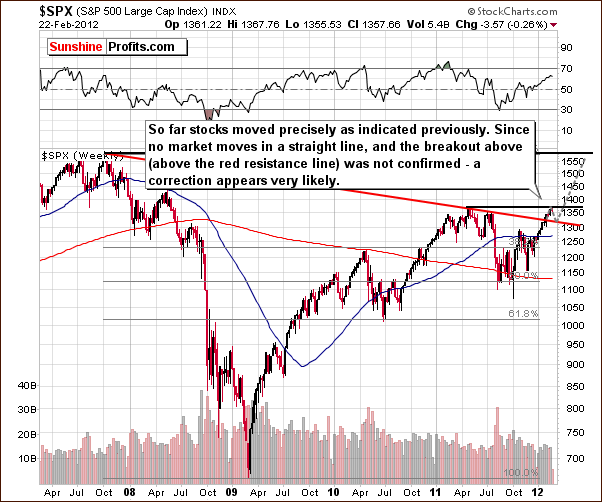
In the long-term S&P 500 Index chart, we see that stock prices are clearly following the short-term trend. There was no real confirmation of the breakout above the red-resistance line which is now a support line. We believe that stock prices could move back to this support line and then move higher once again. The latter is based primarily on the extremely low interest rate environment we are currently in.
Summing up, while the situation in the currency market is somewhat unclear, analysis of the general stock market charts yields some clear signals this week. Lower stock prices appear to be ahead for the short term.
Crude Oil
While this is not our main focus area, due to the recent popularity of this topic, we decided to provide you with our views on the current situation in crude oil.
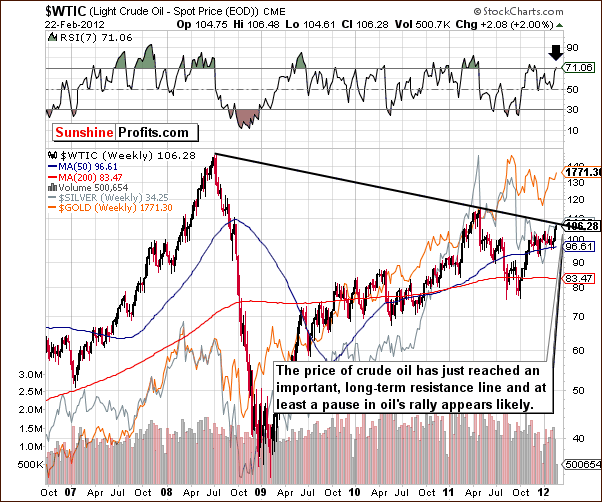
Crude oil prices have been in the news a great deal this week due mainly to developments in Iran and the overall geo-political situation. The outlook for higher oil prices has been favorable for years now and it didn’t improve dramatically in the past several weeks. This week has seen a change – but not in the fundamental picture. The change was seen as far as the coverage that crude oil prices got - higher oil price has drawn the attention of the media.
Compared to the bearish technical signals, declines in price appear quite possible before the next move to the upside. Namely, this is based on two technical factors: the very long-term resistance line, based on the 2008 and 2011 tops (major ones), and the RSI level which is currently slightly above 71. In the past, this has coincided with local tops in the price of oil on multiple occasions. The long-term perspective is still suggesting that investing in oil stocks and other oil-related investment vehicles remains a good idea; however, the short-term situation is not so bullish.
Precious Metals Correlations
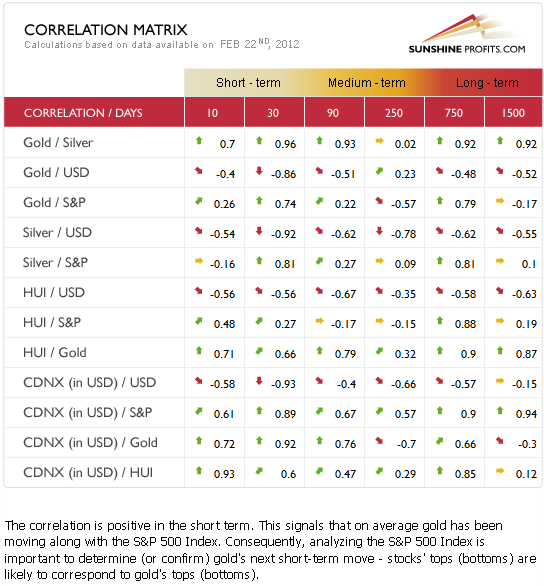
The Correlation Matrixis a tool which we have developed to analyze the impact of the currency markets and the general stock market upon the precious metals sector. The situation here is normal once again (metals move along with stocks and in the opposite way to the USD Index). Of utmost importance, the general stock market and precious metals show high, positive correlations, and this week’s analysis of the general stock market is clear and concise. With the outlook bearish for stocks in the short term and the correlations with precious metals positive, the situation is also short-term bearish for the precious metals sector overall. Therefore, long speculative positions in the precious metals sector appear risky at this time.
The coefficients between the currency markets and the precious metals, though significant are not as important due to the cloudiness in the currency market outlook at this time. Since the situation is unclear with the USD Index, a high correlation with it does not provide any additional insight useful to investors.
Gold
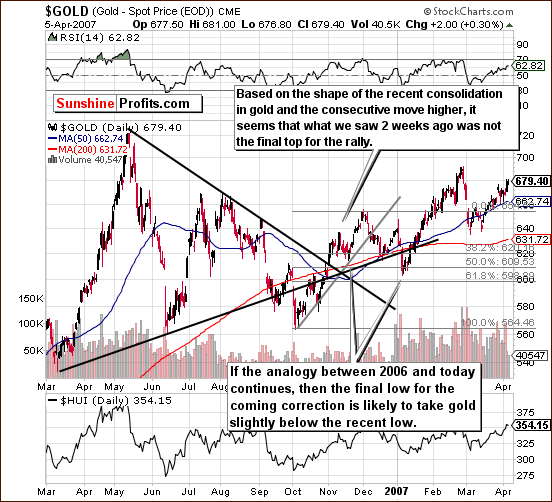
Once again this week we have included gold’s chart from 2006-07 so that we can see the similarities between current trading patterns and the price moves back in 2006.
This week we do have a bit of a different read as we have seen steady consolidation and a sharp rally above the previous local top. The correction, which we discussed week, has not yet begun but is likely not far away.
Based on previously available price information it appeared that the current price moves reflected the mid-December situation, but based on the most recent events, it seems that we are seeing something similar to early November 2006. This week’s rally would coincide with what was seen that year in mid-November, and, if the self-similarity continues, we are likely to see a local top quite soon. Then we would expect gold prices to decline to below the level of previous lows. The local top, which must be seen first of course, will probably be reached within a few days. Note that in mid-November 2006, the RSI level (based on daily prices) was close to 70 when the local top was reached.
The above-mentioned analogy will have profound implications on the following part of the analysis. Consequently, let’s re-examine it from a long-term perspective.
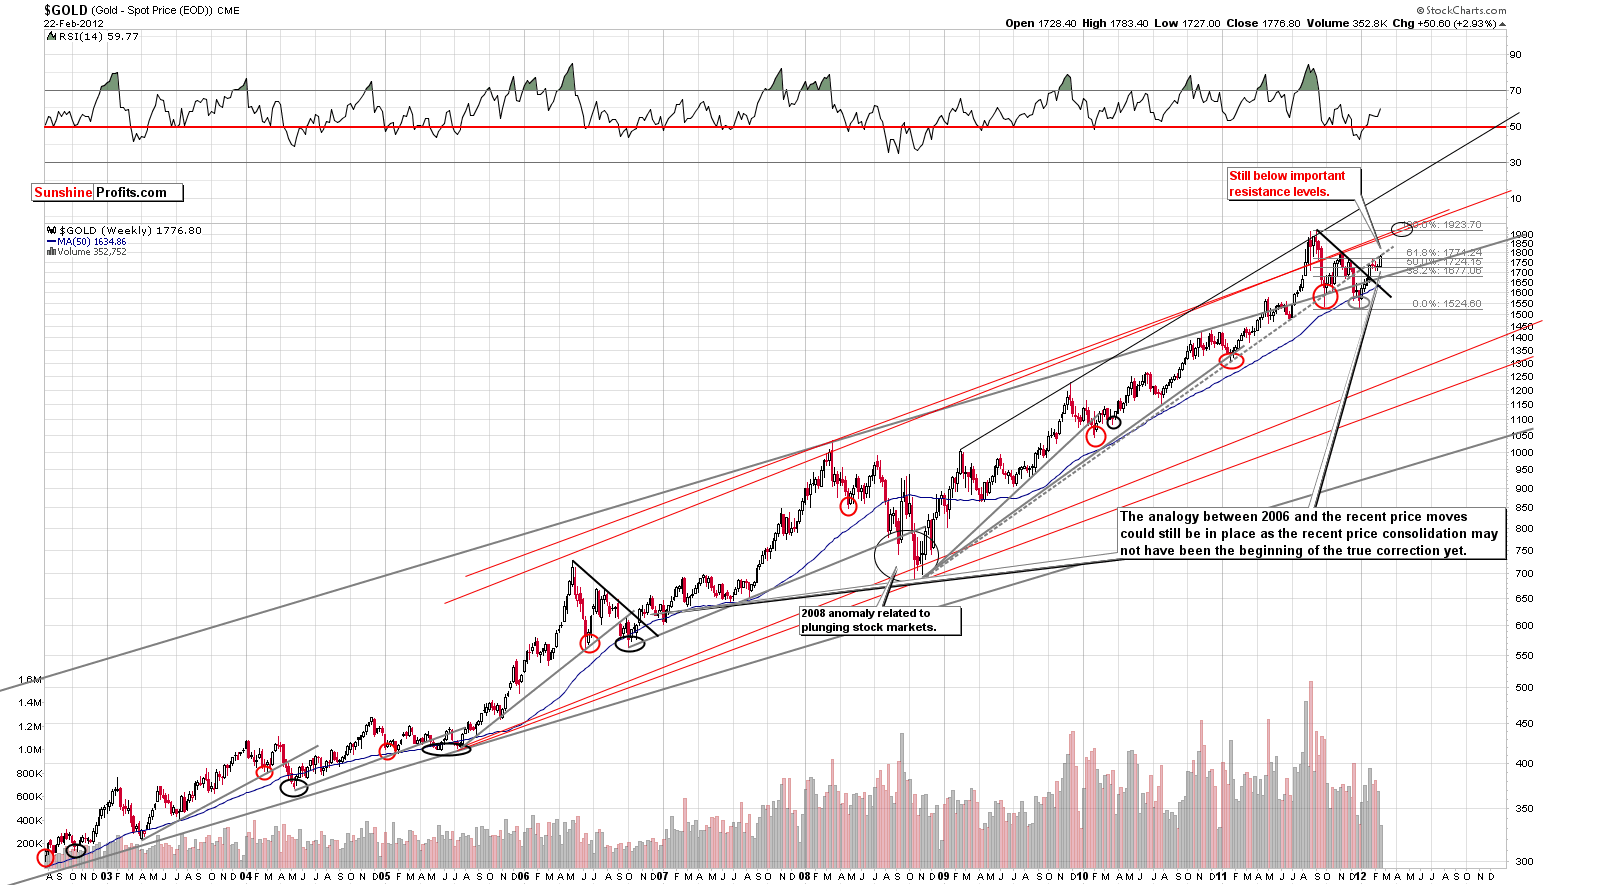
In this week’s long-term gold chart (please click the above chart to enlarge), we can see in the weekly candlestick patterns that in 2006, the breakout was followed by a two week consolidation followed by a rally, followed by a significant correction.
Recently, we have seen an initial correction and expect next a local top followed by a bigger consolidation. Gold’s price is presently still below important resistance levels. It is at the 61.8% Fibonacci retracement level, below the previous local top, and at the rising resistance line (dashed one).
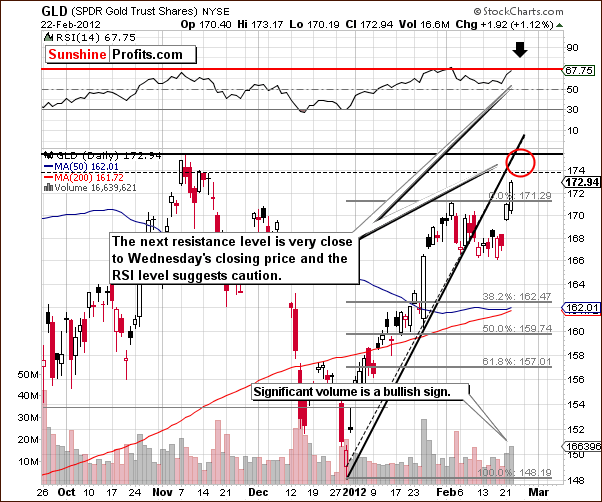
In the current, short-term GLD ETF chart, we see that the RSI level is close to 70 and will likely reach this line when gold’s price reaches its local top. Large volume levels have been seen this week on days with rising gold prices, and this is a bullish sign indicating that yet higher prices will likely be seen. However, the target level is quite close to Wednesday’s closing price level. Consequently, we are very short-term bullish at this time, but our expectations for the coming weeks are for lower gold prices being quite probable.
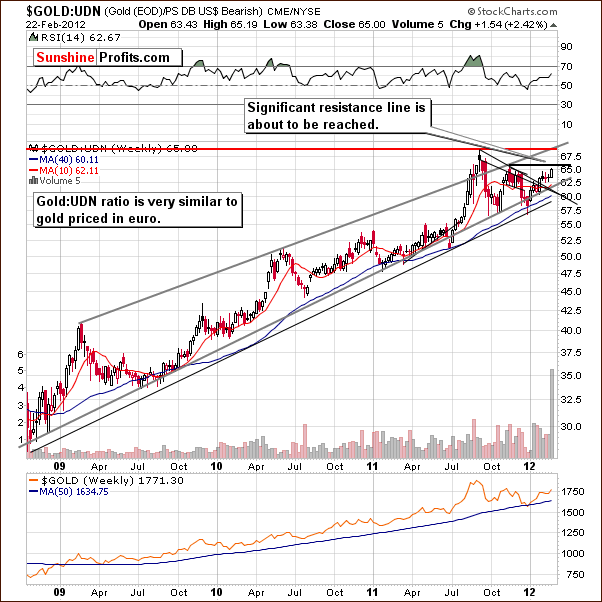
In this week’s chart of gold from a non-USD perspective, we still see the index below the level of the previous local top. A significant resistance level is about to be reached, however, and our previous points have not been invalidated here.
Volume levels have been high this week, but this is not the true picture as this week’s volume value is based on just 3 trading days. Plus, note that this is actually a ratio of volumes, so it can (and likely will) be much lower when the week ends based on increased volume in the UDN ETF which is the denominator of the ratio.
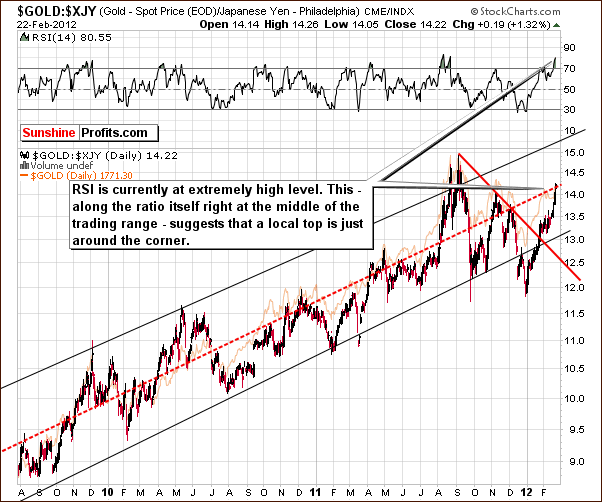
Looking at the long-term chart of gold from the Japanese perspective, we see that the RSI level is extremely high, actually above the 80 level. The last time this was seen coincided with the major 2011 top. The price level here is also at the middle of the trading range, and gold has topped in similar circumstances previously. This chart is therefore short-term bearish for gold.
Summing up, the outlook for gold is bullish for the next few days based on the short-term chart and recent volume levels. When looking at trading patterns of 2006, RSI levels of the GLD ETF, and gold’s price and RSI level from the Japanese perspective, indications are that the next few weeks will likely see gold prices move lower.
Silver

We begin this week’s silver section with a look at the long-term chart (please click the above chart to enlarge). Once again, the trading period in 2006 continues to influence our current analysis here. It seems that silver’s price will move higher in the days ahead, reach a local top, and then likely decline to a level below its previous lows. At this point, it seems that the late 2011 top (in the $35-$36 range) could be reached before prices reverse and move lower once again.
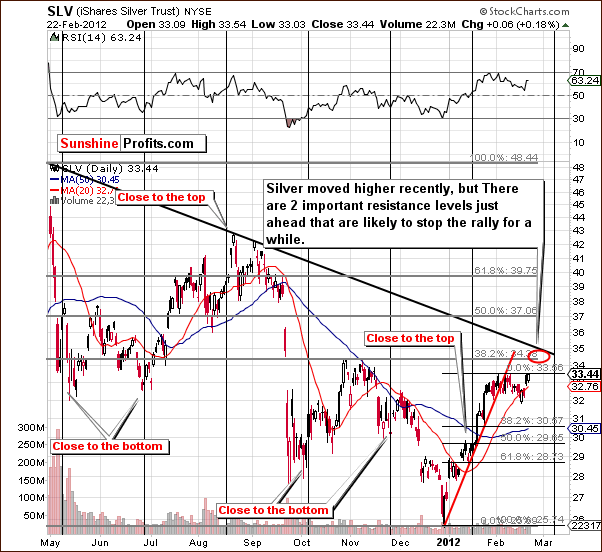
Looking at the short-term SLV ETF chart, the first resistance level that silver will encounter when it moves above February 2012 highs, is created by the Fibonacci retracement level ($34.38 for the SLV ETF) based on the whole 2011 decline.
Even if the Fibonacci retracement level keeps the rally in check, the next resistance line based on the local tops of early and mid-2011 likely will.
Taking time analysis into account, prices could possibly move higher or even trade sideways up to the cyclical turning point. It now seems likely that a local top will be reached at this important point in time instead of the local bottom which seemed likely a week ago.
Summing up, silver is likely to follow gold in the short term. It seems that its price could move a bit higher than the previous local top with a significant correction to follow.
Gold and Silver Mining Stocks
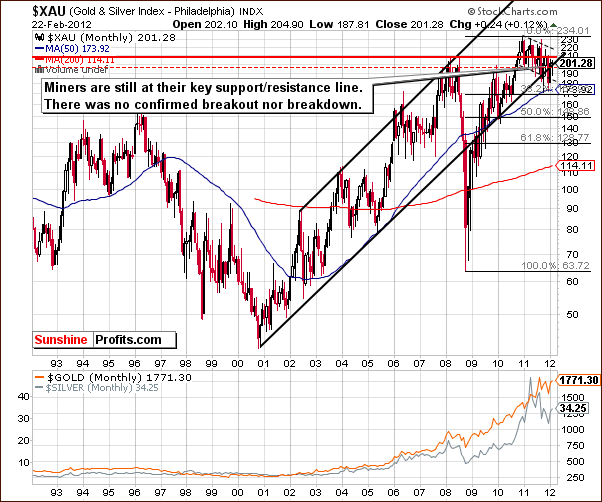
In this week’s very long-term XAU Index chart, we see the index level is right at the support/resistance line. The picture is cloudy here. Will there be a huge rally? Will there be a huge decline? The answers to these questions simply cannot be obtained from analysis of this chart and the situation is similar to the one that we’ve seen in the previous weeks.
The reason that we continue providing this chart on a regular basis even though there are no changes on it, is that we want you to be sure that we keep monitoring this situation. We also keep an eye out for developments on multiple other charts as well, but since this once is particularly important, we continue to feature it each week. Once the mining stocks finally decide to confirm a breakout or breakdown, a significant move will likely follow.
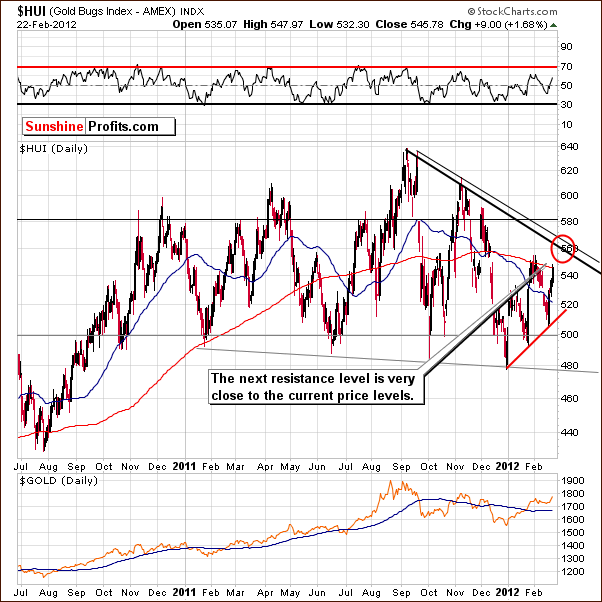
In this week’s long-term HUI Index chart, a bottom was recently reached at the short-term rising support line. A rally close to the level of the previous high has been seen next and the declining resistance line based on late 2011 highs is soon to be reached. This is around the 560 level, just slightly above Wednesday’s closing price level.

In the short-term GDX chart this week, higher volume levels have been seen with moves to the upside and lower volume levels on price declines. This is a bullish sign, but there is a resistance line close to the current price levels here. It seems unlikely that this line will be broken or if it is broken - that the move breakout will be confirmed so the rally will likely end soon here as well.

In the GDX:SPY ratio chart, which compares the performance of mining stocks with the general stock market, we have seen a single spike in volume this week which could be viewed as a topping signal (just like it was the case many times in the past).
Please note that the reliability of the sell signal coming from the analysis of volume is increased when we also get a sell signal from the RSI indicator and when the ratio touches a resistance level. The ratio is at a resistance line, but the RSI level is below 70. So with the spike in volume, we have one confirmation but not the other. Still, based on the above chart, the local top here will likely be seen quite soon.
Summing up, the situation for mining stocks mainly relies upon the gold and silver markets at this time. Short-term target levels to the upside are quite close to Wednesday’s closing price levels, so local tops are probably not far away with declining prices soon to follow.
With a sell signal seen in the GDX:SPY ratio chart, betting on higher prices for mining stocks appears quite risky at this time. This is in spite of the positive picture painted by the high volume levels seen this week in the GDX ETF.
Letters from Subscribers
Q: Are you using GDX as a proxy for miners, or either the HUI or XAU indexes? And can you give put an actual number on the 2011 lows? I believe the HUI bottomed at 485 on 28th December 2011.
A: We are using XAU & HUI indices and the GDX ETFs as proxies for the mining stock sector. Each is a bit different, just like S&P 500 and Dow Jones Industrial Average are - they move very similarly, but there can be subtle differences between them. Thanks to this, we can see if a move in a given direction has been confirmed. For instance, a breakout in HUI without analogous action in XAU and GDX will be much less meaningful than if we had breakouts in all 3 of them. The approximate numbers for 2011 lows are: HUI - 477.93, XAU - 171.27, GDX 49.22.
Q: This is not the first time you've differentiated between long term and speculative capital, and I wonder if you could clarify this(...) What is your opinion - is it correct, using your terminology to treat junior gold and silver stocks as "long-term capital"?
A: The answer about juniors depends on what you want to do with them. We believe that juniors should not be traded on a short-term basis and that one should treat them as long-term investments. You will find more details in our Key Principles section.
In a nutshell, short-term capital is something that you use to trade precious metals or related assets (like mining stocks) on a short-term basis (say weekly trades). Most of traders' capital is this short-term capital. Long-term investment capital is something that you can invest and then hold to this position for years and in the end you are very likely to make money. For instance, if someone had bought silver in 2002 and holds it to this day (or they moved out of and then back into silver no more than - say 15 times - during the past 10 years), then this is the long-term capital. We believe that some of one's capital should be dedicated to long-term investments and some of it to short-term trades. You will find more details in our essay on position sizing.
Summary
The situation in the general stock market has cleared up quite well, and this week’s analysis points to a bearish period ahead. With the correlations quite high between stocks and precious metals, the outlook for gold, silver and gold and silver mining stocks also appears bearish for the short term.
Long speculative positions in precious metals appear risky at this time. Long-term investments are not affected and it appears to still be a good idea to keep invested in the precious metals sector with this part of one’s capital, as it has been for some time. We have previously suggested moving some of the long-term capital from gold to platinum, and we continue to believe that this is appropriate approach. Platinum looks quite strong at this time. This statement is true for platinum on a standalone basis as well as compared to gold. Naturally, when gold and silver correct, platinum will likely correct as well, but we don’t think taking any actions is necessary (as we’re discussing the long-term part of your portfolio).
Precious metals moved higher in the past 2 days, but the situation is still not too bullish for the following weeks. The similarities between 2006 and today suggest that we may see another small move up that will be followed by a significant correction (that will create favorable buying opportunity). This is confirmed by the GDX:SPY ratio, the RSI level in the GLD ETF, gold price seen from the Japanese perspective and the bearish situation in the main stock indices
Therefore, the risk associated with opening long speculative (thus short-term) positions appears quite high when compared to the short-term upside potential. We believe that most traders should wait for a better opportunity and more favorable risk/reward ratio to enter long positions in the precious metals sector.
This completes this week’s Premium Update. Our next Premium Update is scheduled for Friday, March 2, 2012.
Thank you for using the Premium Service. Have a profitable week and a great weekend!
Przemyslaw Radomski

