
We like Warren Buffett. We respect Warren Buffett. We’d love to sit and have lunch with him one day. As an investor, Warren Buffett is in a class all of his own. But the Oracle of Omaha just keeps bashing gold at every opportunity.
In an article published in Fortune Magazine, based on his upcoming annual Berkshire Hathaway shareholder letter, Buffett again dismissed the yellow metal. It is hard to argue with a man whose bank balance is a zillion times bigger than yours. Obviously he has been right plenty and has the bank balance to prove it.
But meantime, all the while that he has been bashing gold, it has bulldozed its way up and gold bugs have been laughing all the way to the bank.
Buffet attacks gold with the usual weapons in the anti-gold arsenal: gold has no inherent value; it underperforms stocks over time and has merely become a self-inflating bubble in its long climb to record highs.
Buffett observed in a 1998 speech at Harvard that "Gold gets dug out of the ground, then we melt it down, dig another hole, bury it again and pay people to stand around guarding it. It has no utility. Anyone watching from Mars would be scratching their head."
At the time of his Harvard speech, the price of gold hovered at around $300 an ounce. If Buffett had invested just one of his many millions in gold that year, he would have $5.7 million today, that’s an average return above 13% a year.
And yes, it does make sense to keep gold in a vault. It’s valuable and rare. You keep it safe from theft-- it keeps you safe from inflation, banking collapses and the devaluation of fiat currencies.
The British economist John Maynard Keynes was another one who scratched his head when he denounced the gold standard as “a barbarous relic.” It was his countryman, Gordon Brown, who as U.K. Chancellor of the Exchequer, decided to sell off half of Britain’s gold in favor of paper assets between 1999 and 2002, when gold was at its low. How could he have known that gold would charge forward without looking back?
In his recent Forbes article Buffett wrote:
"This type of investment requires an expanding pool of buyers, who, in turn, are enticed because they believe the buying pool will expand still further… Owners are not inspired by what the asset itself can produce-it will remain lifeless forever-but rather by the belief that others will desire it even more avidly in the future."
"The major asset in this category is gold, currently a huge favorite of investors who fear almost all other assets, especially paper money (of whose value, as noted, they are right to be fearful," Buffett said. "Gold, however, has two significant shortcomings, being neither of much use nor procreative."
"True, gold has some industrial and decorative utility, but the demand for these purposes is both limited and incapable of soaking up new production. Meanwhile, if you own one ounce of gold for an eternity, you will still own one ounce at its end."
"What motivates most gold purchasers is their belief that the ranks of the fearful will grow. During the past decade that belief has proved correct. Beyond that, the rising price has on its own generated additional buying enthusiasm, attracting purchasers who see the rise as validating an investment thesis.”
Buffett notes that the current world stock of gold is about 170,000 metric tons, which if melted together, would form a cube of about 68 feet per side fitting comfortably within a baseball infield. At $1,750 per ounce its value would be about $9.6 trillion. "Call this cube pile A," he says.
"Let's now create a pile B costing an equal amount. For that, we could buy all U.S. cropland (400 million acres with output of about $200 billion annually), plus 16 Exxon Mobiles (the world's most profitable company, one earning more than $40 billion annually). After these purchases, we would have about $1 trillion left over for walking-around money (no sense feeling strapped after this buying binge). Can you imagine an investor with $9.6 trillion selecting pile A over pile B?"
Buffett points out that since 1965 the total return on gold (not adjusted for inflation) was 4,455%. But the total return on stocks was higher, at 6,072%.
Buffet is right that in times of peace and plenty it is probably better to invest in stocks, real estate, businesses, etc. But we read in the papers that there are riots in the streets of Athens, Iran is acquiring the means to make a nuclear bomb, the developed economies are borrowing money at 2 to 5 times the rate of their GDP growth, and the world’s major central banks keep printing easy money, currencies and bonds have been debauched and countries in the developed world have lost their triple A ratings.
These are not times of peace and plenty, which is why we prefer gold (and silver and platinum) right now.
Speaking of triple A ratings, we looked it up and all three major ratings agencies, Standard &Poor, Fitch and Moody’s agree on only nine countries with the coveted rating triple A, “stable”, rating. Most tend to be smaller, less liquid economies. They are Australia, Canada, Denmark, Germany, Netherlands, Singapore, Sweden, and Switzerland. That’s it. In times of trouble it would be impossible for the world’s investors to pile into these ultra-safe bonds. There are simply not enough of them to go around.
This week Moody’s Investors Service cut its ratings on Italy, Spain, Slovakia, Slovenia, Portugal and Malta and issued warnings of possible future downgrades for Britain, France and Austria. A lower rating can lead to higher borrowing costs for government.
There seems to be a change in market psychology. Whereas before, a downgrade of a sovereign nation caused market hysteria, now the downgrades seem to be greeted with a yawn rather than fireworks. Moody’s action caused only modest ripples Tuesday across global trading in stocks, bonds and currencies. Some of Moody’s credit-rating moves had already been anticipated by markets, after rival Standard and Poor’s stripped France of its coveted triple-A status last month, Moody’s left France at triple-A but lowered the country credit outlook to "negative."
Moody’s surprise move was aimed at Britain’s credit rating. While leaving the U.K. at triple-A, it changed the outlook to “negative,” a sign that the country’s economic fundamentals could deteriorate to the point it would no longer qualify for the highest credit rating.
We would say to Warren Buffet that at a time when countries such as France, the United Kingdom and the United States no longer enjoy triple A "stable" rating on their credit worthiness, that is a good time to have some gold in the vault and let the Martians scratch their alien heads as much as they want.
Let's begin this week's technical part with the analysis of the USD Index. We will start with the very long-term chart (charts courtesy by http://stockcharts.com)
USD Index
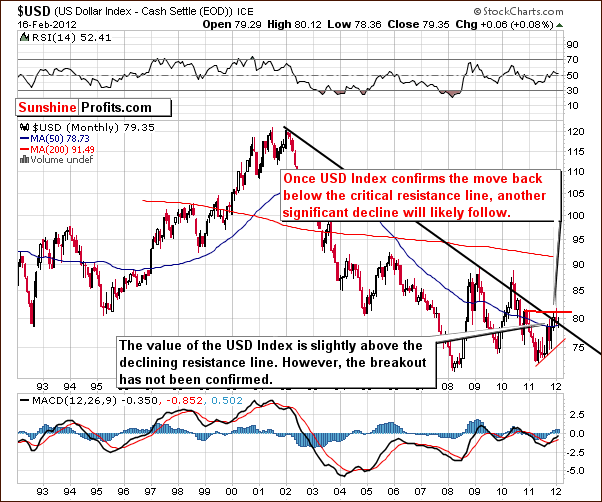
Our first chart this week is the very long-term USD Index chart. There is basically no change this week as the daily index movements have been too small to be visible from a 20-year perspective. The situation is still somewhat unclear for the long term but appears to be more bearish than not.
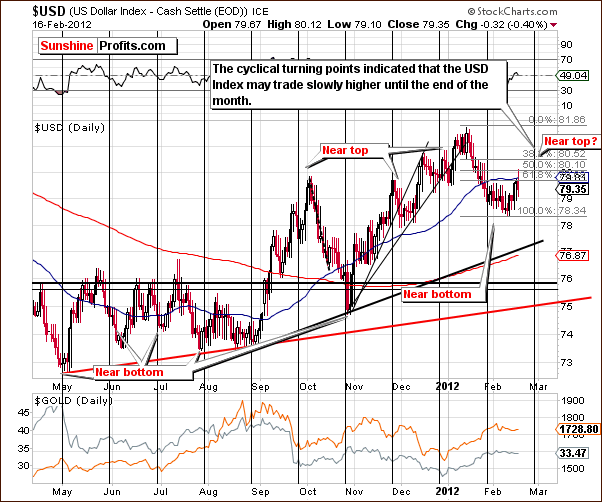
In the short-term USD Index chart, a small bounce was seen this week correcting about 50% of the previous downswing. The index is still relatively far from its next cyclical turning point. With a local top likely a few weeks away, it seems probable that some sort of rally will take place until then. The most likely scenario is for a day-to-day pretty much sideways movement with a gradual upward direction. An index level of 80.5 is a likely upside target over the next few weeks. This is also quite close to the highest Fibonacci retracement level based on the 2012 decline.
Summing up, the situation for the USD Index still appears to be a bit more bullish than not for the short term as the next cyclical turning point is approaching and will likely coincide with a local top. The long term appears more bearish than not with declines likely beginning after the local top is reached in late February or early March.
General Stock Market
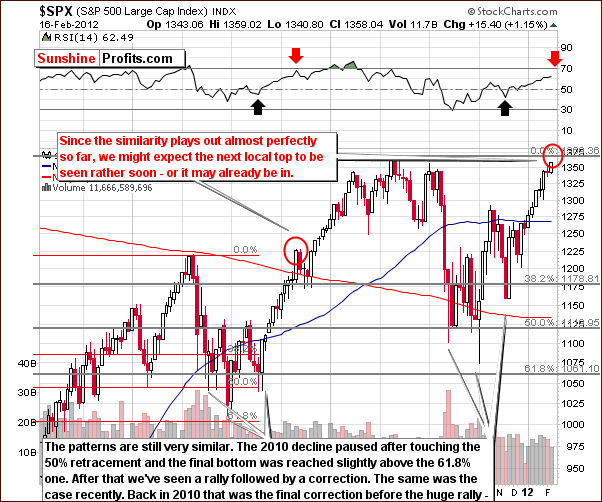
In the long-term S&P 500 Index chart, we see that a local top may already be in or is about to be reached. The significant rally of the past month without a meaningful correction increases the likelihood of a local top being formed soon. Markets simply cannot continue to move higher indefinitely without corrections.
As we compare recent trading patterns with the 2010 upswing, similarities are still in place. A continuation of this anomaly would imply that a correction is quite possible soon and we are near a local top now. Although it can’t be seen on the above chart, the Dow Jones Industrials and the Japanese Nikkei have both reached important resistance levels as well, a fact which also points to an end to the recent rally (or at least a pause) for these markets and the likely formation of a local top.
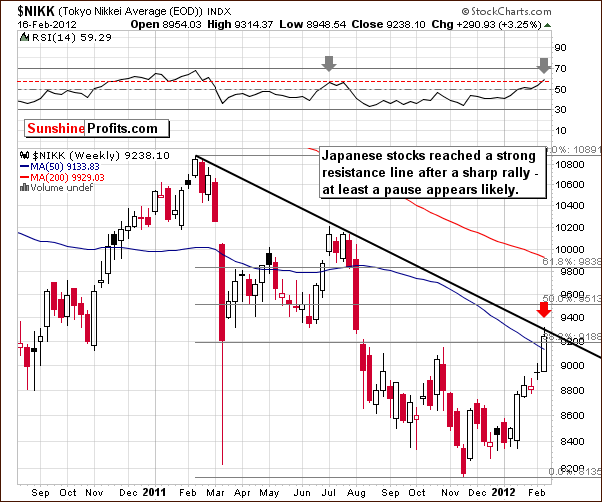
In the medium-term Japanese Nikkei chart, we see that a strong and clearly visible resistance line has been reached after a period of rally which began early this year. The Japanese stocks are now at the first Fibonacci retracement level based on the 2011 declines. The RSI level here is also at a level consistent with previous local top.
It seems that the local top could be in and this will likely lead to and confirm tops in many markets around the world since all are closely tied on a short-term basis. The financial markets are highly integrated and globalized, and local tops are frequently seen close to the same time all around the world.

In the Broker Dealer Index (proxy for the financial sector) chart this week, we have some bullish implications, but it must be kept in mind that these are for the medium term, not the short term. At this point, we could still see a correction in the main stock indices and a verification of the breakout here. The financials then could move back to the previously broken declining resistance line based on several 2011 highs.
Summing up, the situation in the general stock market is bearish for the short term, as important resistance lines have been reached or are now close at hand. After a significant rally without a meaningful correction, a downturn would be in tune with previous trading patterns and current investor sentiment.
The financial headlines across the Internet have generally shown that the media is very bullish for stocks at this time (General Motors’ profits highest in years!). Combining this fact with our bearish technical indicators suggests that a local top is very close. More on this topic will be covered later in this week’s Premium Update – in the mining stocks section.
Correlation Matrix
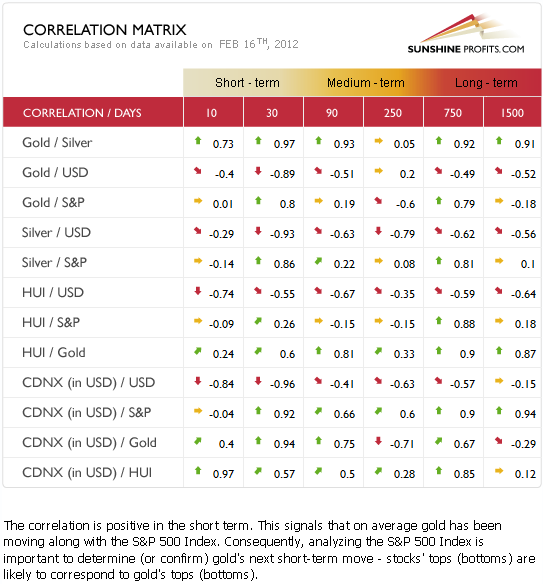
The Correlation Matrix is a tool which we have developed to analyze the impact of the currency markets and the general stock market upon the precious metals sector. The metals and currency markets are negatively correlated while gold and the general stock market show a positive correlation. The pending local top in the general stock market is therefore likely to be bearish for the precious metals sector.
The two main short-term drivers of the precious metals sector, stocks and currencies are both providing rather bearish influences at this time. Although the long-term fundamental picture is the most important, the short term columns here should not be ignored when the coefficients show significant strength with precious metals and other markets.
Gold
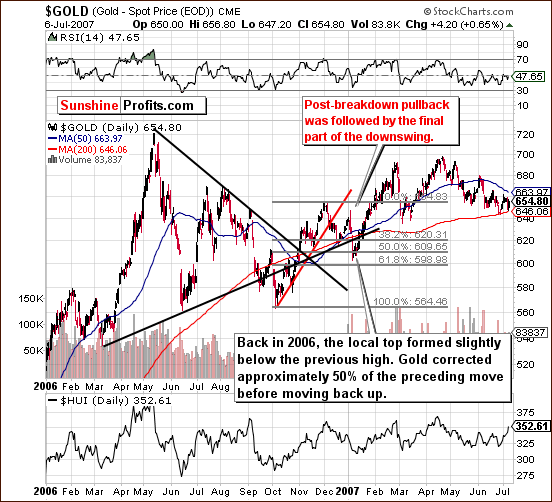
Once again this week we have included gold’s chart from 2006-2007 so that we can see the similarities between 2006 and 2012 and perhaps have a better understanding of what we can expect in the weeks ahead. The post-breakdown pullback and the final part of the decline seen in 2006 is important going forward from where we are today.
Small bounces are quite normal during periods of decline, as it is rare that prices drop for many days in succession. The important point here is that we expect the decline to correct about 50% of the previous upswing before it’s over – just as it was the case in 2006. It’s also vital to note that there was precisely one pullback during the correction.
Another important observation is the length of the correction period back then. As seen in the chart, the correction was completed over about a five week period. Gold’s current correction is in its third week now, so it seems that we may have a couple of weeks remaining before gold is likely to reach its next local bottom and reverse to the upside once again.
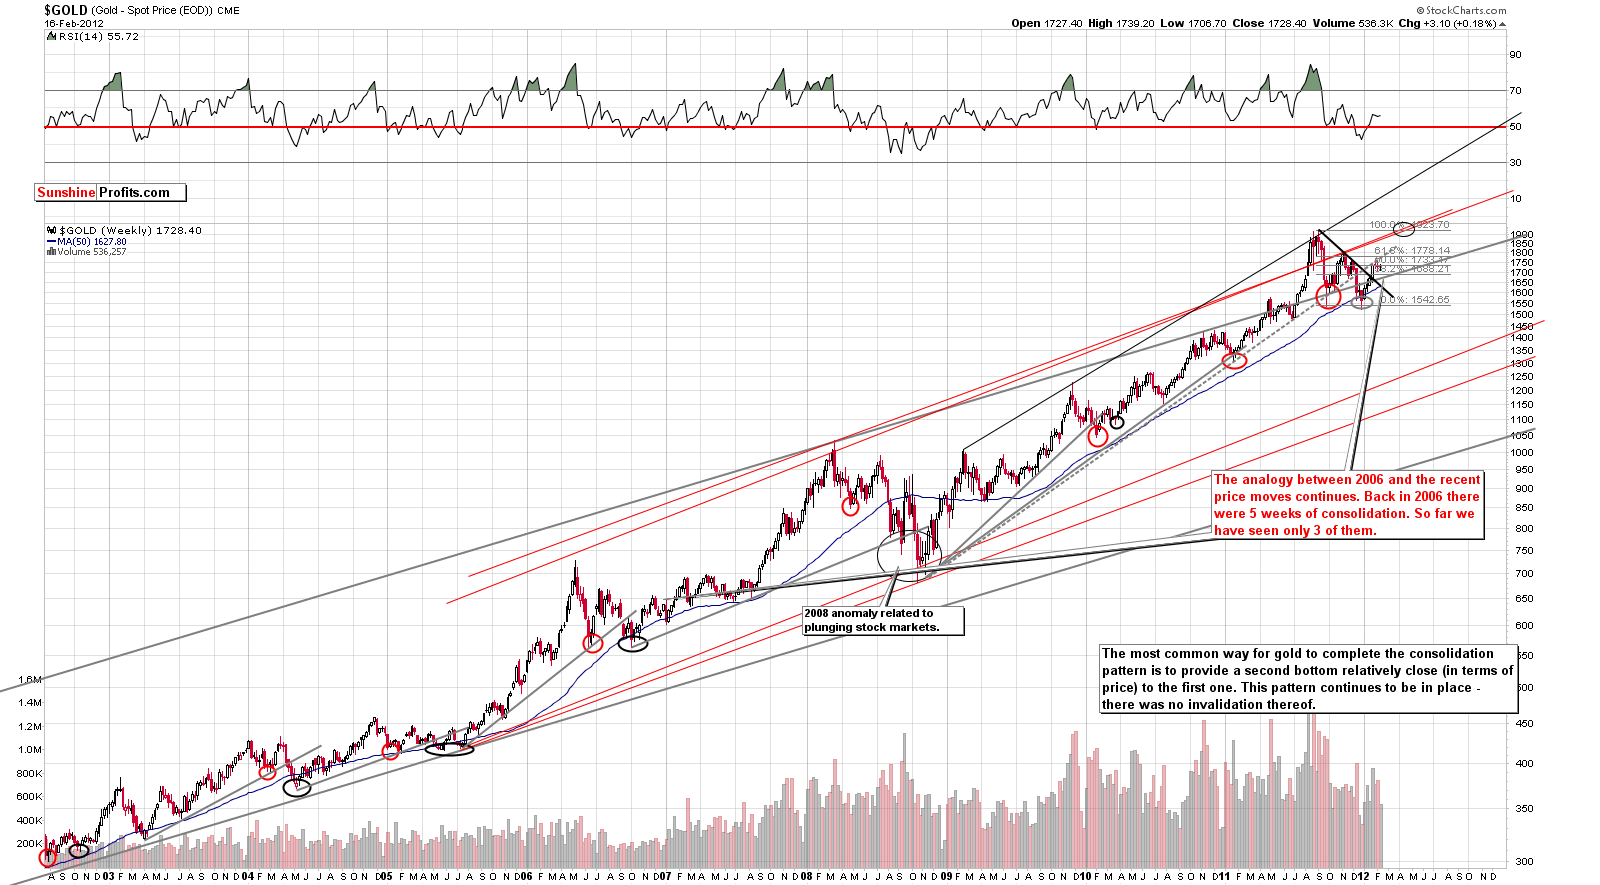
In this week’s long-term gold chart (please click the above chart to enlarge), a small consolidation is visible but we have not yet seen a true correction.
Keeping in mind the analysis of the 2006 gold chart, it seems likely that the breakout above declining resistance line will be verified in terms of price – by a visible move lower. So far, the correction is not really visible from the long-term perspective. We realize that this is not a sufficient factor for arriving for the final conclusion, but as you will see in the following part of this update, we have also many other indications. For instance, this phenomenon is even more visible when taking a look at gold from the non-USD perspective.
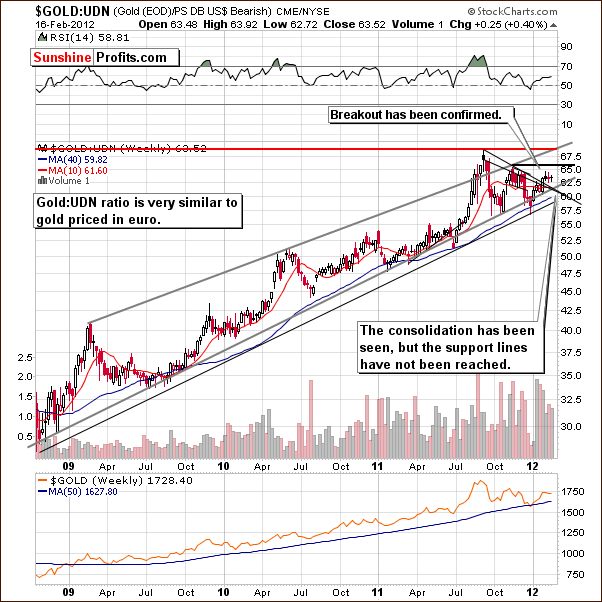
This week’s chart of gold from a non-USD perspective gives us some of the same conclusions we have discussed previously with slightly different data. We also see three weeks of sideways trading here without a visible correction underway. Two more weeks of similar trading patterns seem quite possible based on this chart, as a strong support-resistance line is now in place to slow any quick moves to the downside. For now, gold price remains visibly above this particular level.
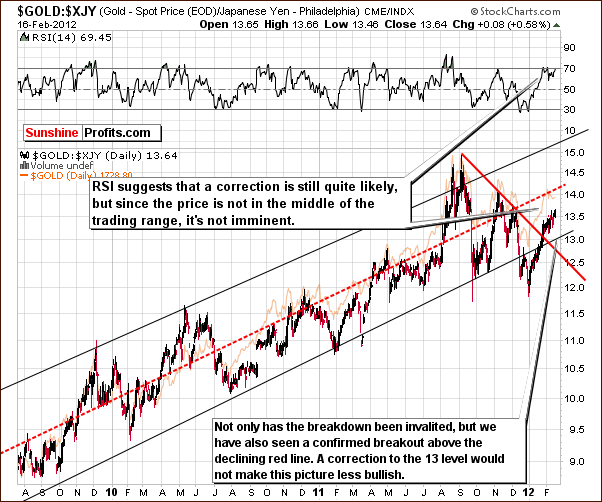
A look at the long-term chart of gold from the perspective of the Japanese yen suggests that no correction has yet been seen here. The RSI level has been holding around 70 for some time now, and in the past, this has typically been followed by a period of correction. We saw this about a year ago when the RSI plummeted from close to 70 down to nearly the 30-level and the index level moved from 12 down to 11. This was about an 8% decline in the index. It seems that we may see some sort of correction here, possibly in the coming 2 weeks.
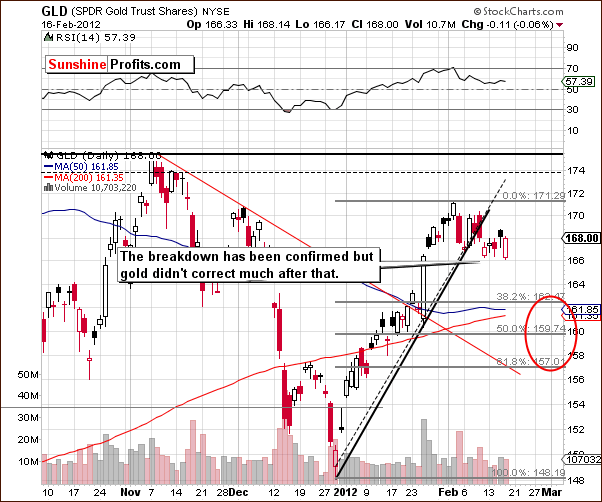
In the current, short-term GLD ETF chart, you may notice that we have expanded our downside target area since no true correction has yet been seen. Although this target area now ranges from $157 to $163, the upper part of the ellipse is still more likely to stop the coming decline, probably between $160 and $162. Finally, the breakdown has now been confirmed as prices have closed below the rising support line for more than three consecutive days.
Summing up, the outlook for gold appears slightly more bearish than not at this time. The medium and long-term trends still appear to be up, but the short term will likely see declines based on the recent breakdown and the similarities with 2006. Back then, 50% of the proceeding rally was corrected over a five-week period. It seems that gold will reach its next local bottom in late February or early March, roughly two weeks from now.
Silver
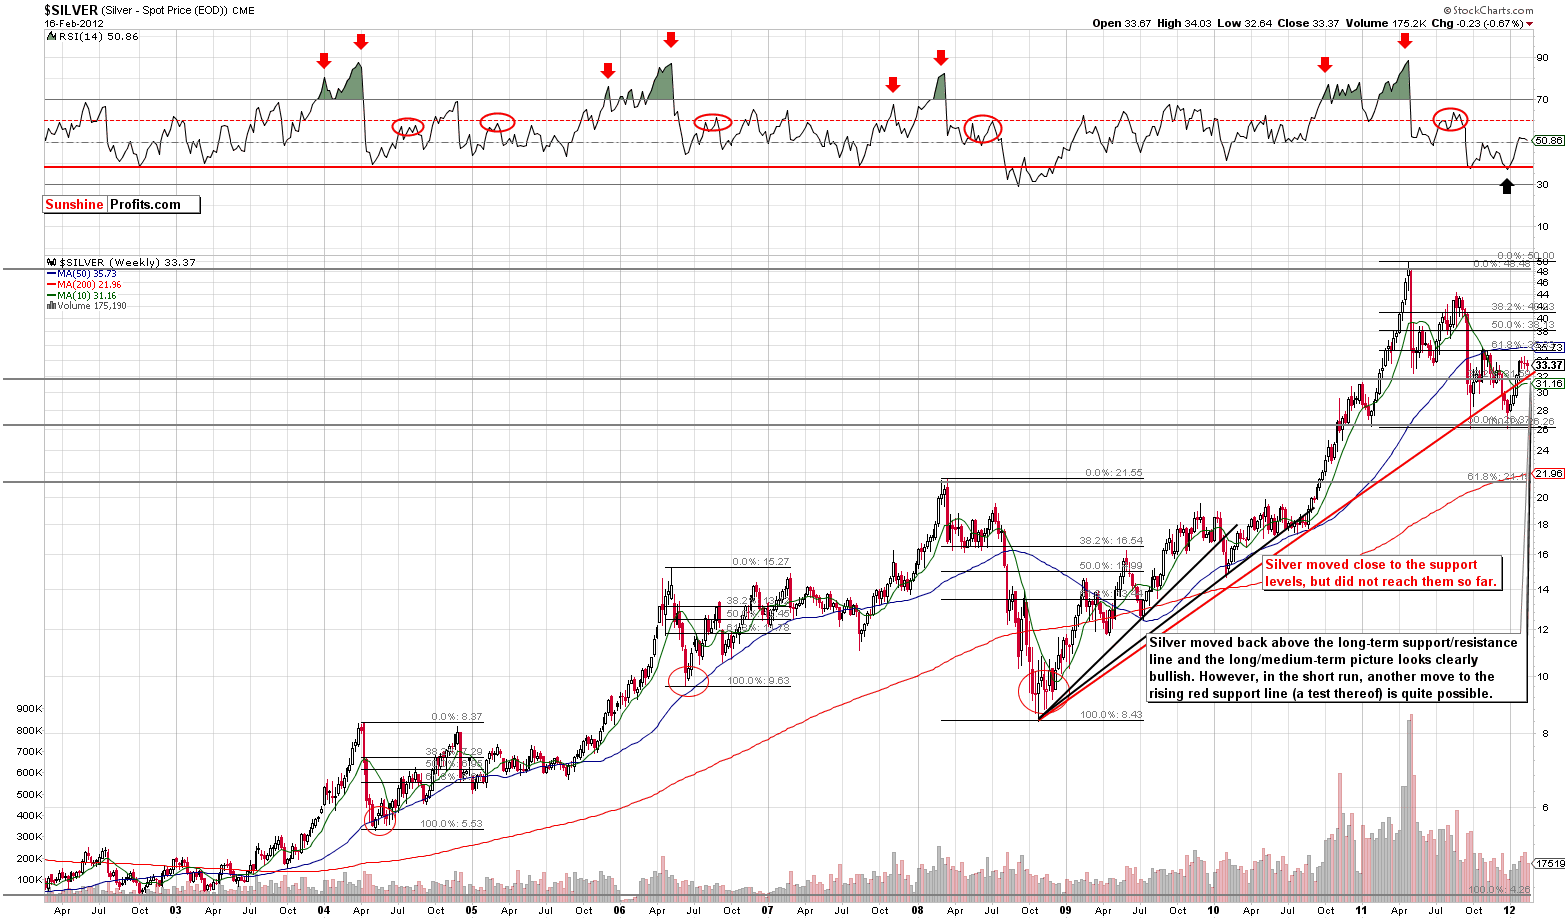
We begin this week’s silver section with a look at the long-term chart (please click the above chart to enlarge) where we see many of the same factors which surfaced in our analysis of gold. Silver has been trading sideways for about three weeks now and is still above both the rising red support line and a key Fibonacci retracement level based on silver’s 2002-11 rally. Since this support line has not been reached, it seems likely that the recent weakness in silver could continue to be seen for 2 weeks or so.
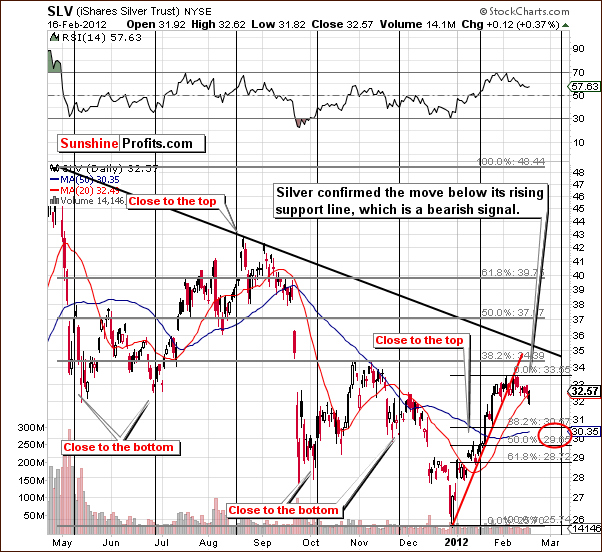
Looking at the short-term SLV ETF chart (please click the above chart to enlarge) we see some additional and interesting information this week. A cyclical turning point is coming in early March, and this makes the previous points in this week’s Premium Update even more probable, especially those concerning gold and the expected timing for the next local bottom.
A local bottom in early March for the yellow metal will be consistent with what we saw in 2006 and with the cyclical turning point seen in this chart. The USD Index also has a cyclical turning point close to this time period. It seems quite likely that silver too has two weeks of price corrections ahead of it.
Summing up, the situation for silver is more bearish than not at this time. The medium and long-term trends are still up, but the short term will likely see further declines until a late February or early March local bottom.
Gold and Silver Mining Stocks
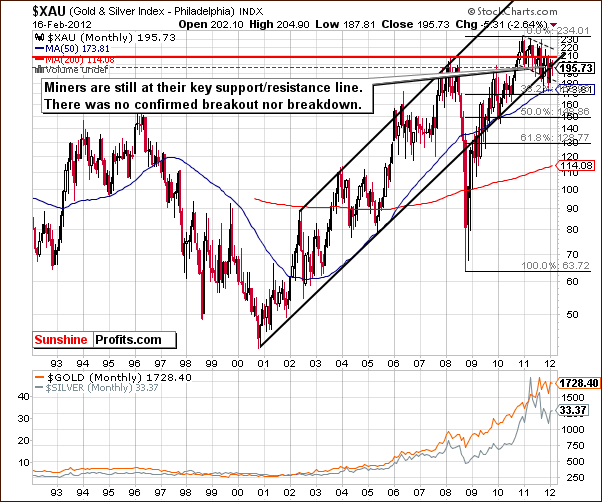
In this week’s very long-term XAU Index chart, we see the index at a key support level, and it has been in this trading range for many weeks now. No decisive move has been confirmed, and even if a decline is seen, there is no proof that a bigger slide will follow, simply because it will take weeks (or the slide itself) before the move is confirmed. At this time, we are simply waiting for more proof as no substantial signals have been seen here recently.
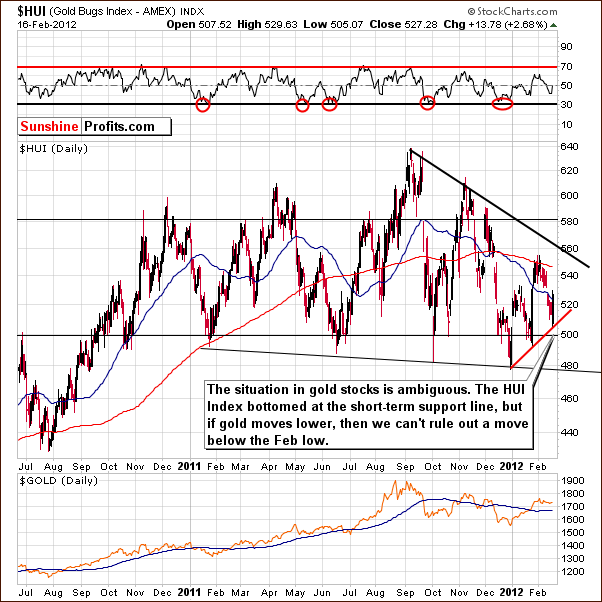
In this week’s long-term HUI Index chart, we see that an important short-term support line was recently reached. The index then bounced sharply and this appears to be a positive sign at first glance.
Also, the general stock market rallied at this time as well, so the development here is not all that significant as there was a good non-precious-metals-related reason for miners’ move up.
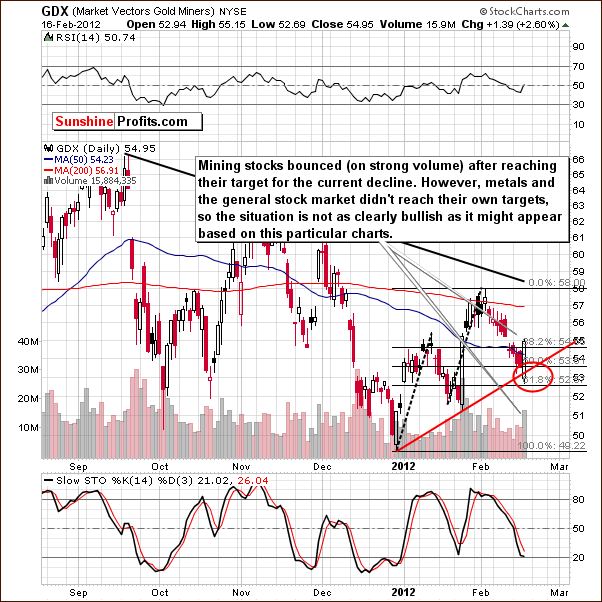
In the short-term GDX chart this week, we see that the miners have reached a downside target area and bounced. The bounce was seen on significant volume and this is a bullish factor. There is also a bearish side to this picture however.
In the past few weeks, the mining stocks have been one of the weakest sectors in the stock market. More often than not, at the end of a rally in the market, the weakest sectors seem to outperform those which have been the strongest. This anomaly is also built in a way into our SP Extreme Indicators (these are the ones that have been particularly reliable in the past months).
Consequently, the mining stocks’ outperformance over other sectors on Thursday could be an indication that a top is close or is already in for the general stock market. We are not yet convinced about the single move seen by the sector this week, even though it does have bullish implications when examining it on a stand-alone basis.
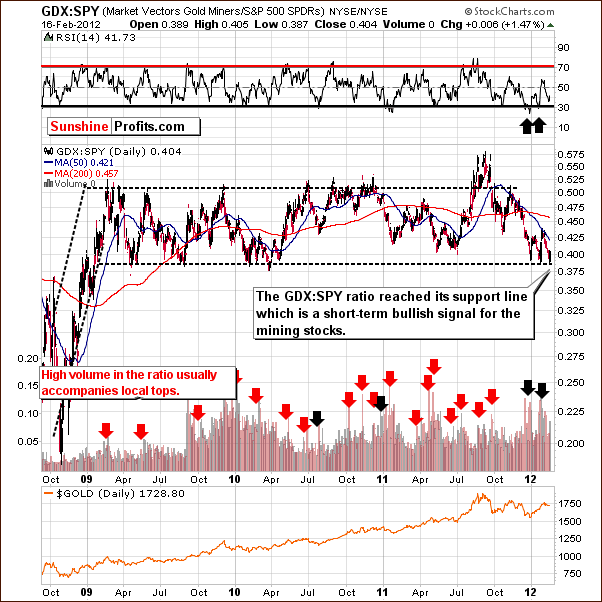
In the GDX:SPY ratio chart, which compares the performance of mining stocks with the general stock market, we see a weak bullish signal. The ratio is at a support line and when that was the case in the past, a local bottom soon followed. However, the immediate-bottom signal was seen when the above was combined with the RSI levels very close to 30 (it’s currently over 40), so it seems that while we may be close to a local bottom, we are not yet at it. This is consistent with what we wrote regarding gold and silver earlier in this update.
Summing up, at the first sight, the situation in mining stocks appears to be bullish for the short term but when taking into account the general stock market and the gold and silver markets, we are not as convinced that the situation is truly bullish.
If gold and silver decline, then we can expect miners to move lower as well. However, we believe that the mining stocks will not move below their 2011 lows.
Sunshine Profits Indicators
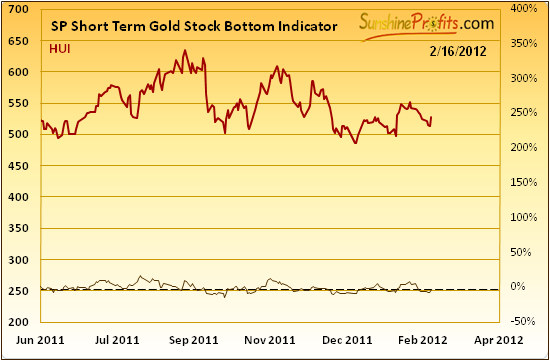
In our SP Short Term Gold Stock Bottom Indicator, we see that a buy signal has flashed (the signal line was below the dotted line and it started to rise). The implications of this development are very short term in nature, however. Most of the rally could have already passed, so we put little weight on this now – especially that the 2006 comparisons indicate a short-term bounce is possible before the decline resumes and period of correction completes. Although the indicator agrees, it seems best not to go long at this time as other factors suggest otherwise. A more prudent action seems to be to wait for further confirmations.
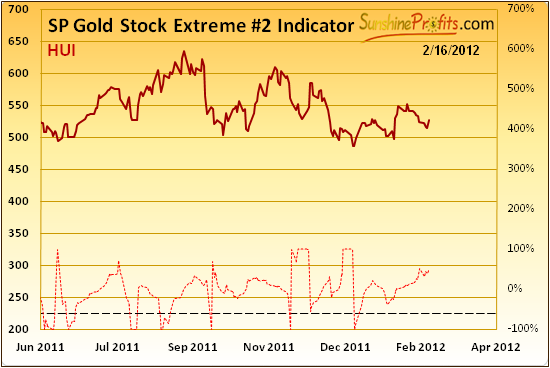
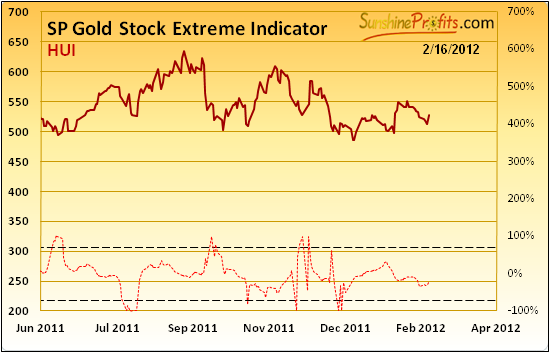
Our two SP Extreme Indicator charts have been very reliable in recent months (bottoms were seen whenever the signal lines moved above or below any of the horizontal dashed lines). These charts show no confirmation that the bottom is in, and the fact that we have no signals from these two reliable indicators is really important. Quite simply, at this time what we don’t have appears more important than what we do have. Please note that as our subscribers, you can monitor all of our indicators on a day-to-day basis.
Letters from Subscribers
Q: I think the Gold and Silver commentary does not incorporate the mindset of investors between the early 19th Century and now. It is important to realize that Gold and Silver climb only somewhat due to the absence of reserve currency and lack of confidence in dollars.
I cannot expect any short- to medium-term confidence build up for dollars, hence Gold and Silver will eventually climb to a level where reserves provide comfort to individuals and governments.
A: We agree that gold and silver will very likely eventually climb to very high levels. However, please note that in the short- and medium-term there can be serious price fluctuations that don't depend on the long-term positive fundamental situation. Take the 2008 plunge in gold, silver and mining stocks – was the fundamental situation to blame? Actually, what was happening was that investors (mostly institutions) were purchasing dollars in order to remain liquid and were viewing gold (or derivatives of gold) as just another speculative asset class that they needed to sell in order to get cash. At the time, investors' perception of gold was not in tune with the true fundamental picture. The point is that investors' and traders' sentiment (plus multiple other short-term factors) hovers around the fundamental value of assets (and precious metals are no exception), which makes short-term price swings possible and tradable.
Q: Please advise on the perfect time to buy gold (for the long term). We think the week of March 29th looks perfect. Should we look for a price of USD 1,450 to go long? Thanks.
A: While this is not an investment advice, we believe that the perfect time to go long gold for the long term is now. In particular, we think that waiting for gold to move below $1,600 to enter with one's long-term capital is a bad idea. Gold may not move that low (it is likely that it will not, in our opinion) and it will be difficult to reenter the market once it moves sharply up again.
Based on our research, the best approach for one's long-term gold investments is to remain invested through almost the entire bull market. This means that one should get out (and also not with everything) only during the least favorable moments for gold (meaning times when the probability of a big downturn in the precious metals sector is very high).
The last time we suggested getting into the precious metals market with one's long-term capital was on September 26th, 2011 and we have not suggested getting out with this part of the capital since that time.
Q: Italy’s central bank has a large gold reserve. Is there any way to know whether this country will eventually dump its gold (sooner rather than later) to pay for its deficit? How about the gold reserves of Greece, Germany, France, England, Spain, and the IMF? Is there any sign to watch before it happens and dramatically sends the value of gold down? Thank you.
A: We seriously doubt that any country (especially the heavily indebted ones) will be willing to sell their gold in order to pay for their deficit. The key point is that the value of gold that the abovementioned countries have is generally only a tiny fraction of their debt. So even if they sold their gold, it wouldn't really change their position.
The more realistic scenario in our view is that all of these countries will try to talk their way out of trouble (did Greece sell any of its reserves or did it ask for help without selling gold at all?), and if that doesn't help they will try to print their way out of trouble (creating money either directly or via low interest rates or by keeping them lower for longer). In addition, governments are known to be some of the worst players in the investment business. They sell at the bottom (think: "Brown Bottom") and become eager to buy after the price has risen for a long time (we see that right now). So, we don't view official sectors' sales as a threat to the gold market. You will find more of our views on that topic in the Letters from Subscribers section in the Nov 4th, 2011 Premium Update.
Q: I notice you use Fibonacci analysis for the stock market but don't apply it to gold. If you do a Fibonacci chart from the September high of $1925 to the December low of $1525 you find that the current rally has not quite retraced 61.8% of the decline. This would imply a resumption of the intermediate bear market in gold. Do you conclude differently?
A: We do apply the Fibonacci analysis to gold. However, we apply it in a different way than you described. The reason is the big picture. Please take a look at the big long-term gold chart that we featured earlier in this Premium Update. We believe that at the current juncture, the factor that has the biggest impact (technically speaking) on the intermediate trend is the breakout above the declining resistance line (based on the two major tops of 2011). The reason for this is that during very similar stages, it was the breakout above similar resistance lines that marked the start of another major rally. The 61.8% Fibonacci retracement based on the previous local top and the final bottom wasn't very significant, so we prefer to emphasize the former factor.
Summary
The USD Index is more bearish than not for the long term and more bullish than not for the short term. Index levels will likely rise slightly over the next few weeks with a turnaround probable in early March. Declines are then likely to be seen. The general stock market appears to be close to a local top or even at one right now. A long period of rising prices without a meaningful correction plus the self-similar pattern and overall bullishness in the media create a quite bearish mix for the short term. Both the currency and stock market developments imply that precious metals prices are likely to decline in the short run.
Comparisons to 2006-2007 suggest that the end of the gold correction period is likely about two weeks away. Gold and silver prices will probably decline to $160 to $162 for the GLD ETF and $30 to $31 for the SLV ETF ($1650-$1670 for spot gold and $31-$32 for spot silver). Mining stocks could continue to rally for a day or two, but generally they too are likely to move lower once gold and silver complete their correction. However, we don’t see miners moving below the 2011 lows.
Our SP Extreme Indicators do not indicate that it is time to buy. It seems best at this time to keep long-term holdings intact and hold speculative capital out of the market awaiting a clearer buy signal. This seems to be the most prudent course of action at this time. Even though this is not our main area of analysis, for investors in the general stock market, now may be the time to consider getting out or even shorting stocks as declines appear close.
This completes this week’s Premium Update. Our next Premium Update is scheduled for Thursday, February 23, 2012 (one day ahead of our regular schedule). Naturally, you will be informed as soon as we believe that it's good idea to bet on higher metals' prices with your speculative capital.
Thank you for using the Premium Service. Have a profitable week and a great weekend!
Przemyslaw Radomski

