
“It was the best of times, it was the worst of times, it was the age of wisdom (for those who invest in gold) , it was the age of (central bank) foolishness, it was the epoch of belief (in Chinese growth) , it was the epoch of incredulity (in fiat money), it was the season of Light, it was the season of Darkness, it was the (Arab) spring of hope, it was the winter of (Syrian) despair.”
With several of our own additions in parenthesis, these are the opening lines of the famous novel “A Tale of Two Cities,” by Charles Dickens whose 200th year birthday was celebrated around the world this week. His words seem just as true and relevant today as in the time in which they were written.
Greece played the Artful Dodger this week and missed another deadline to approve conditions for a second €130bn bail-out on Tuesday night because of last-minute haggling with international lenders over emergency spending cuts. Negotiations to save Greece from a disorderly default are now teetering on the edge.
The delay fueled anxieties that Athens may be forced into a messy default next month and triggered concern over whether Greece remains committed to fiscal reform after two years of failing to implement measures agreed in return for financial support. Greece has already missed two deadlines this week. Finally a deal was presented for approval at a meeting of eurozone finance ministers Wednesday only to be sent back to Greece as incomplete with a fresh set of demands and an urgent deadline. The eurozone finance ministers dismissed as incomplete a reputed €3.3bn package of Greek budget cuts and sent the country’s finance minister back to Athens with a fresh set of demands and an urgent deadline. They also warned of more intensive involvement in the Greek economy to improve tax collection and accelerate the sale of state-owned assets.
Earlier in the week the Great Expectations that a Greek rescue plan will be completed drove the dollar down sharply against the euro and boosted gold 1.5 per cent on Tuesday.
Gold could face a short-term pullback if Greece strikes a deal, as it may hurt the appeal of safe-haven assets, but on the other hand it will be good for the euro (bearish for USD Index), which might be bullish for gold. In the long run, the lingering euro zone debt crisis is expected to support sentiment in gold.
From what we read in the press, things in Greece can’t be that bad. They seem to be worse elsewhere or else why would Greece be building a six-mile-long fence topped with razor wire on its border with Turkey to deter illegal immigrants. Thousands of illegal immigrants cross from Turkey into Greece at this point each year, often traveling from there to other parts of Europe.
There was a study released this week published by the Credit Suisse and the London Business School that says that gold prices have been too volatile to play a reliable role as a hedge against inflation over the past 112 years.
To which we quote Ebenezer Scrooge -- “buh humbug.“
While inflation does not reduce gold's real value, it has no yield or income flow and the precious metal has given a far lower long-term return than equities in the period since 1900, or 120 years, says the study. Generally, the analysis is conducted based on periods when gold was money and where it was not and we believe that these two should not be mixed.
We realize that gold does not give income or interest. People invest in gold is a search for yield through capital appreciation or as a safe haven – or as money. When interest rates are close to zero or negative in real terms, gold begins to glimmer. The US, Europe, the UK, China, India, gold’s biggest markets, all have negative real interest rates. It is true that the past 112 years have not all been good for the yellow metal. There have been Hard Times. Yes, there are bull markets and there are bear markets and we are in the midst of a bull market in gold right now.
In the period since 1900, gold gave a real return of 1.1 percent in sterling terms and its value fluctuated widely, said the study. "Gold is the only asset that does not have its real value reduced by inflation. It has a potential role in the portfolio of a risk-averse investor concerned about inflation," it said. "However, this asset does not provide an income flow and has generated low real returns over the long term. Gold can fail to provide a positive real return over extended periods."
True. That’s why we are invested now, while gold is in the midst of a bull market. When it swings into a bear market we’ll consider other options or perhaps evaluate the profitability and risk of trading the downswing – impossible to tell at that point. However, the key issue is that one does not have to be fully invested in the precious metals sector during bear markets – what is the assumption of the study.
Mohamed El-Erian, CEO and co-chief investment officer of bond fund giant PIMCO, said that given the fragile global economy and geopolitical risks, investors should be underweight in equities while favoring "selected commodities" such as gold and oil.
Obama seems to have run into a good streak of luck in his bid to get reelected president. Just in the nick of time, the U.S. economy is improving, at least as evidenced by last Friday’s jobs report. Payrolls numbers are up by 243,000 jobs. Unemployment is down to 8.3 percent.
Charles Dickens said: “Do all the good you can and make as little fuss about it as possible.” To see what good we can do for gold investors, let's begin this week's technical part with the analysis of the US Dollar Index. We will start with the very long-term chart (charts courtesy by http://stockcharts.com.)
USD and Euro Indices
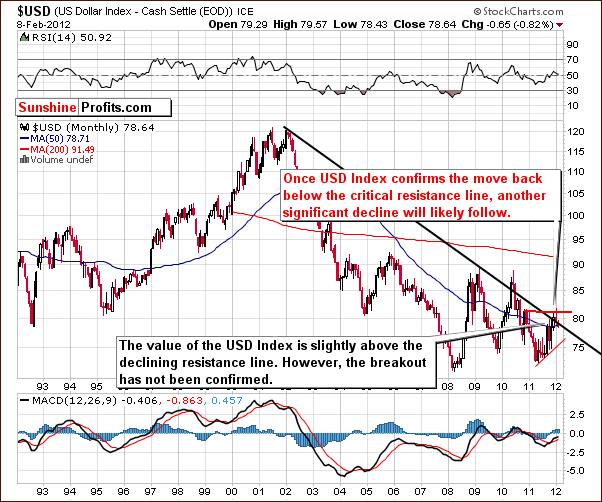
Our first chart this week is the very long-term USD Index chart, where we saw no significant changes. Thursday’s closing index level is slightly below that of a week ago, but the recent move back below the long-term resistance line has not yet been confirmed. The index level is now more or less right at this support-resistance line, and the medium/long-term situation is slightly more bearish than not.
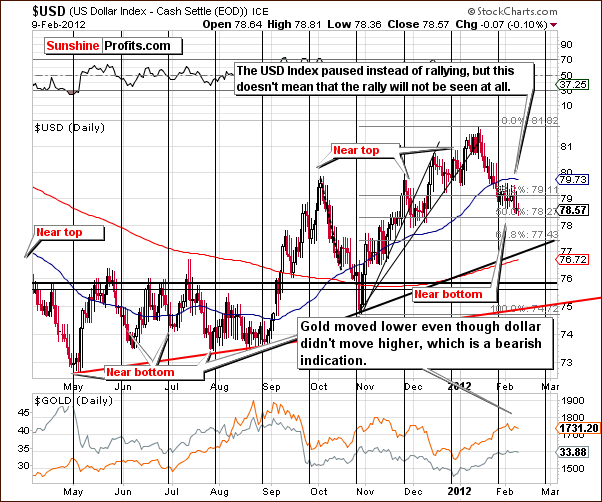
In the short-term USD Index chart, we see that the index “somewhat bottomed” at the cyclical turning point. Instead of a rally, a pause has followed with some sideways trading and small moves to the downside although declining at a much slower pace than seen in previous weeks. It seems likely that the index could actually rally to 80 or 80.5 in the very short term but the outlook for the medium term is bearish.
The most important development here is that gold declined slightly this week despite the fact that the USD Index declined a bit as well. This is a bearish indication for the yellow metal and the pace of declining gold prices is likely to increase as the USD Index moves higher.
Summing up, the situation for the USD Index appears rather bearish for the medium term but bullish for the short term. The lack of reaction in gold’s price to the slight weakness seen in the USD Index this week is bearish for gold and the rest of the precious metals sector.
General Stock Market
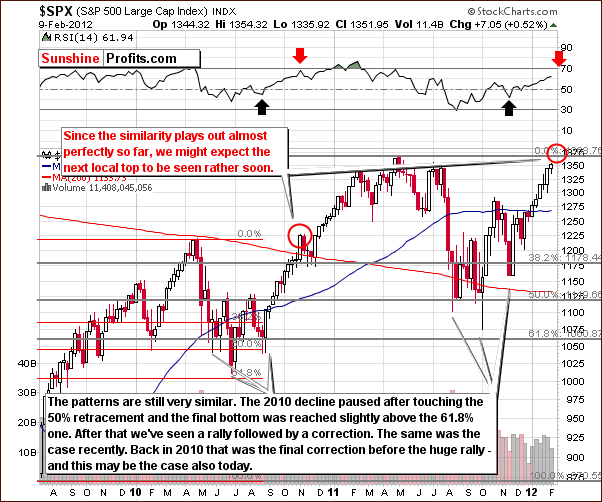
In the long-term S&P 500 Index chart, the situation described in last week’s Premium Update has continued.
The next local top will probably be close to the level of the 2011 high. The recent trading pattern has been consistent with the period leading up to the local top in 2010-11. In October-November 2010, declining prices were seen for a few weeks but were quickly followed by a continuation of the rally. We may have a similar situation here.
RSI levels should be looked at as well and are also indicating that a rally is likely ahead. It appears that it could last for two to four weeks as the RSI level will then likely be close to 70. This has coincided with local tops in the past.
This continues to be a very good description of what’s likely to happen next (and what has been seen this week).
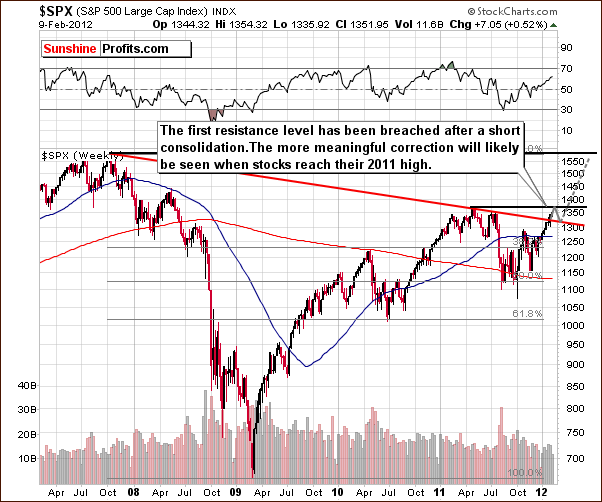
In the medium-term S&P 500 chart, the index has broken the red declining resistance line after a small pause. Stocks are likely to move higher towards their 2011 highs but a period of consolidation may be seen first. Our previous comments are up-to-date:
We once again see that an upside move up to the level of previous highs could be in the cards if the recent pattern holds. If the index reaches this 1,375 level and then consolidates, pauses or declines slightly (likely outcome in our view), this will confirm the breakout above the red declining resistance line. Another move to the upside would then seem likely.
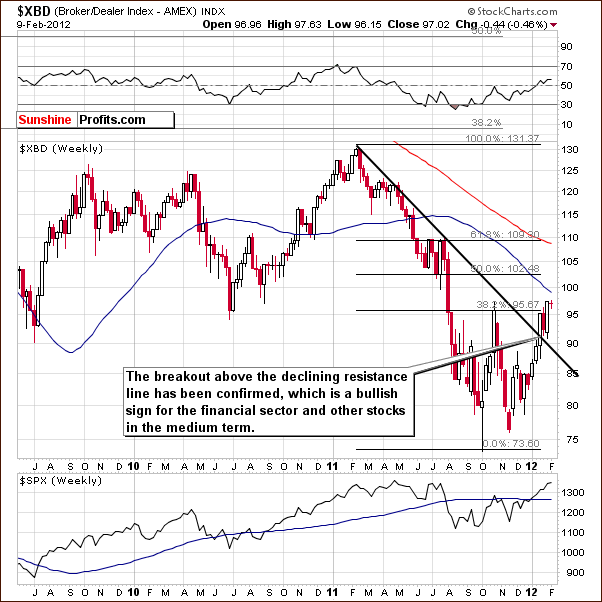
In the Broker Dealer Index chart this week, we have seen a confirmation of the breakout above the declining resistance line. This has bullish medium-term implications for the financial sector as well as the general stock market on the whole.
Summing up, the situation for stocks continues to unfold as we have discussed in previous updates. Once the declining resistance line is surpassed, stocks are likely to move towards the level of their 2011 highs and a local top will likely be seen at that time.
Correlation Matrix
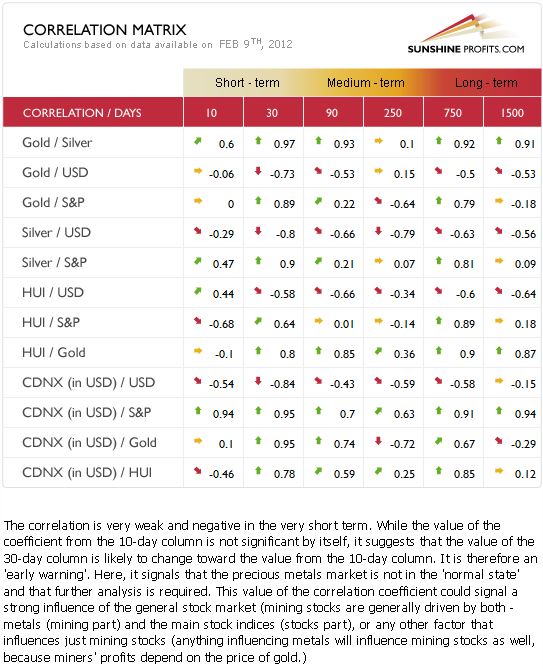
The Correlation Matrixis a tool which we have developed to analyze the impact of the currency markets and the general stock market upon the precious metals sector. This week we have seen a return to normalcy in the 30-day short-term column. There is a negative correlation between the USD Index and the precious metals and a positive correlation between the precious metals and stocks.
Overall, caution appears warranted at this time since many of the implications from analysis of this week’s USD and stock charts are mixed. The short-term appears rather bullish for stocks and also bullish for the USD Index. For the precious metals sector, the overall situation is mixed at best.
A very interesting development this week is that gold stocks moved independently from the moves in the underlying metal over the past ten days. The correlation between gold and silver is weaker than it normal as well. This suggests that a change appears to be coming – perhaps in the form of a correction.
Gold
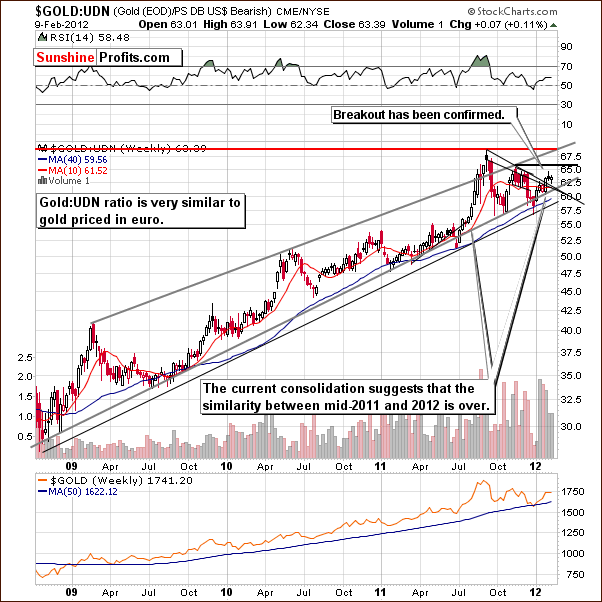
Little has changed this week in the very long-term view of gold in terms of dollars. Since our focus each week is geared towards the charts which are most important in the present tense and thus worthy of analysis, we begin this week’s gold section with the chart of gold from a non-USD perspective.
This week there has been a weak consolidation from a non-USD perspective and the strong similarities to the trading patterns of mid-2011 are no longer in place. With these developments, it is unlikely that a move to the upside will be as sharp this time. We have seen two consolidations this time and last year there was only one small stop, after which gold’s price immediately shot upward. This chart suggests that a sharp rally is not a likely probability and that further consolidation is quite possible at this time.
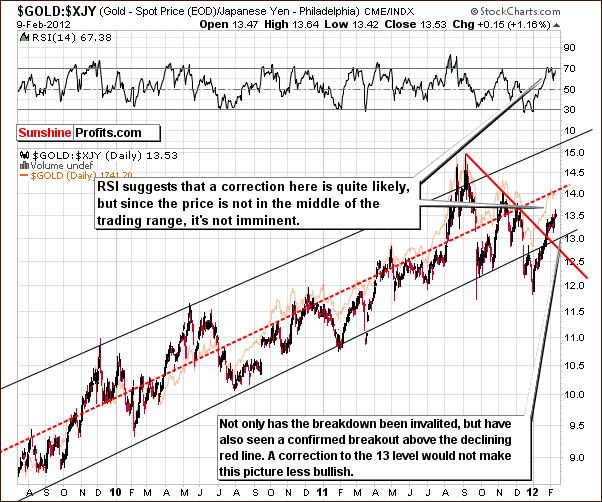
In this week’s long-term chart of gold from the perspective of the Japanese yen, we see that the RSI level is close to 70 and this suggests that the local top may be in or is at least close. In the past, when the RSI held close to the 70 level for some time, local tops have been seen. Such is the case today. Prices are also close to the middle of the trading range but not at it, so a pause appears likely though not yet imminent.
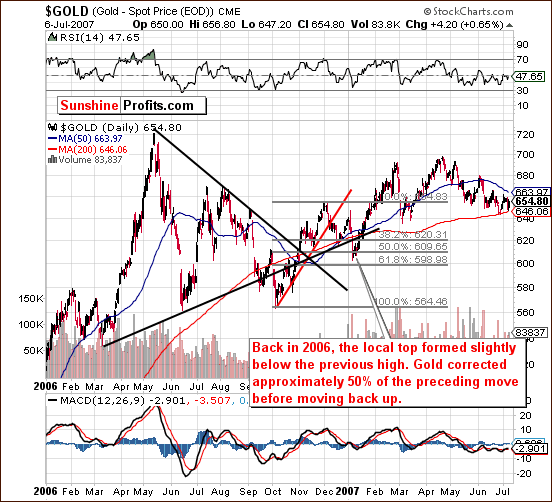
On the above chart, we can take a close look at what actually happened in 2006. For several weeks now, we have been comparing this year’s trading patterns with what was seen back in 2006. It is quite common to see patterns repeat (rhyme) over the years and using these similarities as a roadmap proved profitable many times in the past. Quoting Harry S. Truman: “the only thing new in the world is the history you don't know.”
We are presently most likely in a trading pattern similar to what was seen in November-December, 2006. Gold’s price is close to the rising support line and a local top has just been seen at a level close (slightly below) to that of previous highs. The correction which followed in 2006 brought gold’s price down about 50% of the preceding move to the upside. This is something which could repeat this time as well. Please take a look at the following GLD chart for details.
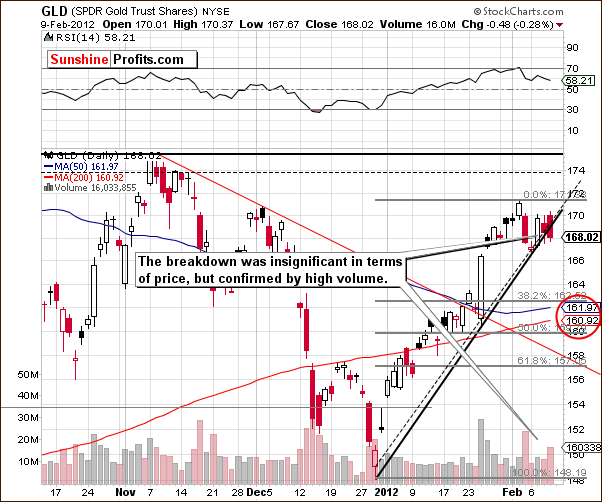
In the current, short-term GLD ETF chart, we see that the local top is likely in as the reversal was seen on significant volume and at a point slightly below the level of gold’s previous high. Volume has also been higher on moves to the downside recently as compared to the volume accompanying rises in price.
Gold’s price level is close to the rising support line today, much as was the case in early December, 2006. A slight breakdown has actually been seen this week though this move is not yet confirmed. Thursday’s high volume on a small price decline is also a slightly bearish factor.
Target levels for the price decline appear to be between the 38.2% and 50% Fibonacci retracement levels. The 50-day and 200-day moving averages are also in this area and further contribute to the validity of the downside target area in the $160 - $162 range for the GLD ETF. This is also close to the level where the sharp part of the recent rally began, once again a situation similar to what was seen in 2006.
Summing up, the outlook for gold remains bullish for the medium and long term but is now rather bearish for the short term. It seems to be a good idea to be on the sidelines with speculative capital and in the market with long term investment holdings at this time.
Silver
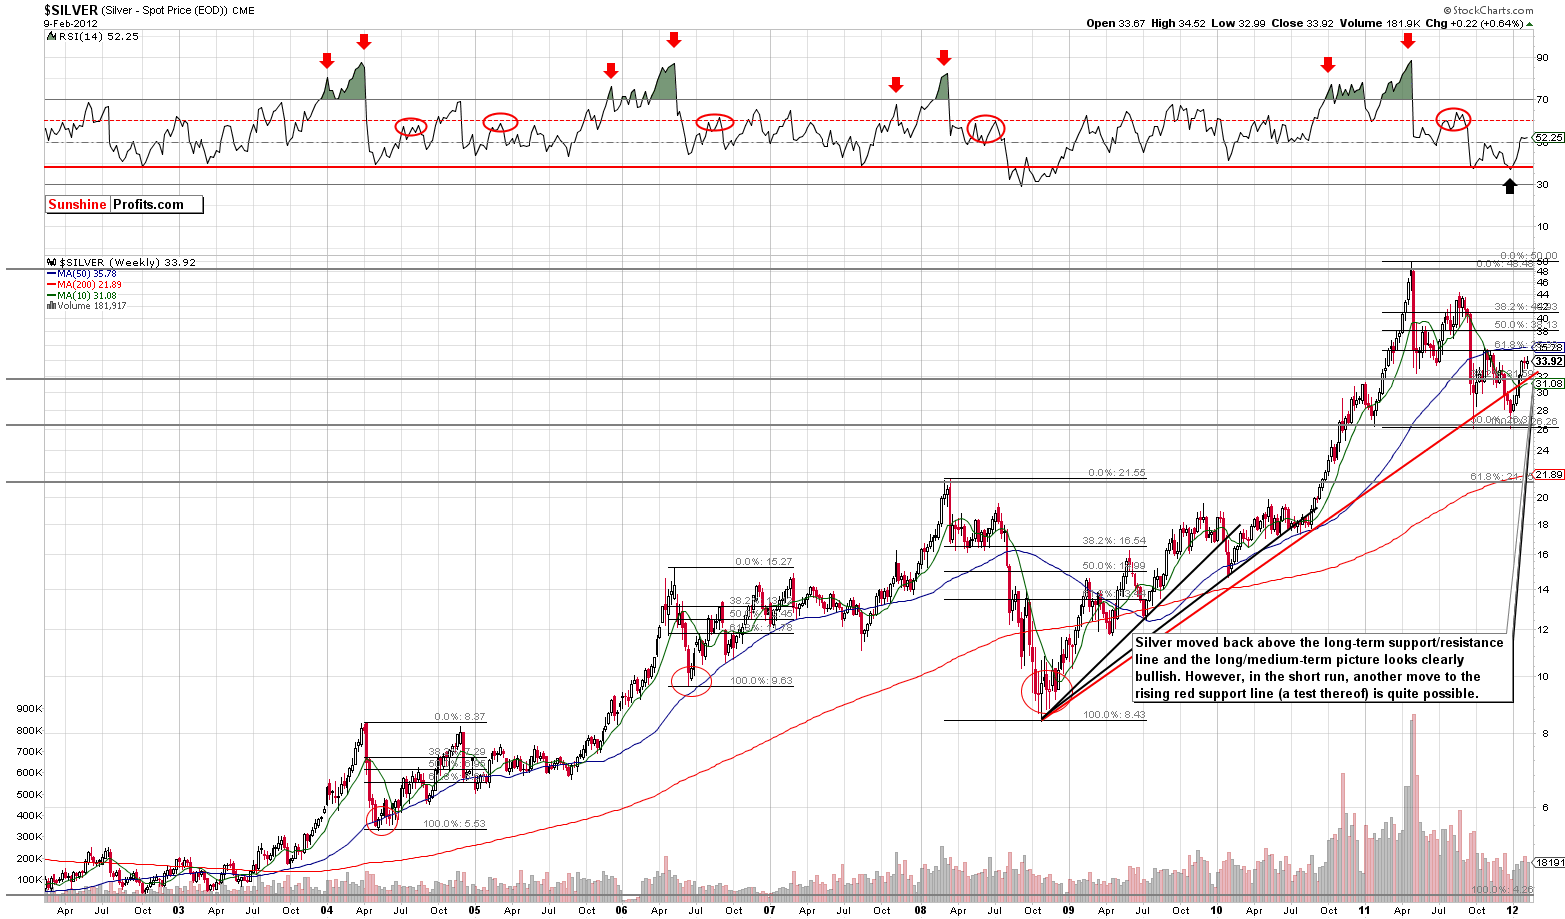
We begin this week’s silver section with a look at the very long-term chart (please click the above chart to enlarge) where we see a rather uneventful week. Silver’s price has been in a sideways trading pattern during the past two weeks after a strong rally in which the support-resistance line was pierced and volume levels were significant. With silver now above this line, it seems that a move back to it, a test of the breakout may in fact be seen. The 38.2% Fibonacci retracement level based on the 2002 to 2011 rally is also in play and will likely assist in stopping a decline as well.
Based on the above chart, the decline could stop between $30 and $32. As this range is not too precise, we will turn to the short-term chart and also keep monitoring the gold market because the situation is clearer there and both metals are likely to bottom at the same time.
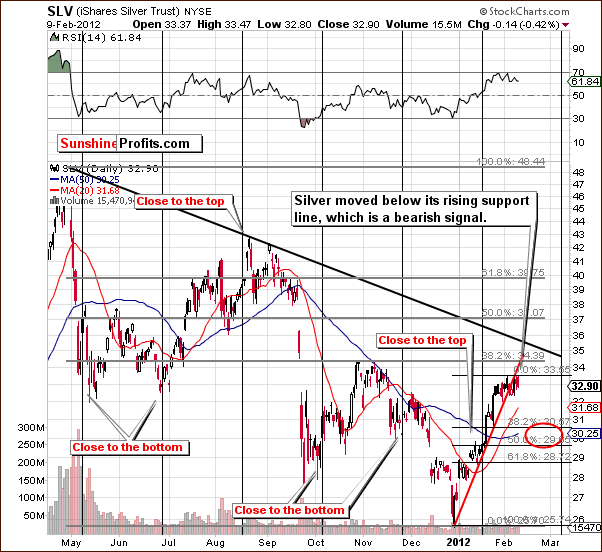
Looking at the short-term SLV ETF chart we see a situation which is quite similar to what we described previously in the gold market this week. Here, the downside target area is close to the 50% Fibonacci retracement level and in the $30 range. Silver could move to $29 but at this point it seems that $30 is the likely downside target level.
Gold has broker down only slightly but we see that silver has moved below its short-term support line based on previous lows. This move has been confirmed and the outlook is now bearish in the short term. No other support lines are seen until the Fibonacci retracement levels which begin at a level about 7% below Thursday’s close.
Summing up, the medium and long-term outlook for silver remains bullish but the short term is now more bearish than not.
Platinum
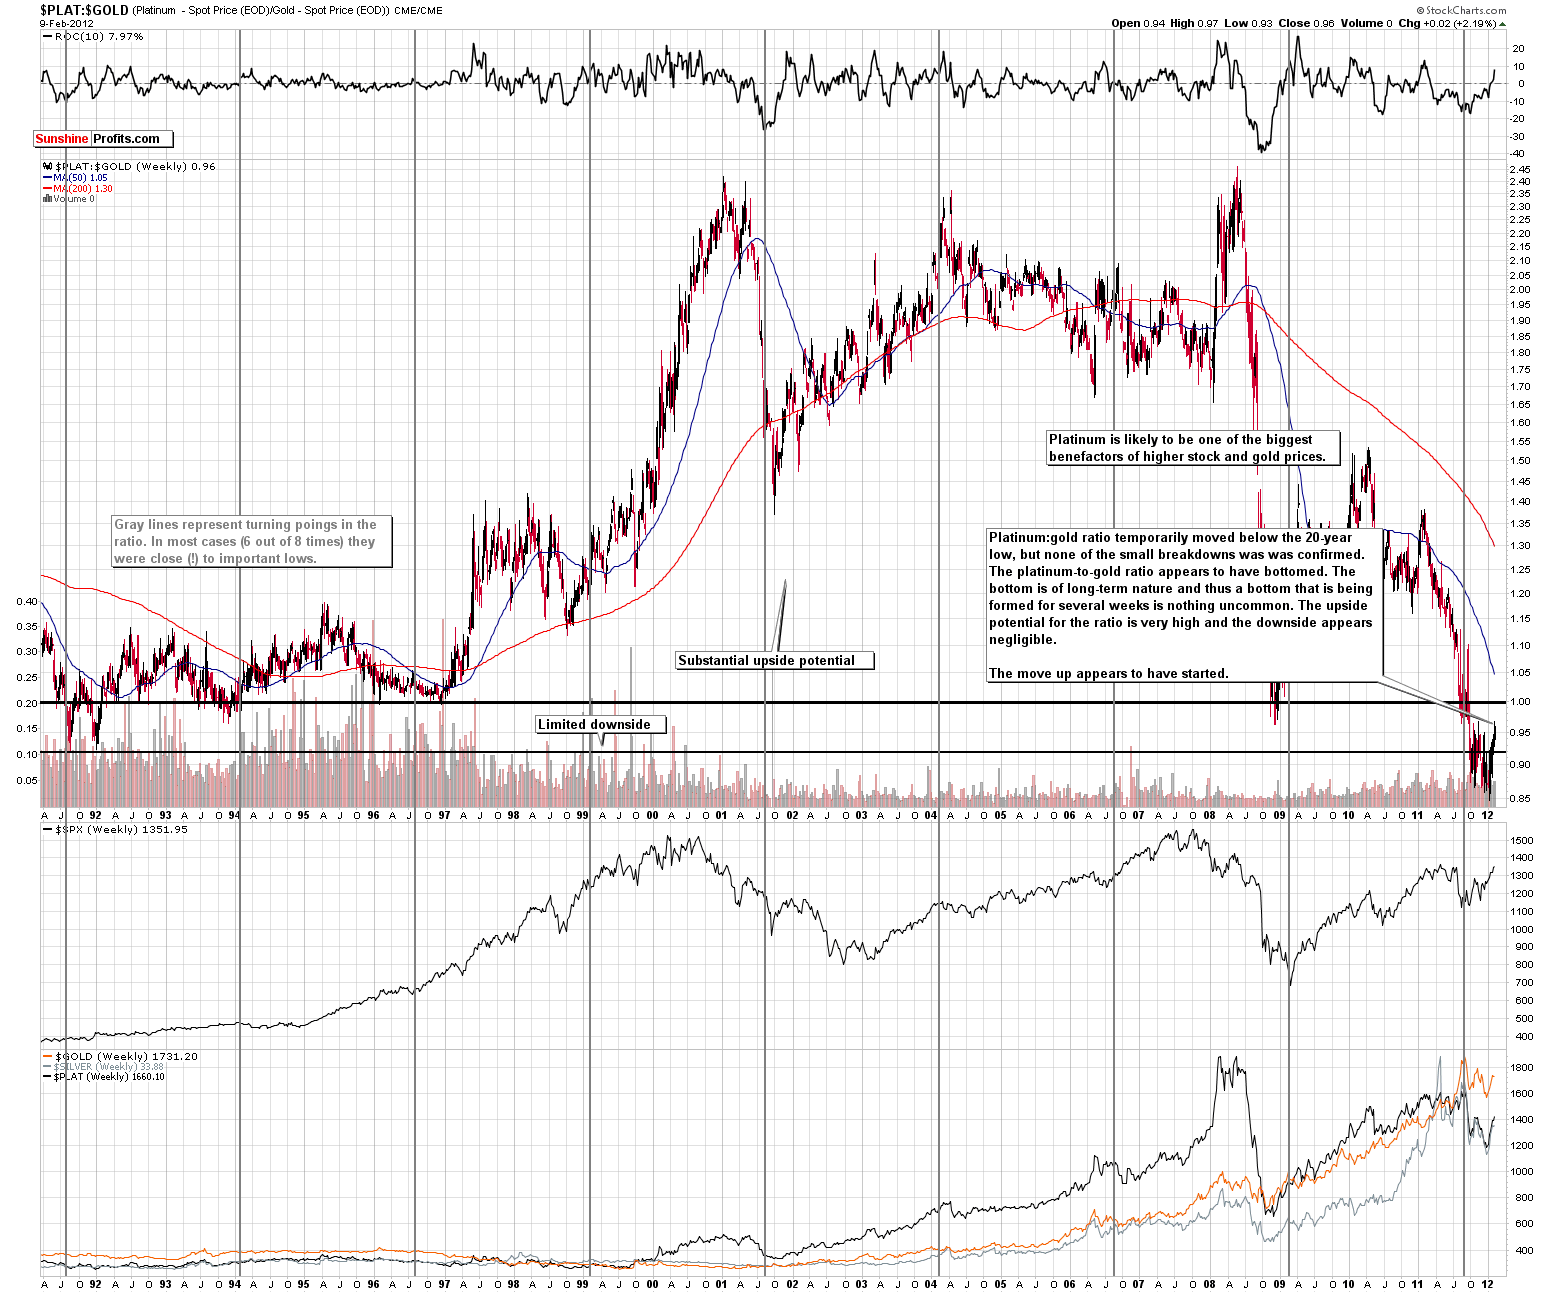
Looking at the Platinum to Gold ratio chart (please click the above chart to enlarge), we see that the situation is beginning to change somewhat. For some time, we have been writing about the upside potential for platinum being quite high. We stressed that the reversal will be of long-term nature and that short-term fluctuations should not concern investors.
While the ratio has seen some volatility in recent weeks, it seems that the recent move to the upside may finally be described as decisive. Platinum’s price seems likely to continue to move higher. The upside potential is still quite significant, while downside risk is limited. This is all quite visible in this week's chart.
Summing up, it still does not seem to be too late to enter the platinum market. Although a short-term correction is certainly possible (as it is the case with other metals), the long-term outlook appears to be quite favorable and platinum is likely to outperform gold in the medium term.
Gold and Silver Mining Stocks
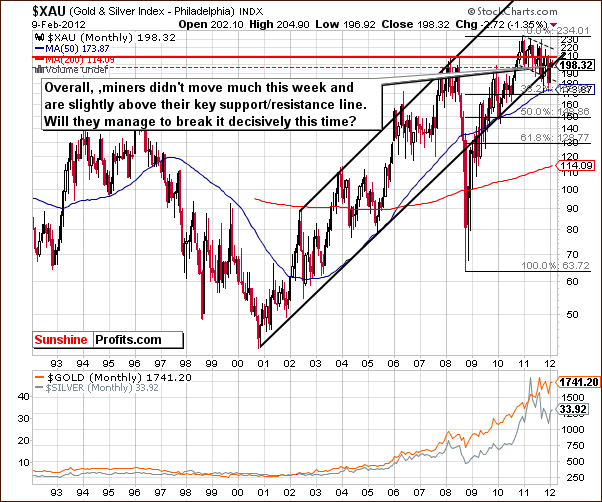
In this week’s very long-term XAU Index chart, we have seen some sideways trading this week and the index level is at the lower border of the rising trend channel. The index declined about 2% this week and is still moving along the lower border of the rising trend channel. The technical situation on the above chart is still somewhat mixed at this time.
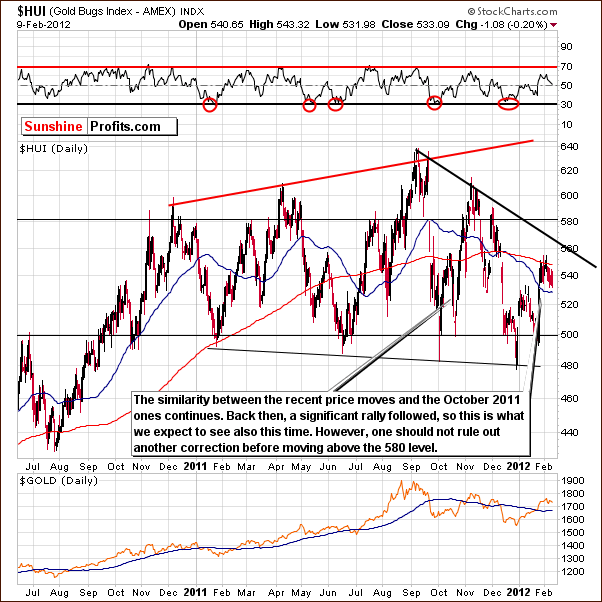
In this week’s long-term HUI Index chart, the situation is still quite similar to the October-November trading pattern at a time when the mining stocks were rallying. There have been some corrections along the way and another is possible before the rally is to continue in this index. This situation could be related to what is happening in the gold market at this time.
The analysis of the short term chart will provide more detailed view.
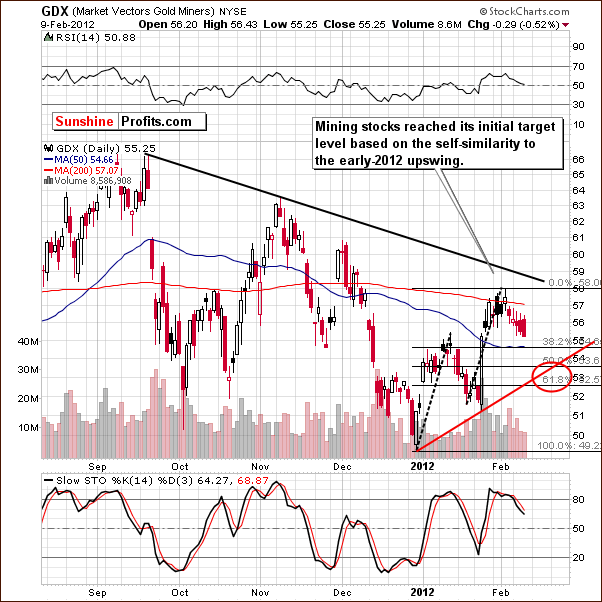
In the short-term GDX chart this week, we see that the index has declined and that downside target levels appear to be in the $52 to $54 range. This is based on the rising red support line in our chart as well as the 50% and 61.8% Fibonacci retracement levels.
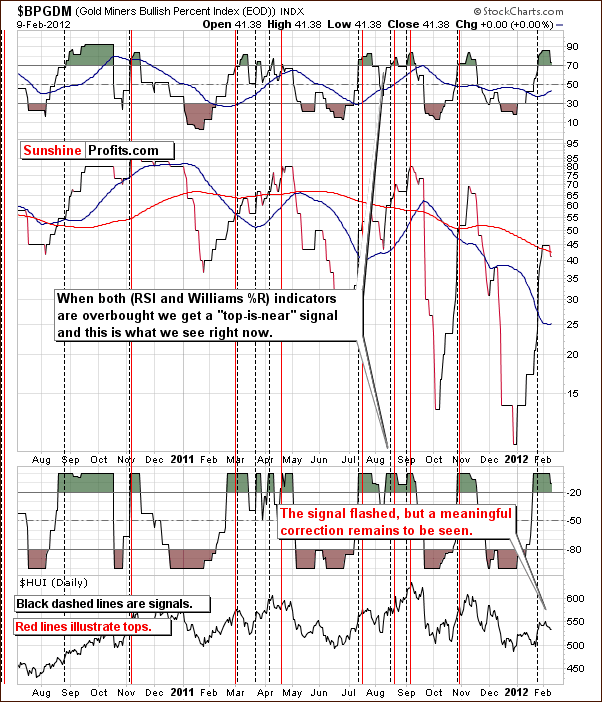
In the Gold Miners Bullish Percent Index chart, we continue to see that both the RSI and the Williams %R are overbought and a “top is near” signal has flashed. We have also had a confirmation that the local top has formed and is visible in the chart. This chart also confirms that no significant correction has yet been seen. The recent declines in mining stocks have not been significant enough to make the indicators here decline from their overbought levels. Such a move to the downside is likely to be seen here in the near future however.
Summing up, the short-term outlook for the gold and silver mining stocks is somewhat bearish now as is the case for the underlying metals. Some small moves to the downside have been seen and others appear to be imminent. The situation is far from certain, however, as the general stock market can also influence the gold and silver mining stocks.
Letters from Subscribers
Q: Here’s what I just read. Please comment. "Low interest rates are not likely to translate into higher stock prices, because this relationship is based on the assumption that people believe stocks will rise."
A: The above is a bit oversimplified in our view. Naturally, investors’ beliefs and actions are what ultimately decide the course of the price of an asset. However, in this case there are good reasons to think that investors do indeed believe stocks will rise. There are several reasons:
1. Stocks generally rise in nominal terms. Yes, there are multi-year bear markets, but from a very long-term perspective (50+ years), one sees that stocks move up on average. So, believing in higher nominal (!) stock prices doesn't hurt that much, taking a very long-term view into account. On the other hand, it’s not exactly that simple given that the financial system based on fiat currencies may not exist in the next decade, but that's what most investors believe.
2. We have Ben Bernanke behind the wheel, who is determined to use Keynesian methods to stimulate the economy, which is highly inflationary in the long run – inflationary not only for the prices of consumer goods, but also for other assets such as stocks.
3. Financial markets are more globalized and access to information is now greater than ever. Consequently, when people see a rally, they can join it in a matter of seconds. Thus a "snowball effect" is quite possible, when the environment is positive and there is a trigger.
4. Lower interest rates (and keeping them low for longer) impact stock valuations through the increased money supply for investors who now have more funds to purchase everything, including stocks. In addition, lower rates help businesses directly by making their loans cheaper and costs lower.
5. It’s the final year of the presidential cycle and Obama will definitely want impact the stock market in order to please investors before the elections.
Point 3 makes the case for a rally given certain circumstances. Is the situation positive for stocks? Not really in real terms, as gold has been outperforming them for years now. But in nominal terms it is (point 2, 4, 5, and especially 3). All that is needed for a rally is the trigger, and given the above, the promise of keeping rates low at least until 2014 appears ready to do the trick.
Summing up, we believe that stocks can and likely will rally in nominal terms, but not in real terms (compared to gold). Naturally, we prefer purchasing silver, platinum and gold to stocks.
Q: You make it sound as though exiting is urgent. I am in my position at $30 according to old advice. I can’t capture much by selling at $33 and trying to get back in at $30. I own metal. I am not a day trader. According to reports I’ve read there is just a month before it heads back up anyway. Although your emphasis on risk taking here seems to imply a bigger dip and longer wait.
A: Based on the description of your approach and the nature of your investments (silver ownership) it seems that you are referring to long-term investments. In the latest Market Alert, we wrote that "there are no changes as far as long-term investments are concerned - we suggest remaining invested with this part of your capital." So your actions are very much in tune with our suggestions.
The coming correction is important for traders (the end of the correction will provide another buying opportunity), but not something that long-term investors should be concerned with.
Q: Surely when the Greece debt deal is announced gold will surge. Is the advice to close long positions premature?
A: It was not necessarily premature based on the Greece debt deal. If everyone knew that gold was going to surge in the future (based on something viewed as certain, like the debt deal in this case), then they would buy gold immediately in order to profit on that move, and as a result gold would move up immediately. So when the deal was announced, there could be no reaction because those who were willing to trade on that would have already done so.
In general, if something will surely happen, then it is likely that it is already "in the price" and that the event itself will not cause any reaction at all. The more people are unconvinced, the bigger impact the event might have.
Q: Very good analysis in your recent article. Please tell me how you develop and use your time cycle analysis. Are the time cycle’s duration, beginning and end based on the previous short term cycles and durations? Have you studied this analysis somewhere else or is it from simply observing the previous cycles and then extrapolating?
This is key, and would really help a short term trader like myself protect the profits he makes in the upswings and also profit from the coming downswings which as you know can be very deep in miners and Silver.
A: Thank you for your kind comments, much appreciated.
For years, we have been studying the precious metals market and other markets in order to find anything that could help us analyze them. Cyclical analysis is one of the more interesting tools. The main reason for that is that it often works amazingly well (just like we've seen what happened in silver - it formed a major bottom right at the long-term cycle, which was known months ahead).
Generally, we observe which cycles really (!) worked in the past, see if there were no significant events that could have impacted it in a meaningful way, and if we find something, we test it (see if it works at least once again) and then we feature it. From time to time we check to see if the cycle changed and if so, we adjust it accordingly. Additionally, we regularly check for new cycles. In our analysis, the long-, medium- and short-term cycles are not dependent on each other and they can intersect.
Generally, most cycles work on an “extreme-extreme basis with a slight drift toward similarity”. This means that not matter if a cycle is based on lows or tops or top-low combinations, the most likely outcome is that we are going to see a top or a bottom at the next cycle (thus we call them turning points). However, if a one type of turning points (say, tops) is seen almost all the time in a given cyclical pattern, then it’s more probable than the coming turning point will be a top as well. For instance, if we had a top-top-top-top-top combination and were projecting what’s going to happen at the next turning point, then we would attribute the probabilities of tops and bottoms in the following way: top (50%), bottom (30%) or no extreme at all (20%). In other words, we would have 80% probability for some kind of extreme and it would be more likely that it would be a top than a bottom, but still, it would be more likely that a bottom would be seen than no extreme at all.
Summary
The USD Index appears likely to rally in the days ahead as a form of consolidation before another downswing. The general stock market seems to be poised to move to the level of its 2011 highs and likely form a local top, correct and then move higher once again. The short-term implications are mixed at best for the precious metals sector especially when considering that gold declined this week while the USD Index did the same. This lack of responding to the slight weakness of the dollar is a bearish indication for the entire precious metals sector.
A correction in the precious metals sector seems possible for the short term. Last week we stated this to be a 45% probability and this week it has increased to about 55% with the remaining 45% chance that the rally continues without a meaningful correction.
Now does not appear to be the time for traders to enter long or short positions – once metals and miners correct we will likely have another favorable buying opportunity. Actually we are looking for a confirmation of a bottom from our own indicators, as the SP Extreme ones have been so reliable in the past years. We will keep you informed via Market Alerts and Premium Updates should the buying opportunity emerge or if anything changes about the precious metals market.
Platinum seems to have finally begun to move decisively to the upside after many months of underperforming gold. This change is beginning to be seen in both its price and in the platinum to gold ratio. Significant upside opportunities appear to be present although the short term could still see some price corrections and volatility.
This completes this week’s Premium Update. Our next Premium Update is scheduled for Friday, February 17, 2012.
Thank you for using the Premium Service. Have a profitable week and a great weekend!
Przemyslaw Radomski

