
This December gold prices swooned by more than 10 per cent in their biggest monthly fall since the collapse of Lehman Brothers. For some insecure gold investors it was like a bad dream. They were happy to wake up to a bright, crisp January whose performance was more than enough to warm the heart of any gold investor. It was the metal's strongest starting month in 32 years giving a resounding answer to those who wondered if the 11-year rally in gold had ended (and they always seem to come out of the woodwork every time gold experiences a correction.)
Gold rose 11 percent in January, taking off like an Olympic hurdle racer easily jumping over the obstacles along the way for the largest gain for the month since 1980. The financial press attributed the rally to the regular list of "round up the usual suspects": a Federal Reserve commitment to keep U.S. rates near zero, dollar weakness, investor and consumer demand and central bank purchases.
On Tuesday, the last trading day of the month, the market produced a technically bullish monthly high close, and on Wednesday, gold prices climbed even higher only to continue its ascend Thursday to reach $1760 per ounce. Some gold investors are even starting to think that gold may post fresh highs this year sooner than later.
There is no question that the Fed announcement that interest rates would be held at current levels through to the end of 2014 helped fuel the rally. The market took into consideration that gold investment in this environment would pose no missed opportunity cost since the dollar will earn nothing, so risk assets should outperform dollar deposits.
But the almighty US dollar (not so mighty anymore) is not the only answer to explain the strength of the rally. To find the answer we look east.
Gold sales in the retail sector in China are more than 50% higher this year than last and, and as we wrote last week, most of these purchases are of a quasi-permanent nature since they are going to be held for the long term. The Chinese don’t see gold in dollar terms, but rather they see it Yuan prices.
China’s hunger for gold is like a gangly, giddy growing teenager who eats all the time and whose mother can’t figure out where all that food is going. China, already the world’s number one gold producer, saw its output rise again this year. The country produced a record 360.96 tons of the yellow metal in 2011, a 5.9% increase, making it the world's top gold producer for a fifth consecutive year, according to the China Gold Association. The export of gold out of the country is not permitted. So, where is all that gold going? The most likely answer is that it is surreptitiously beefing up China’s gold reserves. China reports its gold reserve holdings sporadically. The last time was in 2008 and the government reported 1054 tons of gold, the 5th largest reserves in the world. That figure was double the amount reported five years earlier of 600 tons. China is keeping the latest figures under wraps so as not to push the price up. If China is producing all that gold on its own territory how much is it importing from other sources?
The answer is that in addition to the gold it is producing domestically (and we have already established that it is the number one producer in the world) China has also been importing record amounts of gold through Hong Kong, with some estimates suggesting that China's total gold imports for 2011 are about 490 tons - double the 2010 figure, but it is difficult to know for sure. The Hong Kong Census and Statistics Department reported that China imported 102 tons of gold from Hong Kong in November, an increase from October’s 86 tons.
A few tons here, a few tons there and pretty soon you’re talking about a massive amount of gold.
Forbes Magazine recently quoted a People's Bank of China official who said last month: "No asset is safe now. The only choice to hedge risks is to hold hard currency - gold." The official also stated the obvious, that it is wise to buy on market dips.
On paper the Chinese economy looks great. Not only will it be bigger than America’s in the next decade, by 2040 China’s GDP will reach $123 trillion, estimates Nobel economist Robert Fogel in Foreign Policy. So if things are so great, why are the Chinese people, who have the world’s highest savings rate, buying such large quantities of gold, an asset that is considered a safe haven for difficult times? What is rattling their nerves?
Well, one answer is that they don’t have many investment options and perhaps they are seeing that the prices of bok choy and rice are going up at the local market. They also observe that the stock market has fallen and that the housing market is looking like a bubble about to pop.
So they are buying physical gold through banks that allow purchases of as little as a gram of gold a month. The Chinese traditionally buy gold presents in the months preceding the Lunar New Year, which began more than a week ago. But the gift giving does not explain the surge in gold purchases. November was the fifth-consecutive month of China’s record gold purchases from Hong Kong.
For the Chinese taking their money out of the country –capital flight— is an almost impossible endeavor. So buying gold is the next best thing and that is a troubling sign for the Chinese economy. Perhaps all that gold buying by their citizens is making the government nervous. Marketwatch reported last month that China's central bank has ordered all gold exchanges, other than the official exchange in Shanghai, to cease operations. Unauthorized gold exchanges and related trading platforms have sprung up around the country as bullion prices soared.
By all accounts, despite the cold temperatures, we liked January a lot. To see if February will be as promising let’s turn to this week's technical part with the analysis of the USD Index. We will start with the very long-term chart (charts courtesy by http://stockcharts.com.)
USD and Euro Indices
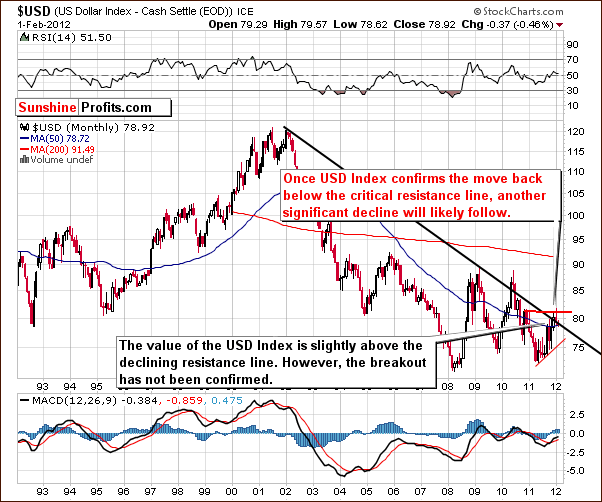
Our first chart this week is the very long-term USD Index chart, where we saw some declines this week. The index has not moved so low as to invalidate the previous move above the long-term resistance line. The breakout is now being invalidated but this has not yet completed. It is likely that the next move for the USD Index will determine the direction for the next week or more. The odds are that this direction will be down.
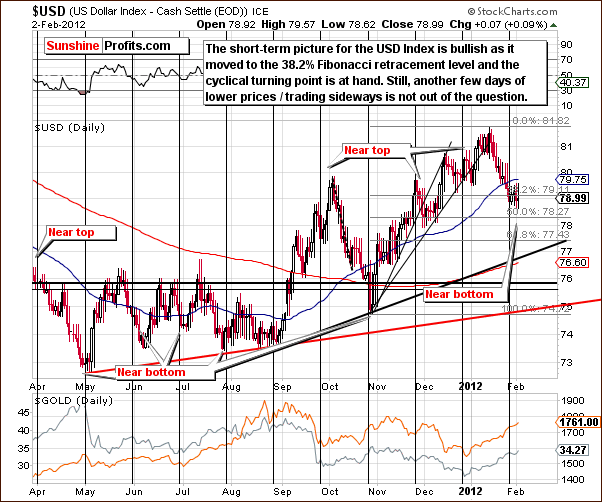
In the short-term USD Index chart, we see that a cyclical turning point is now in play. A support line has been reached and a consolidation or small rally could be in the cards. The likely downside target levels (likely to be reached after the consolidation is complete) would be 77 and 75, after which the next move is unclear at this time. Overall, the situation for the USD Index is now bearish except for the very short-term – 2 weeks or so.

In the short-term Euro Index chart, we see a confirmation of the bearish outlook previously described for the USD Index. The euro has consolidated after a breakout and seems to have gathered strength for another period of rally. We could see a small additional consolidation followed by a move to the upside.
Summing up, the situation for the USD Index appears bearish for the medium term and slightly bullish for the short term. The Euro Index has shown some signs of strength and appears poised to rally in a couple of weeks or so.
General Stock Market
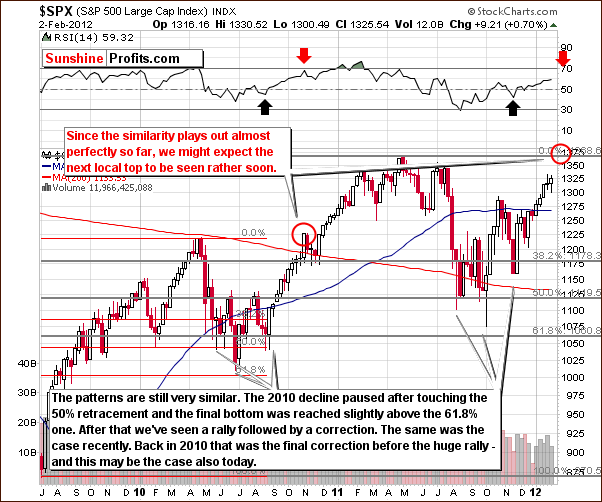
In the medium-term S&P 500 Index chart, no significant changes were seen this week. The technical analysis which we discussed last week has played out rather well. In last week's Premium Update, we stated that the next local top will probably be close to the level of the 2011 high. The recent trading pattern has been consistent with the period leading up to the local top in 2010-11. In October-November 2010, declining prices were seen for a few weeks but were quickly followed by a continuation of the rally. We may have a similar situation here.
RSI levels should be looked at as well and are also indicating that a rally is likely ahead. It appears that it could last for two to four weeks as the RSI level will then likely be close to 70. This has coincided with local tops in the past.
This continues to be a very good description of what’s likely to happen next (and what has been seen this week).
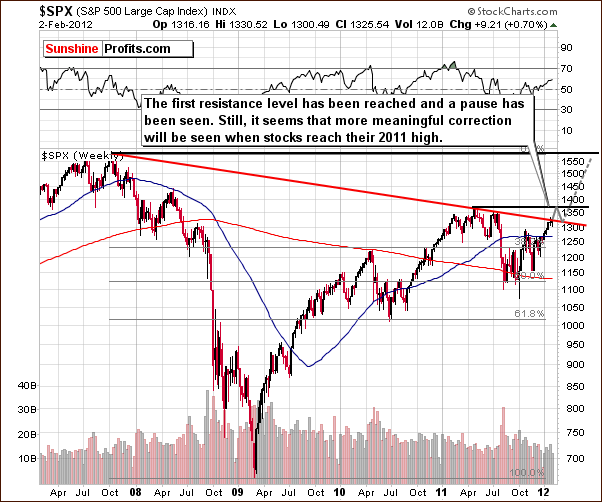
In the long-term S&P 500 chart, last week's comments are still quite valid and will be restated here.
We once again see that an upside move up to the level of previous highs could be in the cards if the recent pattern holds. If the index reaches this 1,375 level and then consolidates, pauses or declines slightly (likely outcome in our view, as indicated on the above chart), this will confirm the breakout above the red declining resistance line. Another move to the upside would then seem likely.
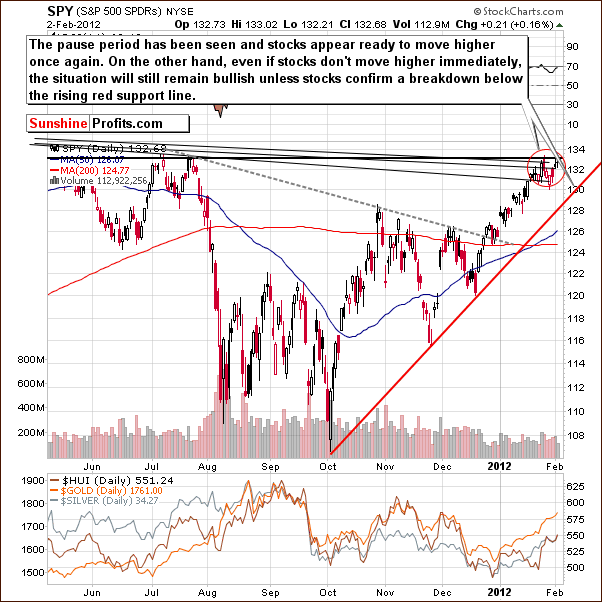
In the short-term S&P 500 chart, the consolidation which we mentioned as a possibility last week has indeed played out. Even if stocks consolidate further without a rally, the situation will remain bullish as long as prices remain above the rising red support line. Only after this support is broken and the move confirmed will the situation become bearish. This appears to be an unlikely outcome, at least for the near term, as strength is still seen in the general stock market. This has likely been fueled by the Fed's recent statements regarding interest rates.
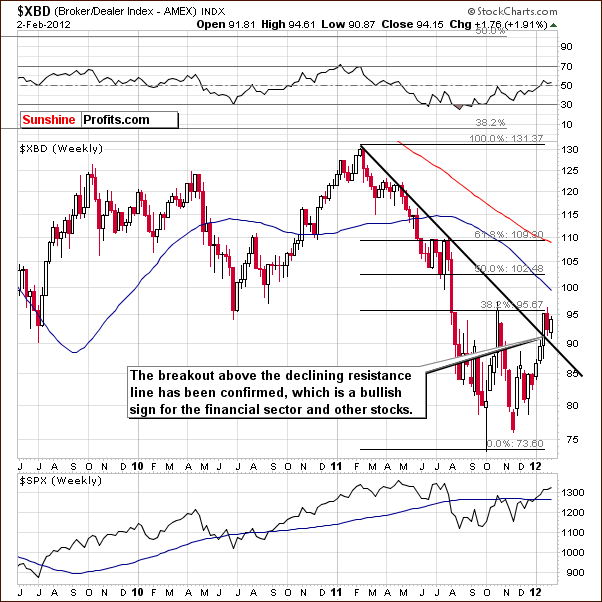
In the Broker Dealer Index (proxy for the financial sector) chart this week, we see a pullback, and this move above the declining resistance line has been verified. This line has now become support since the financials recently bounced up above it.
Summing up, the situation for stocks appears bullish for the medium term and at this time; the short-term outlook is also bullish. However, please note that a correction will likely be seen once the 2011 high is reached.
Correlation Matrix
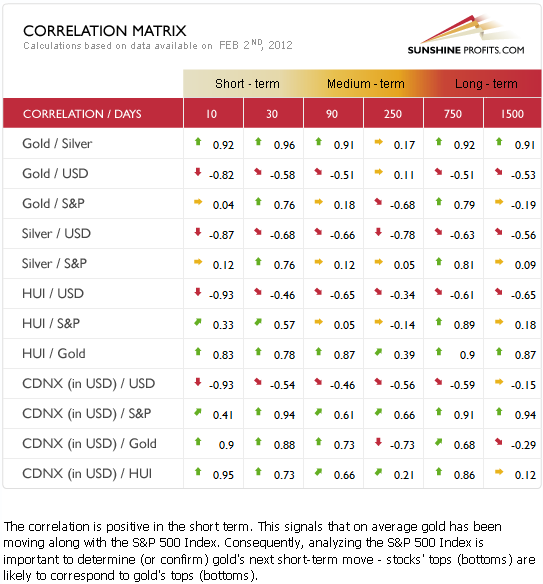
The Correlation Matrix is a tool which we have developed to analyze the impact of the currency markets and the general stock market upon the precious metals sector. An important development this week is that the 30-day short-term column is back to “normal”. The correlations between gold and the general stock market are now positive and this has likely been fueled by recent interest rate statements by the Fed. Correlations between the precious metals and the USD Index are significantly negative but the slightly bigger link here is between the precious metals and the general stock market.
Summing up, the situation is a bit unclear for the precious metals. With a bit unclear short-term price projections for the USD Index and the general stock market, it is best to rely on analyses of the gold and silver markets themselves to estimate detailed price moves.
Gold
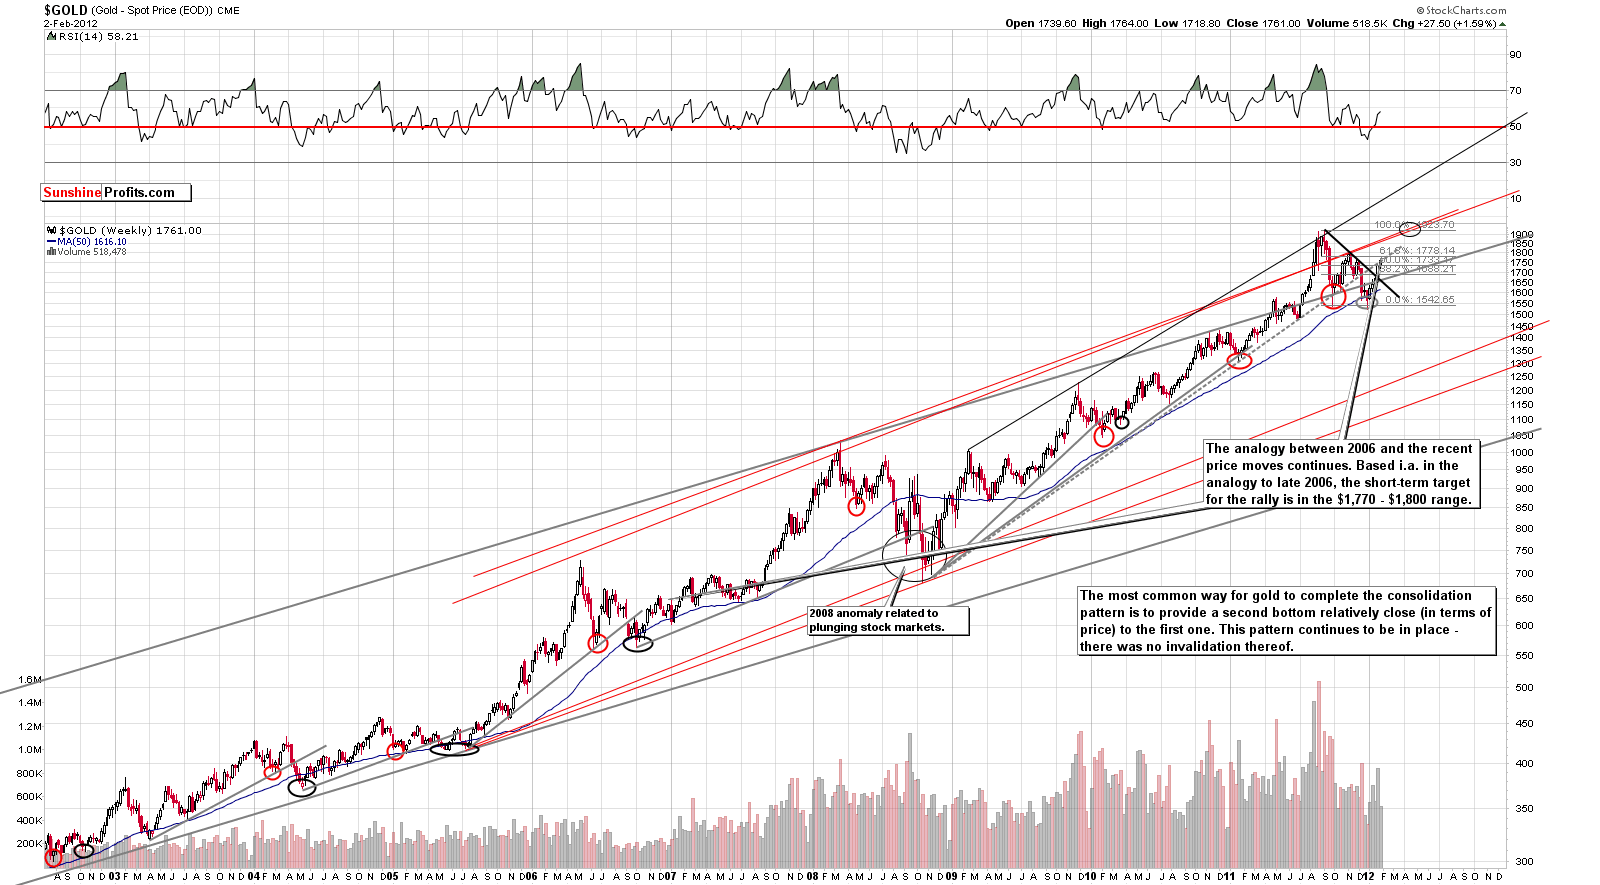
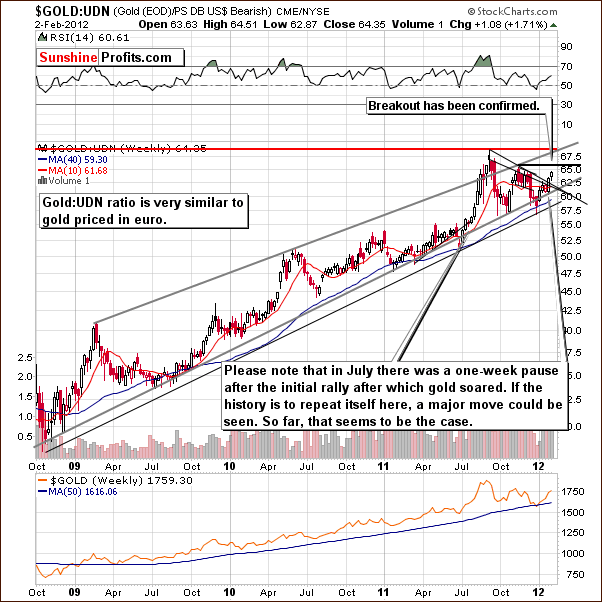
We begin our gold section with a look at the very long-term chart (please click the above chart to enlarge). This week we clearly see a confirmed breakout above the declining resistance line. Gold's price is now between the 50% and 61.8% Fibonacci retracement levels created from the 2011 top and the decline seen later in the year.
It seems likely that prices will move a bit higher from here but probably not to any great extent. The similarities to the trading patterns of 2006 are remarkable. This time, gold is close to its previous local top, a level that was reached back then before the correction materialized. More will be discussed on this topic later.
In this week’s long-term chart of gold from a non-USD perspective, we still see the index is below key resistance levels. It appears that an additional rally for about a week or so could be seen before the local top is reached here. These are the only short-term implications seen this week. The consolidation period appears to be over from the long and medium-term perspectives, and we expect this rally to continue once the consolidation is over.
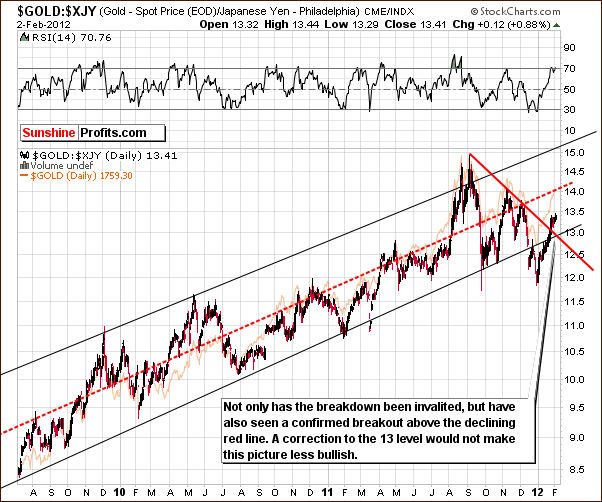
In this week’s long-term chart of gold from the perspective of the Japanese yen, the recent move above the declining resistance line created by recent local tops is now a confirmed breakout. This suggests that the current rally is well founded. Confirmation of this point has been seen from the perspective of the US dollar, the non-USD currency index, and now from the Japanese yen perspective as well.
Once gold corrects, we could see the ratio move close to the 13 level where 2 support lines coincide. If this level holds (and this is what we view as the likely outcome), the breakout will be confirmed once again and the situation will actually be even more bullish than it is today.
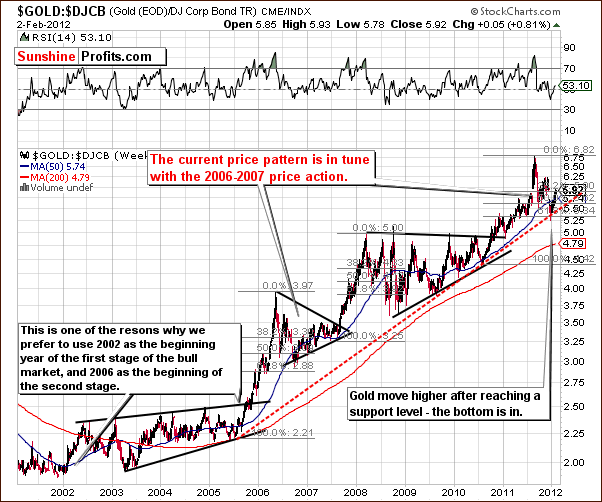
In this week’s gold to bonds ratio chart, we see some very interesting developments. A strong self-similar pattern is quite evident in comparison to 2006-2007. The size of the decline and the subsequent bounce seen here are very much in tune with what happened five years ago. Back then, the rally initially stopped slightly above the highest Fibonacci retracement level.
Gold-to-bonds ratio is in this area now, so it seems that investors should prepare for a local top. The gold price charts however still suggest some upside potential for the week ahead. From a long-term perspective, a powerful rally is likely to emerge once again.
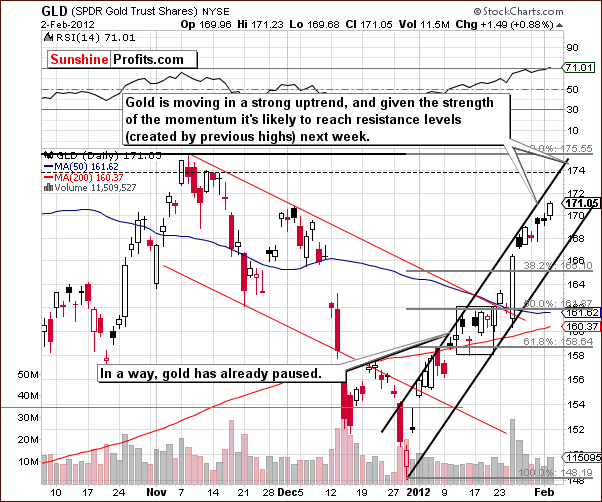
In this week’s short-term GLD ETF chart, we see the recent strong uptrend as represented by the rising black lines. The current strong momentum suggests that gold will reach the level of its previous highs sometime next week. The horizontal dotted line in this week's chart has provided resistance a few times in the past and could do so once again. There is a good chance that the current rally will stop once this level is reached. Naturally, gold could move to the November 2011 high, but it seems that it will be a safer and better move to exit the short-term long position a few dollars lower (dashed line), just in case gold tops a bit below the previous top.
So, it appears that an additional rally in the $20 to $30 range is quite probable. The obvious question now is how low will gold go once it tops? The 38.2% Fibonacci retracement level and the upper border of the December price gap seem to be the most likely downside target levels once the local top is reached. This would correspond to the $166 level for the GLD ETF. The estimated timeframe appears to be 2-3 weeks after which a strong move to the upside is expected.
Summing up, overall the situation remains bullish for gold. It seems that a local (!) top will be seen fairly soon and investors/traders should not think that gold's bull market is over but rather be prepared to realize some trading profits and possibly close long positions in the near future. We will continue to monitor this situation and keep you informed. The important point now is that the upside appears much more limited than it was a week ago.
Silver
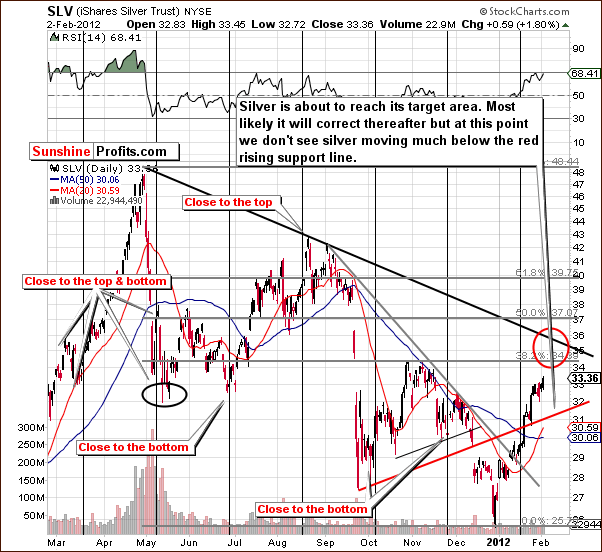
We begin this week’s silver section with the SLV ETF short-term chart because silver's short-term momentum is likely the most interesting this week to traders and investors. The price of the white metal is moving close to its upside target level indicated by the red ellipse in our chart. It seems that an additional move of $1 or possibly $2 could be seen but much depends on what happens with gold's price. Once the yellow metal tops, silver will likely reach its local top as well, probably within the target area of $35 to $36 for spot silver.
Once the local top is reached, a correction is likely to be seen. As far as how low and how long the decline will be, it seems like a move to about the $32 level for the SLV ETF (approximately $33 for spot silver) over a 2-3 week period. This downside target level corresponds to the rising red support line and the May 2011 low (SLV ETF) - silver's decline is likely to stop here.
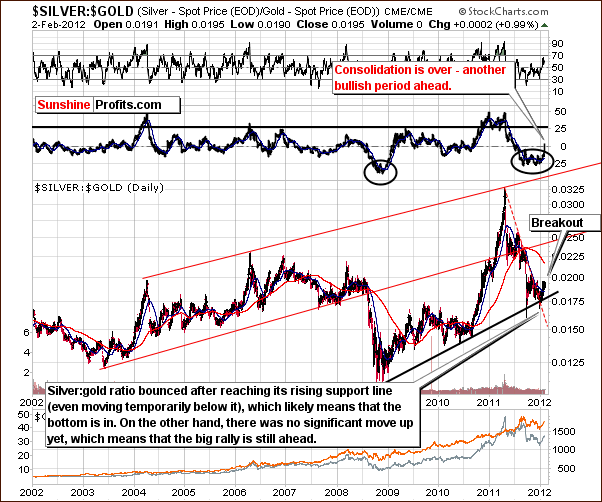
Looking at the silver to gold ratio chart, most interesting is the rate-of-change ROC Indicator. This has moved sharply higher, which confirms that the consolidation period is over with the recent breakout. Higher values are likely here for the medium and long term.
Summing up, silver is likely to move higher in the medium and long term. A local top appears close with silver's upside potential likely around $1 above Thursday's close. The downside target for the next decline in the SLV ETF is $32 and the timeframe for the decline will likely be about 2-3 weeks from the day the top is seen.
Gold and Silver Mining Stocks
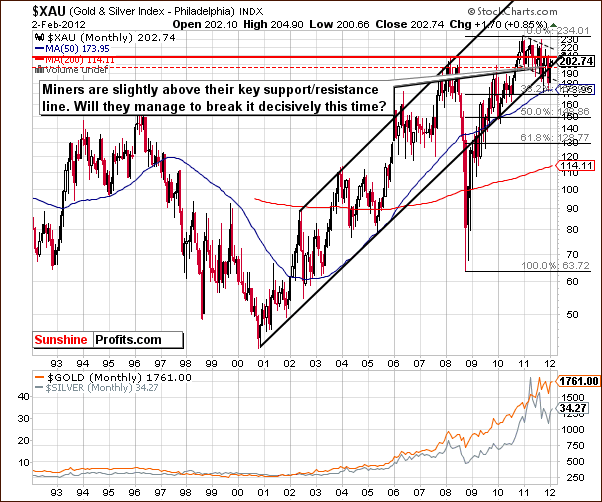
In this week’s very long-term XAU Index chart, we have virtually no change since last week. The index level moved about 1% higher this week and the mining stocks are slightly above the monthly support line. The picture is pretty much mixed with a bullish bias.
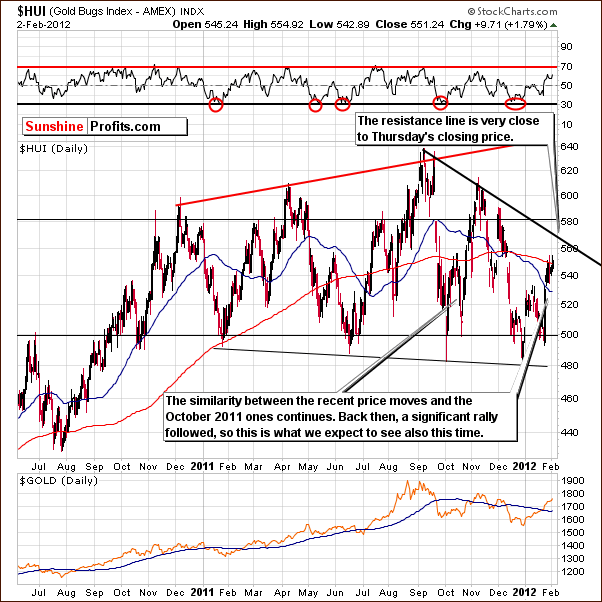
In this week’s long-term HUI Index chart, we see that the index has rallied sharply and is now approaching a resistance line. So far this year, its performance has been quite similar to what we saw last October, when a pause was not seen until the 580 level was reached. Back then, however, there were no resistance lines in play prior to reaching that level. This is not the case today as there is a declining resistance line created by previous local tops. It therefore seems likely that the current rally will top around the 570 level.
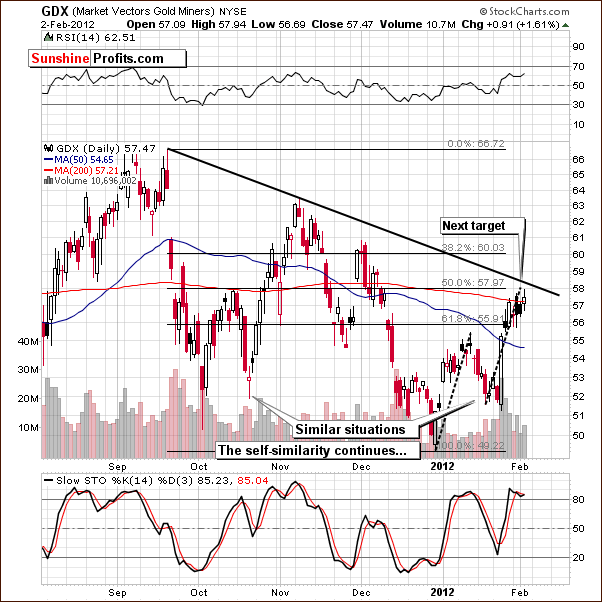
In the short-term GDX chart this week, we see that miners are close to reaching our defined target level for this rally. In last week's Premium Update, we stated that the miners appear to be heading to the $58 level where the declining resistance line and the 50% Fibonacci level coincide. Once this short-term resistance line is reached, a pause in the rally is probable after which an additional period of rally seems likely." The shape of this rally is almost an exact self-similar pattern compared to last October. The maximum price that we see GDX achieving without correcting first is $60 (the upper Fibonacci retracement level).
It seems that the next decline could bring the GDX ETF down to $53 or so, which corresponds to the previous local top and local bottom and is slightly above prior lows. The decline will actually be quite significant when compared to the size of the previous rally, but miners are known for big short-term swings in both rallies and declines. This could be the case here, especially if gold and silver correct as well.
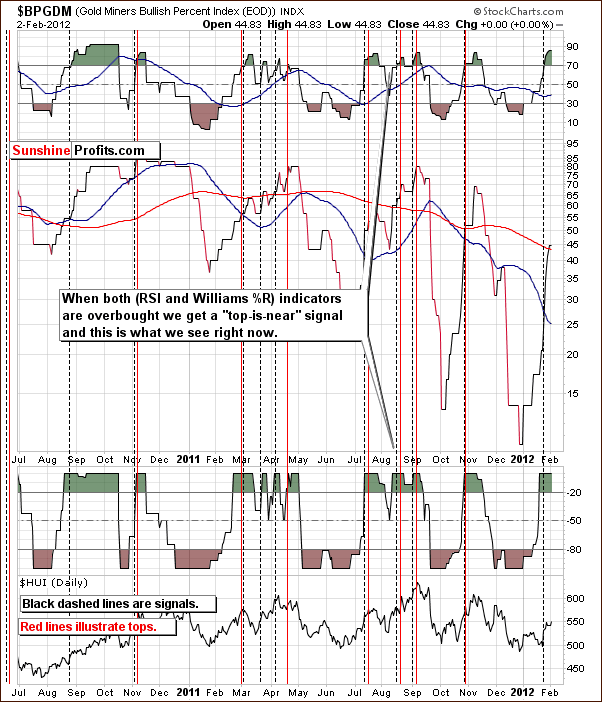
In the Gold Miners Bullish Percent Index chart, we continue to see that both the RSI and the Williams %R are overbought and a “top is near” signal is in place. The local top now appears to be just around the corner as we have already discussed in previous sections of this update. The above chart provides is with a confirmation.
Summing up, the outlook for the gold and silver mining stocks is similar to what we have seen for the underlying metals. A small additional rally is likely from here with a consolidation and period of decline lasting for probably two and possibly four weeks. The downside target level for the decline is $53 for the GDX ETF.
Junior Mining Stocks
As stated in the Key Principles section, the list of top juniors will be updated approximately every 4 weeks, so this is the Update that should contain the revised version of the list. However, before moving on to the rankings, let’s take a look at the whole sector.
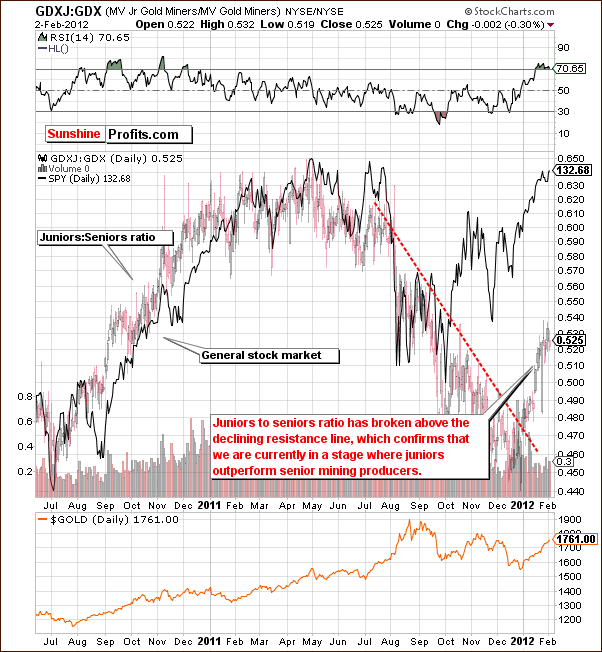
In the GDXJ:GDX ratio chart, we see how juniors are performing compared to seniors. The ratio here has broken out above the medium-term declining resistance line and rallied sharply. Juniors are now outperforming seniors and this is consistent with the outlook which we have discussed in our reviews of the sector over the past few months. It is a situation which will likely continue for the month ahead as well.
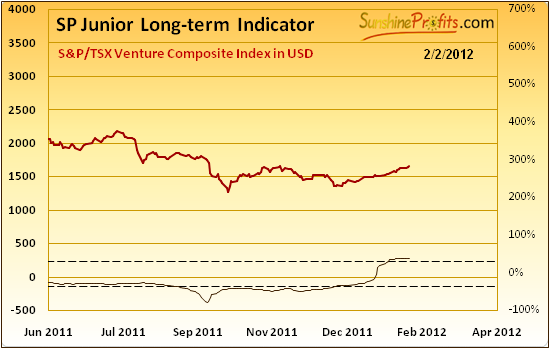
Meanwhile, our SP Long-term Junior Indicator actually flashed an insignificant signal suggesting moving to senior miners, however at this time we don’t view the signal as being a true one.
As a reminder, the above indicator flashes a buy signal when it moves below the lower dashed line and starts to rise and it flashes a sell signal when the indicator is above the upper dashed line and starts to decline. In this case, the indicator moved only very insignificantly (it’s not even visible on the chart above) lower and we don’t think this should be viewed as a sell signal for juniors.
The Fed’s recent statement, the situation in the long-term interest rates, stock market (note that juniors are highly positively correlated with main stock indices stocks) and the rest of the precious metals market are positive as well.
Since it’s a good time to be in the junior sector, let’s move to our top junior rankings (reminder: we usually post them every first Friday of the month).
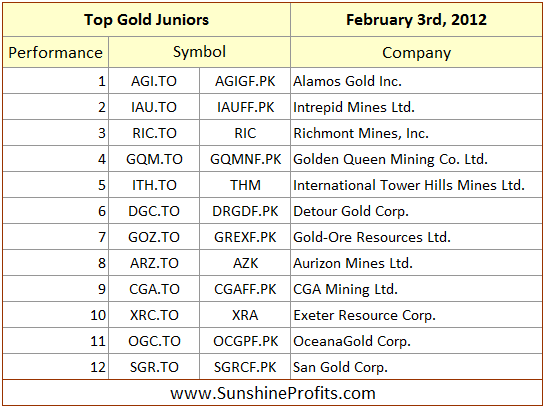

The noteworthy change this month is the removal of the Minera Andes Inc. (MAI.TO) from our silver ranking. We removed Minera Andes Inc. from our ranking, as the company has been acquired by US Gold and the new company created in this way will operate under McEwen Mining Inc. We originally featured this company in our March 25th, 2009 Premium Update (our very first Premium Update) and the price was 0.78 at that time. In the last day (Jan 26th, 2012) of trading as Minera Andes Inc., company’s share was worth 2.58. At these dates the value of the HUI Index was 334.20 and 535.78 respectively. In other words, during the same time MAI.TO gained about 231% and HUI gained 60%.
Letters from Subscribers
Q: I read the following article which mentioned the likelihood of silver reaching an all-time high this year. How likely is this?
A: At this point we would give a 60% probability to silver moving to new highs this year. In other words, it's likely but far from being a sure bet. Naturally we will have a clearer view of the situation as time passes and you will be kept up-to-date.
Q: I am interested in investing in silver, and I would like to know more about the ETF AGQ. Would you recommend this investment, or some other ETF with leverage instead? With these ETFs, how much of a relationship is there with the physical metal?
A: AGQ ETF - the ProShares Ultra Silver ETF "seeks daily investment results that correspond to twice the performance of silver bullion, as measured by the U.S. Dollar fixing price for delivery in London."
In short, we believe that AGQ ETF is not a good proxy for long-term investment in silver. It is not even close to being backed by physical silver - it's simply a basket of futures contracts that provide 2x leverage for the price of silver. So, it's not a real metal - it's a derivative based on another derivative (futures contract). In the event of serious financial turmoil, AGQ will likely not provide protection - and physical silver would. So, in terms of attractiveness for long-term investors, it's not recommended.
As far as trading is concerned (something that one will do with only part of their capital), AGQ is attractive for risk-seeking investors. The tracking error of the ETF (referring to how closely it follows silver) is about 3.5%. This is one of highest in the precious metals ETF group, which is not too encouraging as it makes it more difficult to make precise price projections for the ETF based on the price of silver. Still, the leverage appears to make up for it, given that you are a risk-seeking trader. It appears that only risk-seeking traders interested in the precious metals sector should consider using AGQ as a proxy for silver.
Summary
The USD Index is likely to consolidate or bounce in the following week, but the overall trend is down, so after a short period of rallying, the dollar is likely to move lower once again. The opposite can be said about the general stock market and the precious metals sector.
Overall, the PM sector has seen a strong rally for over a month now and it appears that local tops are just around the corner. The upside target for gold are $20 to $30 above Thursday's close which would bring the yellow metal to $1,780 to $1,790. Silver is likely to move about $1 higher and the miners to just above their present levels (570 HUI and $60 GDX ETF appear to be the maximum targets for this particular rally). A period of correction is likely to begin soon and could last as long as 2-3 weeks.
Downside target levels are $166 for the GLD ETF (close to $1,700 for spot gold), $32 for SLV ETF (close to $33 for spot silver) and $53 for GDX ETF. These expected bottoms will be followed by what could be a powerful rally throughout the precious metals sector. Finally, juniors are likely to outperform seniors in the months ahead.
At this point we continue to believe that keeping speculative long positions and being invested in the precious metals sector with one's long-term capital is a good idea. You will be kept up-to-date should this change.
This completes this week’s Premium Update. Our next Premium Update is scheduled for Friday, February 10, 2012.
Thank you for using the Premium Service. Have a profitable week and a great weekend!
Przemyslaw Radomski

