
There are certain dogmas held sacrosanct by precious metals investors and one of them is that platinum is supposed to be more expensive than gold. That’s just the way it is. Quite a few eyebrows lifted and jaws dropped last fall when the yellow metals price overtook that of platinum. The historic switch took place on Sept. 2nd when Comex gold futures settled at $1,875.25 per troy ounce, just above platinum’s closing price of $1,873 per ounce. When you consider the price history of the two precious metals—platinum has traded at a $200 to $400 premium to gold—the reversal was astounding. Just to give you a better idea, before the 2008 Lehman Brothers crash, platinum was trading at more than $2,270 per ounce while gold was trading under $990 an ounce.
Platinum is much more rare in nature than gold. More than ten times more gold is mined each year than platinum. Unlike gold, which is either held in bank vaults or used in jewelry, more than 50% of the yearly production of platinum is consumed (used up) by industrial uses, mostly in the automobile industry. Some 40% is used for jewelry manufacturing and 10% for investment purposes. The Japanese seem to be very fond of platinum as they account for 95% of the platinum jewelry demand. There are reports in the press of a nascent interest in platinum jewelry in India, expected to make up 25%-30% of the total Indian jewelry sales in 2012.
The annual supply of platinum is only about 130 tons, equivalent to only 6% (by weight) of the total annual gold mine production. It is less than one percent of silver's yearly output. Unlike gold, there are no large inventories of above-ground platinum. Therefore, any breakdown in the two major supply sources, South Africa and Russia, would catapult the price of platinum. An even more intriguing fact is that more than 90% of the world's platinum production comes from only four mines: three in South Africa and one in Siberia.
During economic expansion, platinum prices tend to outpace gold given its dual role as both a precious and industrial metal. But when the economy slows down, platinum can often stumble. For example, platinum dropped below the price of gold back in the early 1980s, pushing the spread below 1.0 for the better part of 5 years as the economy slowly recovered. During the 2008 financial collapse, platinum prices fell from $2,252 to $774, a drop of nearly 65%. Both metals crashed. Gold nosedived due to hedge funds liquidations and investors dumped platinum bracing for a recession expected to flatten automobile sales. The metals reached parity in December 2008 as the price of platinum sunk amid the global financial crisis and a collapse in auto demand. Gold has since has put on a show stopping comeback reaching a high of $1,900 last summer, but platinum has yet to bounce back. As this goes to print, the price of gold is $1,655 and the price of platinum is $1,515.
In recent weeks platinum has seen a healthy rise in percentage terms, with spot platinum up 2.4 percent to $1,458.74 an ounce. The gold/platinum ratio -- a measure of the number of platinum ounces needed to buy an ounce of gold, which has typically held below 1 -- retreated to 1.12 after hitting its highest in at least 25 years on Monday of last week at 1.16. Investors closely watch ratios between the precious metals, often examining shifts before deciding which metal represents the better investment. Some traders also play the fluctuating price differentials between the pair. Spread trading involves two separate trades. By taking a long position in one security and a short position in another, spread traders are anticipating the price of two historically connected assets will revert back to historical norms.
Platinum and gold, both used widely by the jewelry industry, are the two most expensive traded precious metals, and are significantly more expensive than sister metals palladium and silver.
In contrast to platinum, which depends greatly upon industrial demand to determine its price, gold is considered the ultimate hedge against economic uncertainty. It has risen more than 500 percent in the past 10 years, and its gains accelerated as the economic crisis unfolded. Platinum is one of a family of six metals referred to collectively as the platinum group metals (PGMs) that are virtually irreplaceable in certain industrial and electronic applications. Auto-catalysts accounts for about a third of world platinum demand, and platinum is also heavily used in the electronics industry in the manufacturing of televisions and computer hard drives.
Approximately 10 tons of ore must be mined - sometimes almost a mile underground at high temperatures to produce one pure ounce of platinum.
One important factor that could push platinum prices up is that about 80 percent of it is mined in South Africa, a country known for a workforce with a penchant for striking as well as spotty electricity supply—both of which increase mining costs. Platinum was benefiting last week from reports that Eskom, the power utility of a major platinum producer in South Africa, had warned of a power shortage. Platinum's current cheap price compared to gold and the threat of supply constraints from South Africa should make it attractive to buyers. The country's mines are getting hit with growing electricity costs and deteriorating margins. Mining expenses were up 30% in 2011. Research from Barclays Capital noted that: “at levels of about $1,530 an ounce, platinum is trading close to or below the price at which some miners break even and that high-cost producers are already losing money.”
Costs for Anglo American Platinum (AMS) are running at $1,567 an ounce.
Today's spot price in New York was $1,515 an ounce.
This means that current prices are low not only based on technical analysis of ratios. They are low compared to the very basic fundamental information – production cost. With prices as low as they are right now and rising inflation and oil prices (thus rising costs), the supply of platinum will shrink, which should inevitably lead to higher prices. Consequently, the downside in platinum is very limited and the upside potential is substantial.
To look at what is in store for precious metals in the near future, we will begin this week's technical part with the analysis of the USD Index. We will start with the very long-term chart (charts courtesy by http://stockcharts.com.)
USD and Euro Indices
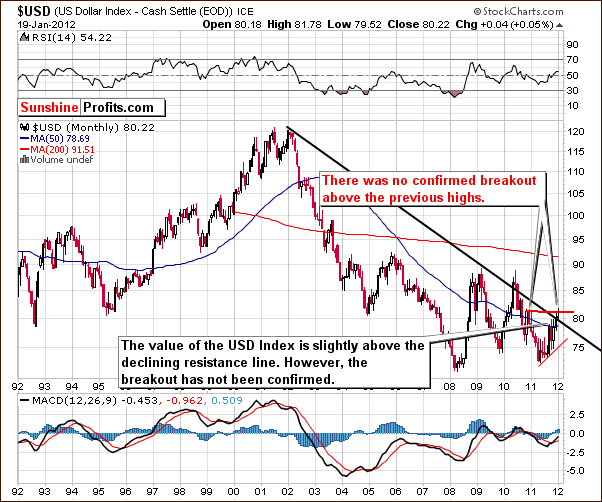
Our first chart this week is the very long-term USD Index chart. We see little change in the situation since last week. There has been no confirmed breakout above the late 2010- early 2011 highs and the long-term trend remains down.
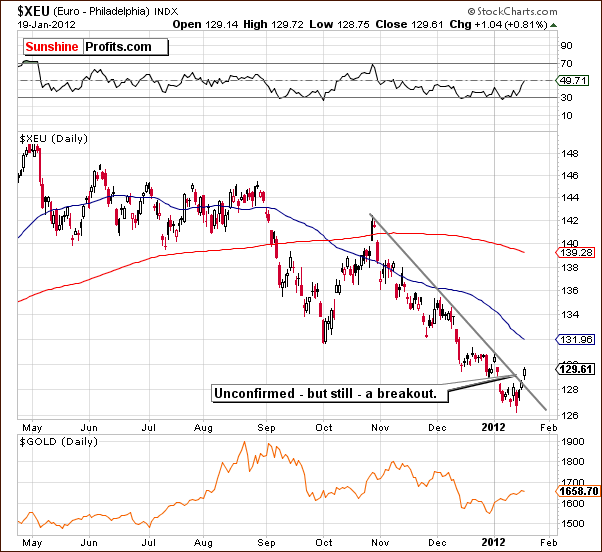
In the short-term Euro Index chart, there are some visible changes this week. Though not yet confirmed, there is a visible breakout above the short-term declining resistance line. This is positive news for the euro currency itself and bearish news for the dollar.
We have an early indication here that the USD Index will finally begin to decline as the sluggish situation seen during this month seems to be reversing. It is too early to draw conclusions, however, since the breakout here is not yet confirmed.
Summing up, the situation in the USD Index is a bit more bearish due to a sign of a possible breakout in the Euro Index. Since this move is not confirmed, the change is not extremely important yet, but the situation is more bearish for the dollar now as compared to recent weeks.
General Stock Market
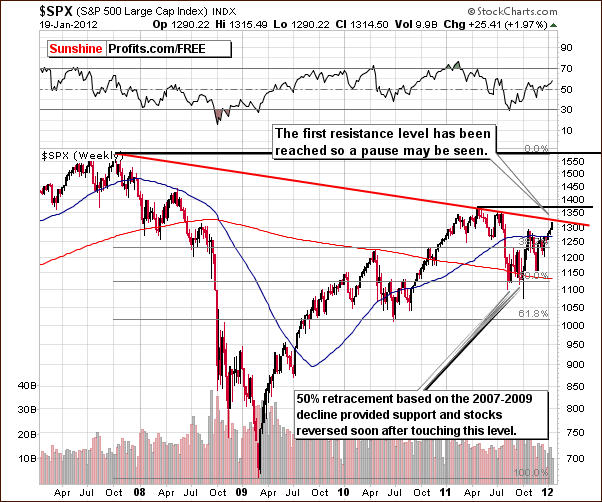
In the long-term S&P 500 Index chart we see that stocks moved close to an important resistance line formed by the 2008 and 2011 tops. It appears likely that a period of consolidation could begin very soon and the recent rally will likely pause for a bit.
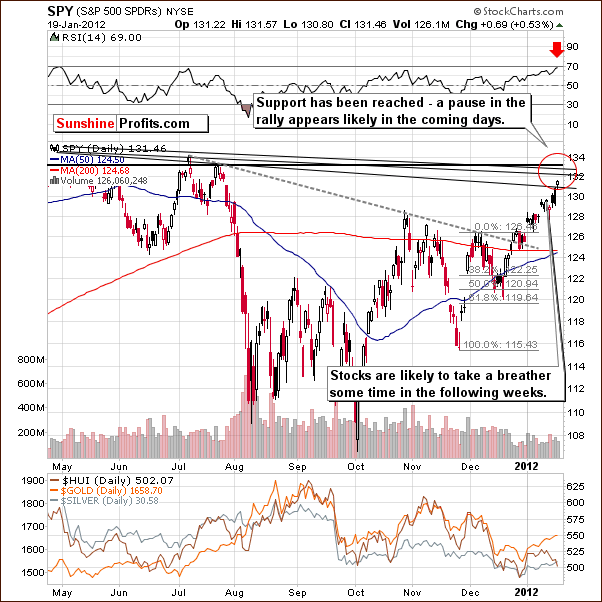
In the short-term SPY ETF chart, a proxy for the general stock market, we have a signal from the RSI levels that a local top may be close. This is based upon comparisons to past patterns where similar RSI levels have coincided with local tops as seen last July. A pause here in the recent rally would not be a surprise and could, in fact, be a healthy development for the general stock market. Consolidation periods are often followed by strong rallies as the stocks can actually gain strength for their next move to the upside.
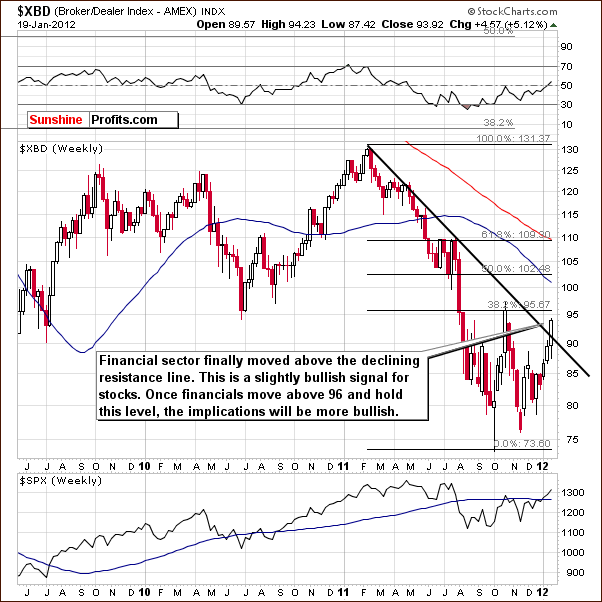
In the Broker Dealer Index chart this week, we see a breakout above the declining resistance line. This follows a strong move to the upside and although we could see a move back to the support line (and then likely a reversal), the financials do appear to be showing signs of strength. This is a bullish development for stocks in general, as the financials often lead the general stock market to higher (or lower) prices.
Summing up, stocks are soon to encounter a major resistance line which will likely stall their recent rally. The strength seen in the financials, however, is often followed by moves to the upside for stocks in general. It seems probable that following a pause or small consolidation period, stocks could very well rally to new 2012 highs with the next resistance level around 1375. This is about 5% above Thursday’s closing level for the S&P 500 Index.
Correlation Matrix
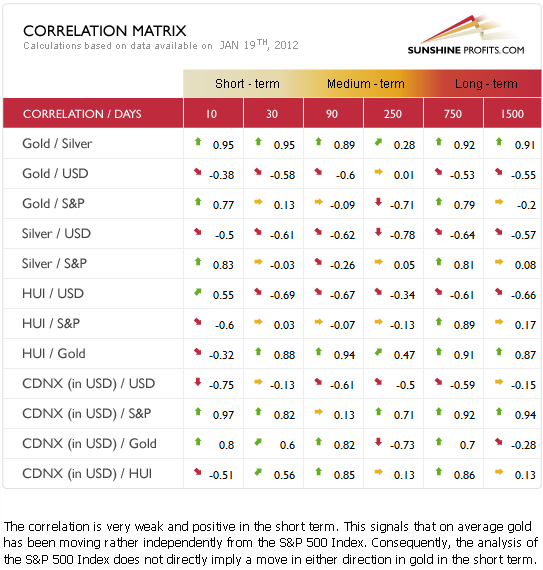
The Correlation Matrixis a tool which we have developed to analyze the impact of the currency markets and the general stock market upon the precious metals sector. A look at the short and medium-term columns for stocks in relation to precious metals shows that the expected pause in the general stock market does not seem to pose a serious threat to the precious metals market. The correlation with precious metals is weak in the short- and medium-term columns and it seems that gold and silver investors have little to worry about with respect to the general stock market outlook.
The USD Index situation is likely to provide bullish news for the precious metals sector. The negative correlation between the dollar and the metals means that declines in the USD Index will likely coincide with higher precious metals prices. All-in-all, the situation has improved slightly this week for gold, silver, and gold and silver mining stocks based on the short-term (and so far not confirmed) breakout in Euro Index.
Gold
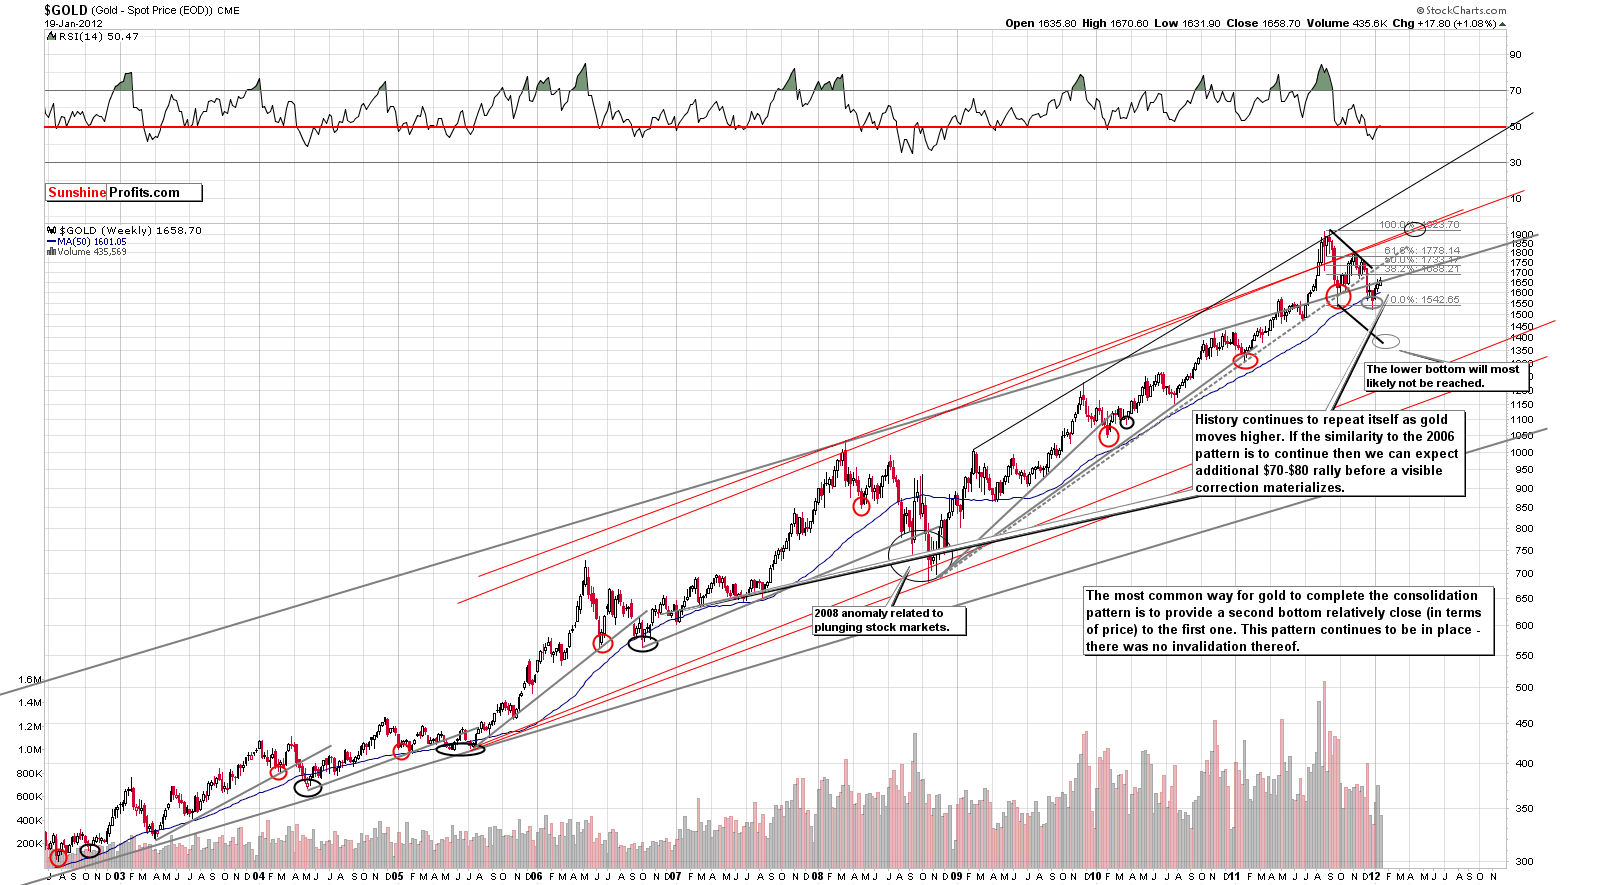
We begin our gold section this week with a look at the very long-term chart (please click the above chart to enlarge). There have been no meaningful changes in this chart as the rally has continued after the late 2011 bottom. It seems likely that gold will move another $70 or $80 from Thursday’s close before reaching its next local top.
It seems that the next local top would probably be slightly below the level of the previous one, analogous to what we saw in 2006. The $1,735 price level appears to be a likely target based on Thursday’s closing price level just below $1,660. Once this local top is reached, we expect another consolidation period followed by a continuation of the rally.
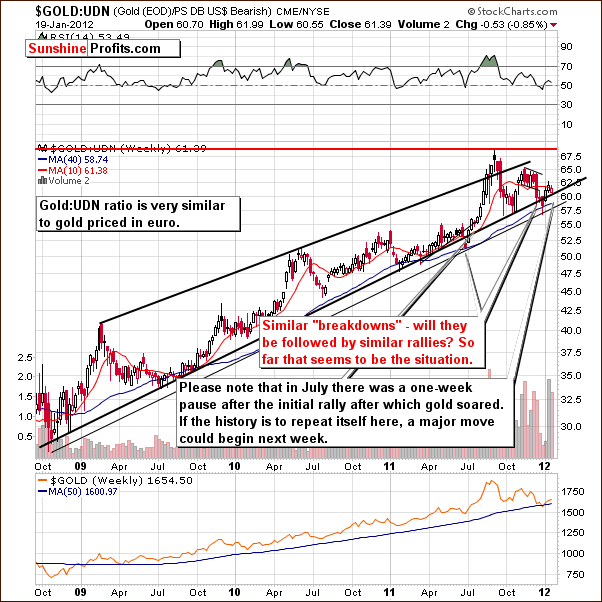
In this week’s long-term chart of gold from a non-USD perspective, the situation is a bit more interesting. Gold’s non-USD price is similar to its price in euros and here we see a situation quite similar to mid-2011. Back then we saw a fake breakdown, rally, one week pause and then a sharp upswing. It seems that this time around, we may see similar moves, but the consolidation could stretch to two weeks due to the size of the recent breakdown and the length of the preceding decline.
All-in-all, it seems like this week’s pause is very much in tune with the previous price pattern. Therefore, if a consolidation is seen soon, there will not be an invalidation of the current price pattern.
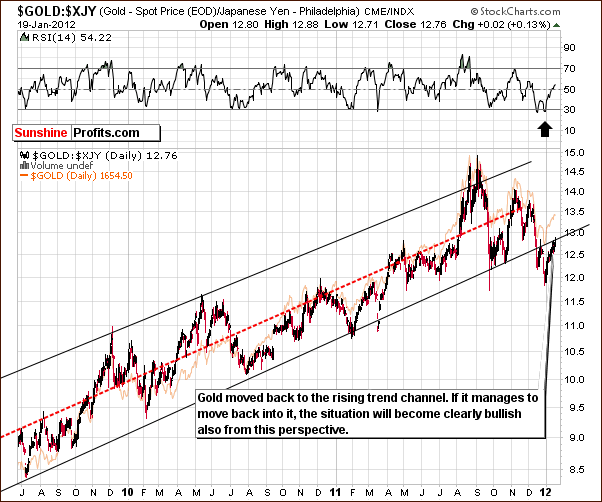
In this week’s long-term chart of gold from the perspective of the Japanese yen, nothing has changed in the past week. The index level is still right at the lower border of the rising trend channel. No breakdown has been seen and no decisive move above this significant support/resistance line has taken place. The situation is therefore mixed and there is little else to say at this time.
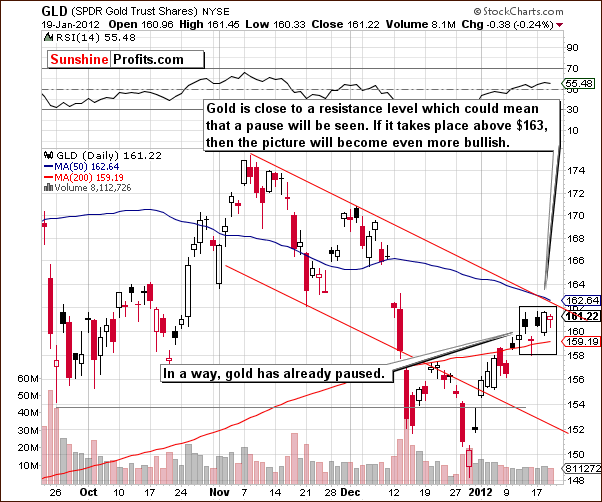
In this week’s short-term GLD ETF chart, we see a somewhat perplexing picture. Both have consolidated somewhat already this week, moving back and forth within a narrow trading range. Gold might be ready to move higher quite soon but since the consolidation has been very small, it’s a tough call as to when the upswing will start. There could be another small move to the downside before prices rally but the important point is that the main short-term trend appears to be to the upside.
Summing up, the situation in gold developed very much in line with what we stated last week. The small period of correction or taking a breather, may or may not be over at this point. The implications from here favor considerably higher prices before any significant (!) correction is seen.
Silver
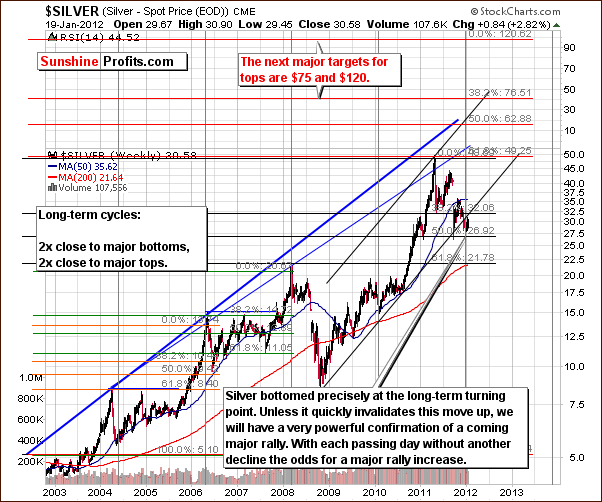
In this week’s very long-term chart for silver, there has been no change since last week. Our comments in last week’s Premium Update are still up-to-date:
Silver bottomed right at the very long-term cyclical turning point and prices have moved higher since. The lack of any additional declines has clearly confirmed that the bottom is in and greatly increases the odds of a rally from here. This appears to have been a major bottom, perhaps as significant as the one seen late in 2008 which was followed but what could be described as pretty much a two and one-half year rally with prices rising more than 500% through early 2011.
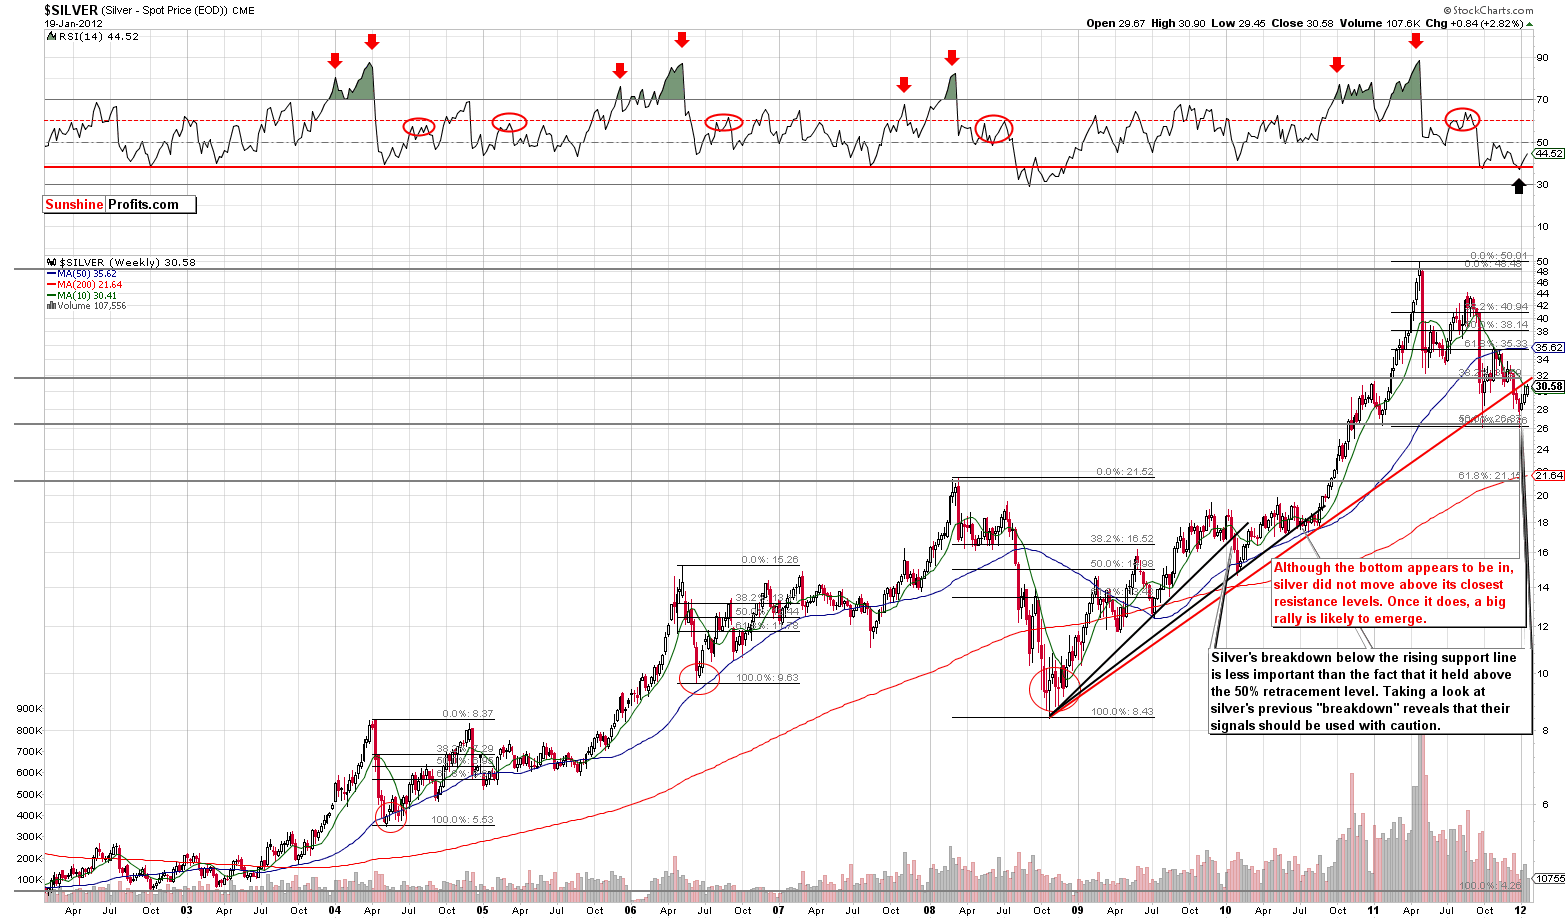
In this week’s second very long-term chart for silver (please click the above chart to enlarge), once again we repeat what we stated in last week’s Premium Update:
We see that the bottom appears to be in here as well, and silver’s price is close to a resistance level which is indicated above by the rising red line. This line also coincides with the 10-week moving average (green line). The RSI level also suggests that the bottom is in, but we prefer to see an additional move to the upside – above the resistance levels - before calling the situation more bullish than it is right now. It is bullish anyway, but at this point we see no reason for increasing the size of the long position.
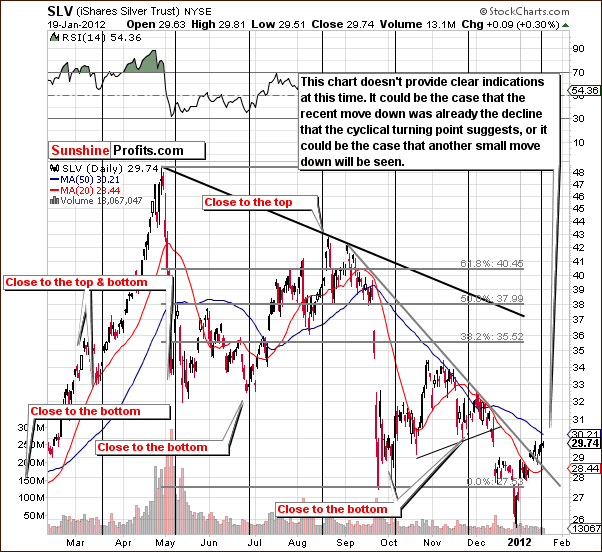
Looking at silver’s short-term chart, the situation is somewhat ambiguous, much as we saw in the case of gold this week. Here we have a cyclical turning point upon us and the small correction seen recently may or may not be the expected local bottom to coincide with the turning point. There could be another move to the downside to create the true local bottom.
At this point, it seems about 50/50 as to whether we’ll see another local bottom form or whether a move to the upside will be seen right away. The small decline seen recently did provide a verification of the breakout above the declining short-term resistance line; this is bullish in and of itself.
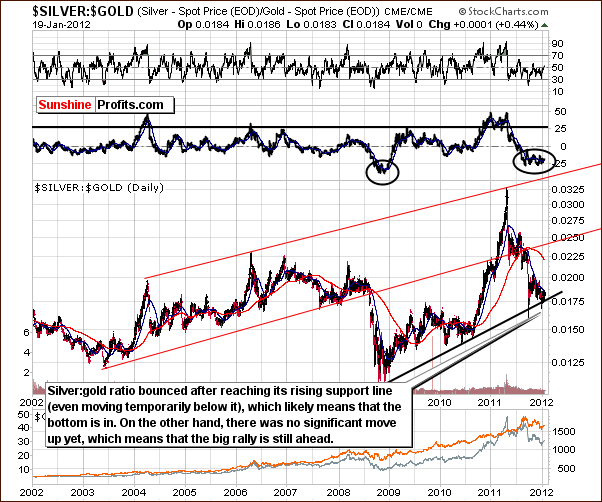
Looking at the silver to gold ratio chart, there is no sign that any major rally has started. Although we have seen higher prices for silver and gold, nothing is seen in the ratio of the two metals. We expect both to move considerably higher. The above chart emphasizes that the current situation is very similar to the 2008 bottom. Please note that both metals moved much higher after that bottom formed.
Summing up, the short- and medium-term outlook for silver continues to be bullish overall, but the very short-term picture is somewhat unclear at this time.
Platinum
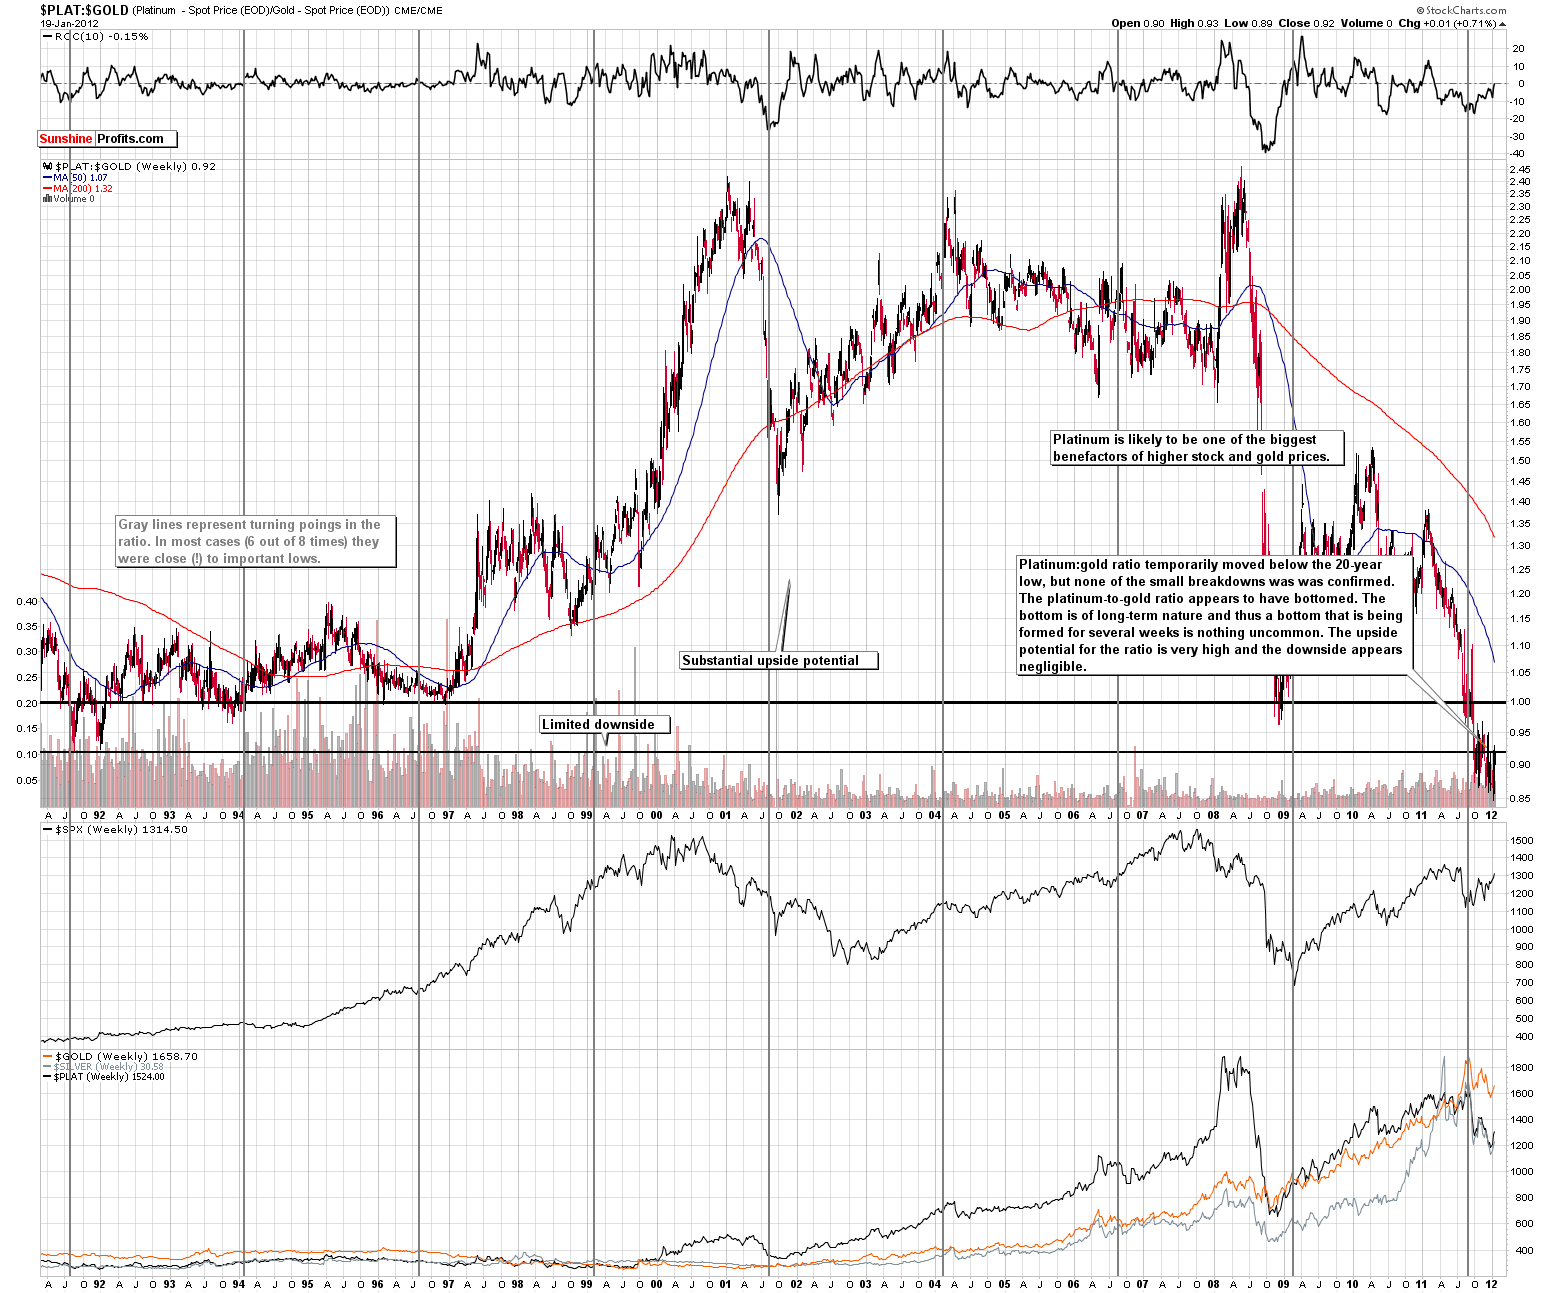
On the above Platinum to Gold ratio chart (please click the above chart to enlarge), we see an anomaly unlike anything seen in recent years. There have been several small breakdowns below the level of previous lows but none have held. Platinum’s extreme undervaluation is not something is likely to persist for much longer. The ratio is now at .92 and once it begins to move higher, much more platinum buyers are likely to enter the market. Platinum’s price below the one of gold is something that investors view as a buying opportunity (as seen on the above chart) so the only factor that remains in place – preventing prices from moving higher – is fear. Once it subsides as investors see that platinum is not breaking lower, they will buy. This action will likely result in platinum to soon be outperforming gold, something which has not been seen for some time (except earlier this year).
Summing up, it appears that the situation in the platinum to gold ratio and for platinum itself is favorable.
Gold and Silver Mining Stocks
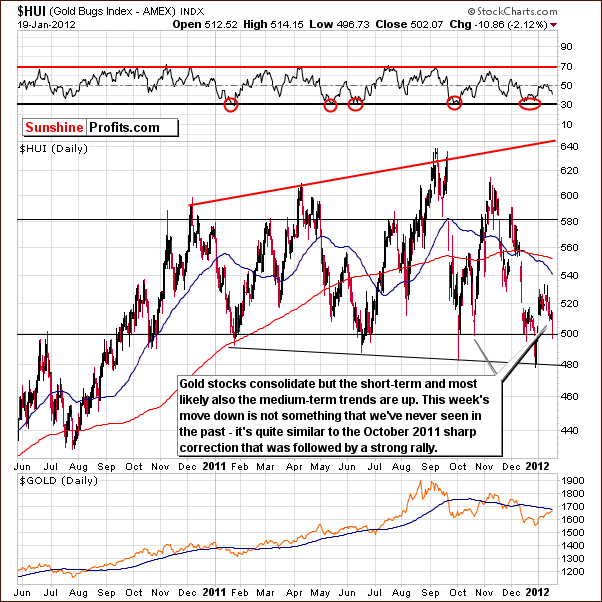
Last week we wrote that another possibility is that the HUI Index could correct or consolidate further especially if led by gold and silver. In this case, it still [did] not seem likely that such a decline would result in the HUI Index moving below the 500 level.
In this week’s long-term HUI Index chart, we saw a decline this week. The index did not decline below the 500 level and its recent trading pattern is similar to what we saw last October. Back then, a period of rally followed a trading pattern similar to what we’ve seen since late December and there are bullish implications this time as well.
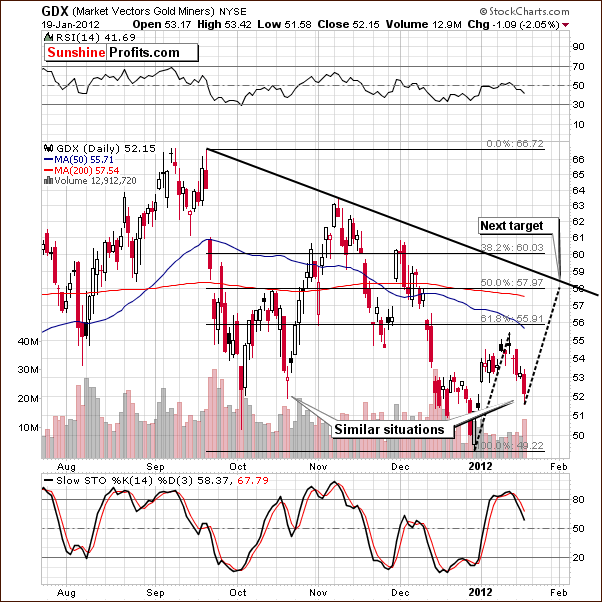
In the short-term GDX chart this week, the situation is much the same here. The recent decline took miners to the October 2011 level. If the correction is over, then expect a move to the upside similar to the previous one. Calculating the medium-term resistance line brings us to a likely target around $58. This is a short-term target only and it is possible that higher target levels will emerge once this intermediate target is reached.
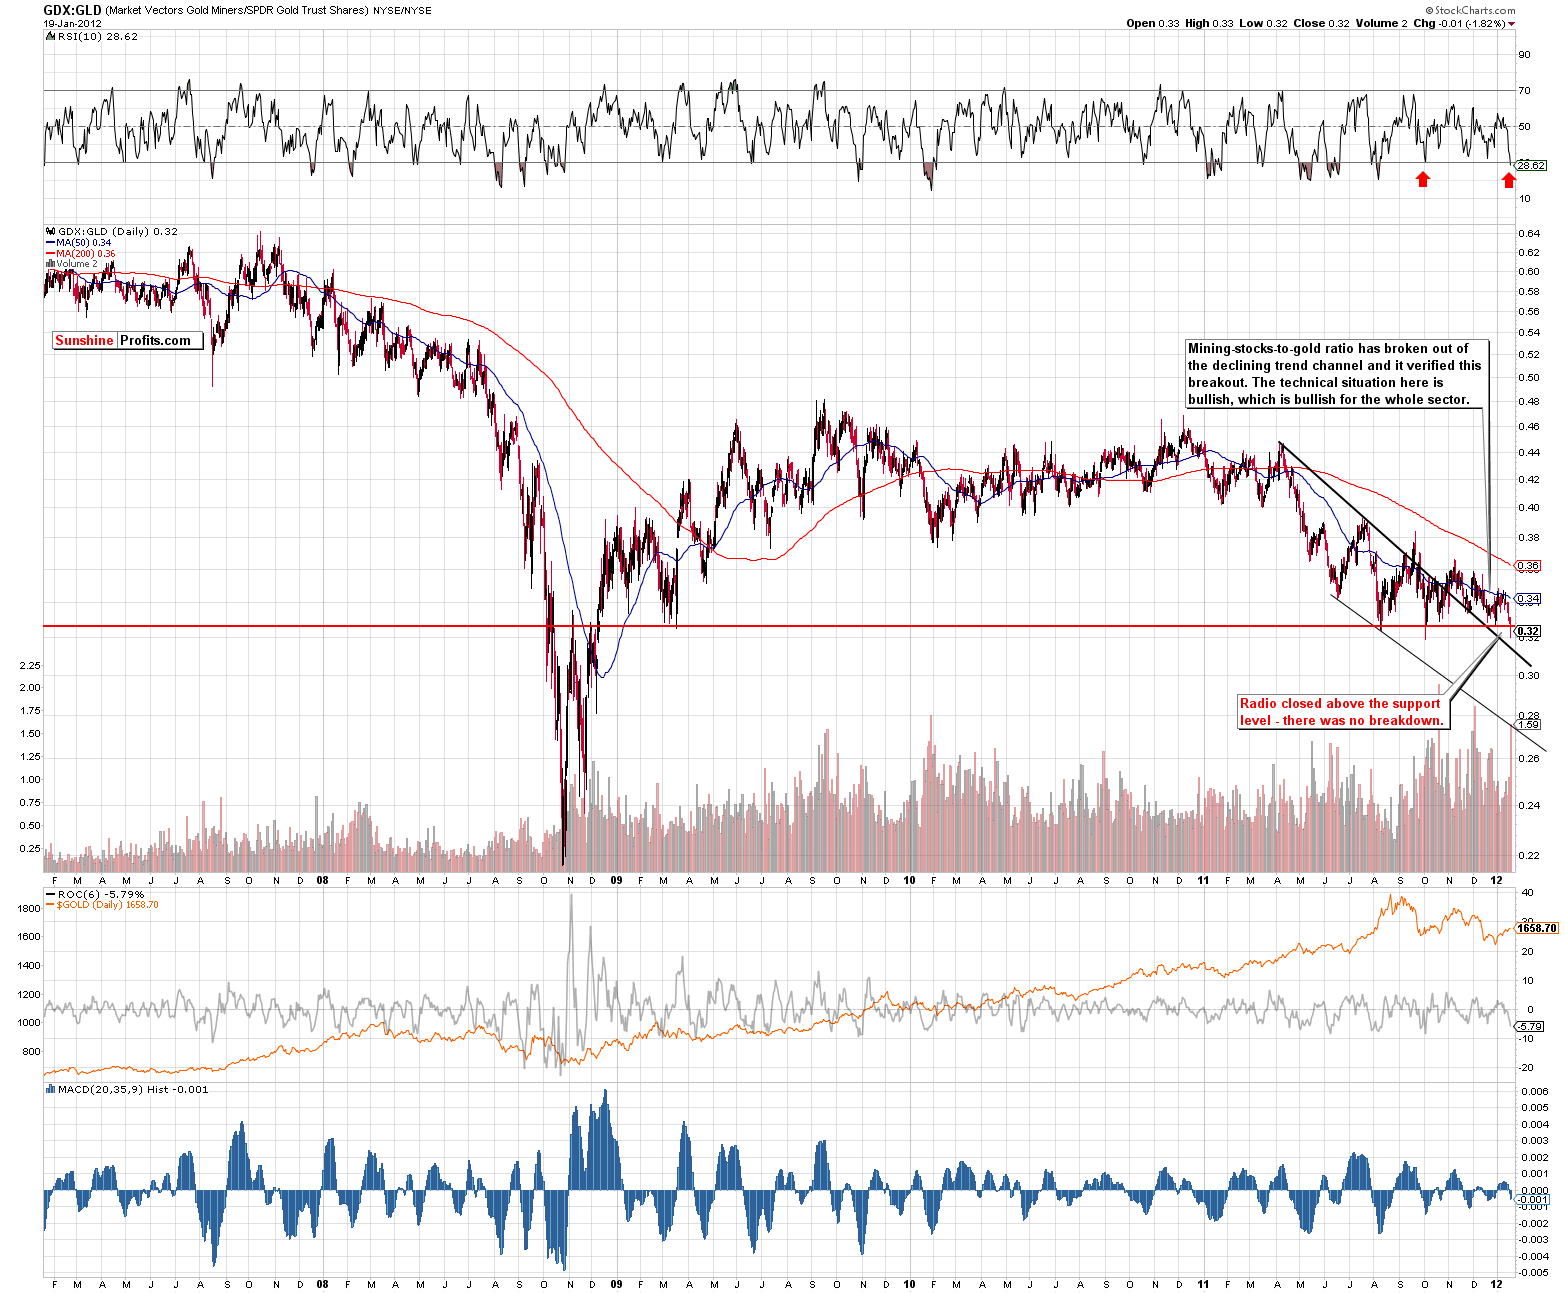
In the miners to gold ratio chart (please click the above chart to enlarge), the recent decline in the miners was not matched by declines in the underlying metal. There is no need to worry though. The ratio was at these low levels several times in the past six months and this generally coincided with a local bottom, a point confirmed by today’s RSI level. Overall, the situation is not too bad here at all.
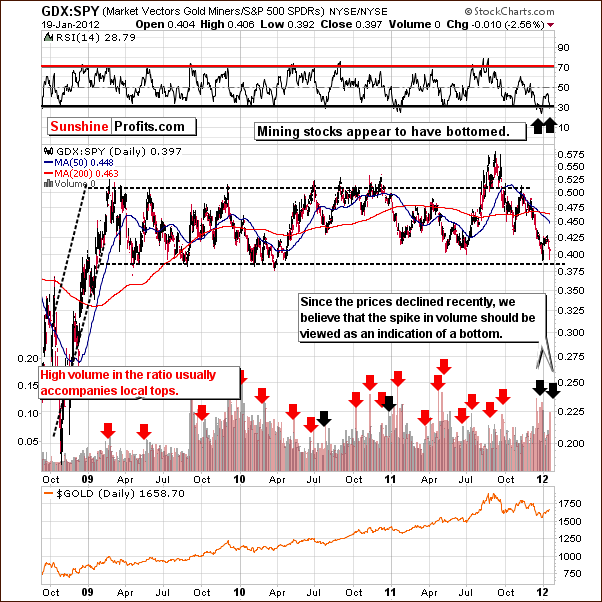
In the GDX:SPY ratio chart, we see a move to a strong support level on significant volume and a buy signal from the RSI level. It seems likely that we have a double bottom similar to mid-2011 and last year this was followed by a significant rally almost immediately.
Summing up, the situation in mining stocks remains bullish although if declines are seen in metals in the coming days, additional weakness is possible here on a very short-term basis. The HUI Index could move down to 480. The probability of this appears to be about 30% - it’s much more likely that gold stocks will either trade sideways close to 500 or move higher right away
Letters from Subscribers
Q: What are your thoughts on this? Is this a positive or negative for stocks like GDX?
“‘We’ve still got a very, very compressed spring because the shorts are still trying to defend their… naked short positions in both the gold and silver markets. As an example, in the silver market, you saw that type of activity in the silver ETF (SLV). Shorts borrowed another 3 million ounces to cover immediate delivery concerns. There are 25 million ounces now borrowed from SLV. It is getting worse and worse for them.
…
They are naked short on the COMEX and to meet immediate delivery demand they are having to borrow it from the SLV. It is still unwinding and it’s still got a long way to go.
…
The demand for euro gold here in London is so intense it’s shocking to some of the players. This is what has left some market participants in the US wondering why the price of gold has risen along with the dollar. It’s because demand in the eurozone is unimaginably strong. The euro physical gold demand is off the charts and it is creating shortages…’”
A: We agree that GLD and SLV are not good ways to purchase precious metals with long-term investments in mind (physical existence of the metals is the key issue in this case). However, they are a useful proxy for short-term metals traders, where physical ownership matters little.
We also agree that European gold demand is strong and that it is the key factor behind gold moving up along with the USD Index.
The whole situation (naked short positions in the futures market, paper gold, paper silver etc.) is a positive fundamental factor for precious metals and (to a lesser extent, but still positive) for precious metals mining stocks and corresponding ETFs (like GDX). In other words, it will eventually lead to higher prices, but not necessarily right away.
Summary
The situation in the currency markets is a bit more favorable for the precious metals this week. It appears that the USD Index could begin to move lower, which generally leads to higher precious metals prices. The euro appears to be strengthening and if its breakout is confirmed, will likely lead to good news for gold and silver investors.
The general stock market situation is a bit more bearish this week as stocks have moved close to an important resistance line. A pause in the current rally is therefore likely but does not appear to impact the outlook in the precious metals sector.
The situation in gold and silver is quite perplexing for the very short term. It’s simply not clear if the recent period of consolidation has concluded or if we have just seen an early part with a small bounce. Either way, the downside at this time appears to be quite limited and betting on lower prices doesn’t appear to be a good idea – long positions still appear to be justified.
Gold and silver mining stocks could see lower prices if a correction is seen in the gold and silver markets. The HUI Index, for example, could move lower but might simply repeat its recent intra-day move below 500, only to move back above these levels before the close. The GDX:SPY ratio and the miners to gold ratio further confirm this sentiment.
Naturally, you will be kept up-to-date via Market Alerts, should the above change.
This completes this week’s Premium Update. Our next Premium Update is scheduled for Friday, January 27, 2012.
Thank you for using the Premium Service. Have a profitable week and a great weekend!
Przemyslaw Radomski

