
Gold rallied this week hitting its highest in a month and breaking above its 200-day moving average. There were a myriad of reasons suggested in the financial press. Some writers said it was a stronger euro that helped boost the price above the key technical level. One headline said it was due to a buying binge from China ahead of the Lunar New Year which begins January 23. (The country imported a record 103 tons of gold from Hong Kong in November, up 19% month-on-month and a 483% increase year-on-year.) Another headline attributed the rise in the price of gold to active demand from India where consumers took advantage of a drop in local prices to stock up ahead of the wedding season beginning later this month. Whatever the reason, we gave you a heads up last Friday in the Premium Update when we wrote in our gold section summary: the medium-term consolidation for gold appears to be over as a double bottom has formed and prices have begun to rise. Higher prices appear to be likely in the days and weeks ahead
Seasoned gold investors know that gold prices can be quite volatile - with big upswings often followed by big downswings, albeit wrapped around a rising long-term trend. At every downturn the gold bears have come out of the woodwork. And just as they have been repeatedly wrong in the past decade, they are still wrong (in our opinion) in 2012. Before this week’s rise, the Wall Street Journal wrote an obituary for gold as a safe haven. The article by Stephen L. Bernard said that “it turns out gold is just another metal after all.” It noted that after trading for much of 2011 as a safe haven, gold is acting more like other commodities and riskier assets these days.
For much of the past two years, when the economic slowdown and European debt crisis sent investors looking for low-risk assets, gold traded in the opposite direction of the euro. Gold could return to its safe-haven status again if the Federal Reserve embarks on another round of bond buying, which would likely hurt the dollar, analysts said. Gold is priced in dollars so it becomes cheaper to buy using other currencies when the dollar weakens. It can also serve as an alternative safe haven when U.S. currency loses its appeal.
At Sunshine Profits we are far away from writing the obituary for gold. At this point there are no indications that gold would not be up again in 2012 – so the trend should remain in place.
And now let’s take a look at some stories related to gold around the world.
Athens
Deeply indebted and nearly bankrupt, Greece’s economy is sliding into free fall. But there is at least one growth industry in Greece among the sad-looking boarded up shops and the unemployment that has surged to 18.8 percent. Pawnshops and gold dealers are thriving and the authorities reported a veritable explosion in the sector, with 90% of the nation’s 224 officially registered pawnshops having opened in the past year. Greek authorities contend that many of the shops are concealing a rapidly expanding illicit trade in gold, and that much of it is being smuggled out of the debt-racked country, confounding efforts to curb rampant tax evasion. Similar trends have been reported in other countries that were hit by recession.
Mumbai
India’s gold retailers are becoming aggressive in attracting customers by offering a free iPad every hour for customers who buy with a credit card. With gold prices so high, customers are wary of carrying large amounts of cash and find it convenient to pay in installments. According to the World Gold Council, gold demand in the third quarter of 2011 reached 1,053.9 tons, an increase of 6% as compared to the same period last year. This equates to $57.7 billion, an all-time high in value terms. But now that the rupee has hit a one-month high against the dollar, dealers in India are reporting strong physical demand. As the nation’s policy makers rein in inflation, boosting the rupee after a 16 percent slump last year, gold demand may rise even further. India's central bank has allowed four more banks to import precious metals, a move that would boost competition and help reduce premiums in the world's number one importer of bullion.
London
Goldman Sachs announced this week that it is staying “overweight” on commodities as a rebound in demand revives speculation of shortages, with gold a favorite for 2012. The trading house analysts say Gold futures may climb to $1,940 an ounce in 12 months as U.S. interest rates and inflation are expected to remain low. Demand for gold strengthened most of last year as Europe’s debt crisis widened and the U.S. Federal Reserve pledged to keep interest rates near zero until at least mid- 2013. Low interest rates increase the appeal of bullion because they mean there is no opportunity cost.
Philippines
To many villagers in Pantukan, the lure of gold far outweighs the danger of living in a place threatened by landslides. Mining is not only the main occupation in Compostela Valley, it is its lifeline. Some 30,000 families in the province depend on small-scale mining. That is why it is next to impossible persuading the people to give up their homes and jobs and live in a safer place.
Germany
The German economy expanded faster than any other Group of 7 nations last year but the euro stress and a slowing global economy appear to be already weighing on output. Germany expanded by 3 percent last year from 2010. However, that the growth came mostly in the first half of 2011, and estimated that the economy actually contracted by about 0.25 percent in the fourth quarter from the prior three months. Some economists now predict another contraction for Germany in the first three months of 2012, which would meet the usual definition of a recession as two consecutive quarterly declines in output.
Hollywood
When Hollywood’s top stars, including Gorge Clooney, Leonardo DiCaprio, Angelina Jolie and Steven Spielberg will attend the Golden Globe Awards dinner this Sunday, we are not sure if they will count calories or carats. Golden flakes will top their dessert, including a white chocolate ball covered with gold dust.
The lavish dessert is a chocolate almond crunch terrine with acacia honey, caramel and fresh berries. The chocolate will be flown in from Switzerland, the acacia honey caramel will arrive from France, the tarragon hazelnuts from Italy and the Valencia almond paste from Spain. Each desert plate will be sprinkled with 23-carat edible gold flakes along with a white chocolate ball sprayed with gold dust.
If you are one of the lucky ones to dine on this delicious desert, you may want to know how much the gold on your plate is worth so let's begin this week's technical part with the analysis of the USD Index. We will start with the very long-term chart (charts courtesy by http://stockcharts.com.)
USD Index
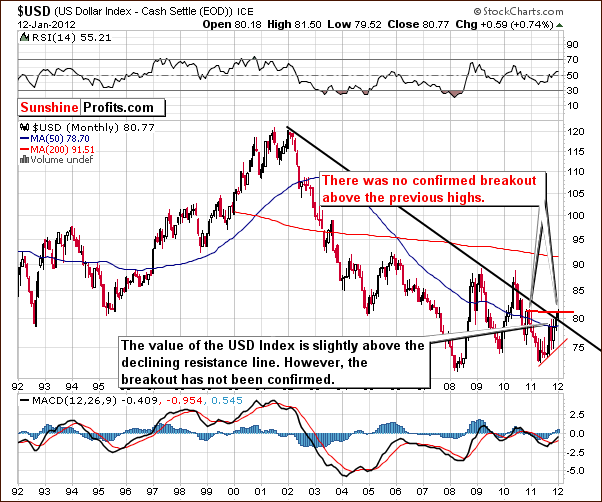
Our first chart this week is the very long-term USD Index chart. While the index level has moved slightly in both directions each day this week, it is little changed from a week ago. The previous high seen late in 2010 has still not been broken, and the index level is now slightly above the declining resistance line. Since the breakout has not been verified, however, the situation is not truly bullish. The bottom line here is that there has been little change since last week and the situation remains mixed.
General Stock Market
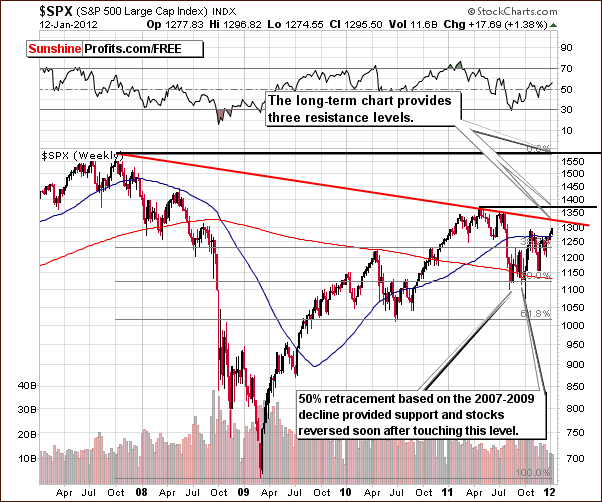
In the long-term S&P 500 Index chart, nothing has really changed this week. Three resistance levels still lay ahead with the first just 3% above Thursday’s closing index level. Pauses in the current rally are likely when these levels are encountered and the first such pause is probably just days away (up to 2 weeks or so). It’s likely that the recent rally will continue after the short pause at (or slightly above/below) the initial resistance level.
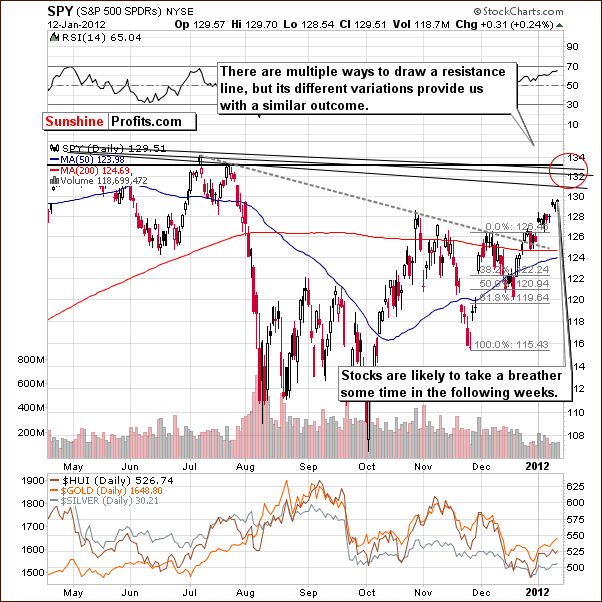
In the short-term SPY ETF chart this week, we see that stocks are close to our initial target area for the current portion of the rally. This does not mean that the rally will soon end and stocks will see a significant plunge. The more likely outcome of reaching this level is simply a slight pause followed by an additional period of rally.
Summing up, the outlook for the general stock market has not changed. The medium term appears to be quite bullish for stocks in general and this bullish outlook holds for the short run as well. A slight correction is likely at some point in the short term but declines seem far less likely than a move to the upside following this pause.
Correlation Matrix
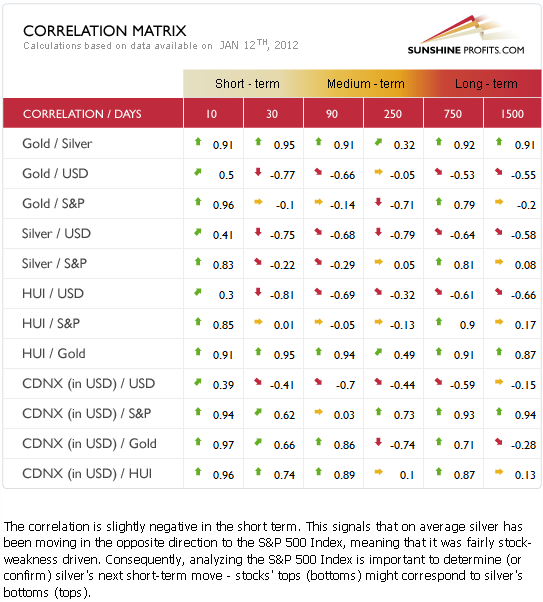
The Correlation Matrixis a tool which we have developed to analyze the impact of the currency markets and the general stock market upon the precious metals sector. This week, the general stock market has very little influence on the precious metals based on the coefficient values. There are some significant values in the 10-day column between stocks and precious metals, and this increases the likelihood that a pause in one market will coincide with a pause in the other. More will be discussed on this topic in later sections of this update. Overall, the coefficients between stocks and the precious metals are not strong enough to suggest any significant implications at this time.
In the following sections of this week’s Premium Update, we will see that the situation in the general stock market is quite similar to the outlook in the gold, silver and gold and silver mining stock markets as well. So, the very short-term 10-day column here could be viewed as a weak confirmation of this theory.
The USD Index coefficients in the 10-day column with gold, silver and gold and silver mining stocks have now become positive. This is a result of gold’s price moving higher this week even when the USD Index did the same. This is a slight indication that the impact of the USD Index upon the precious metals sector is no longer crystal clear. With positive correlations in the 10-day column and negative in the 30-day column, the implications can be described as unclear at best. If this continues for another week, then we’ll have a positive 10-day column and a neutral 30-day column, quite a different picture when compared to previous weeks. In short, there is little to elaborate on here and it seems best at this time to trust the more reliable tools, the charts and analysis of the precious metals markets themselves.
Gold
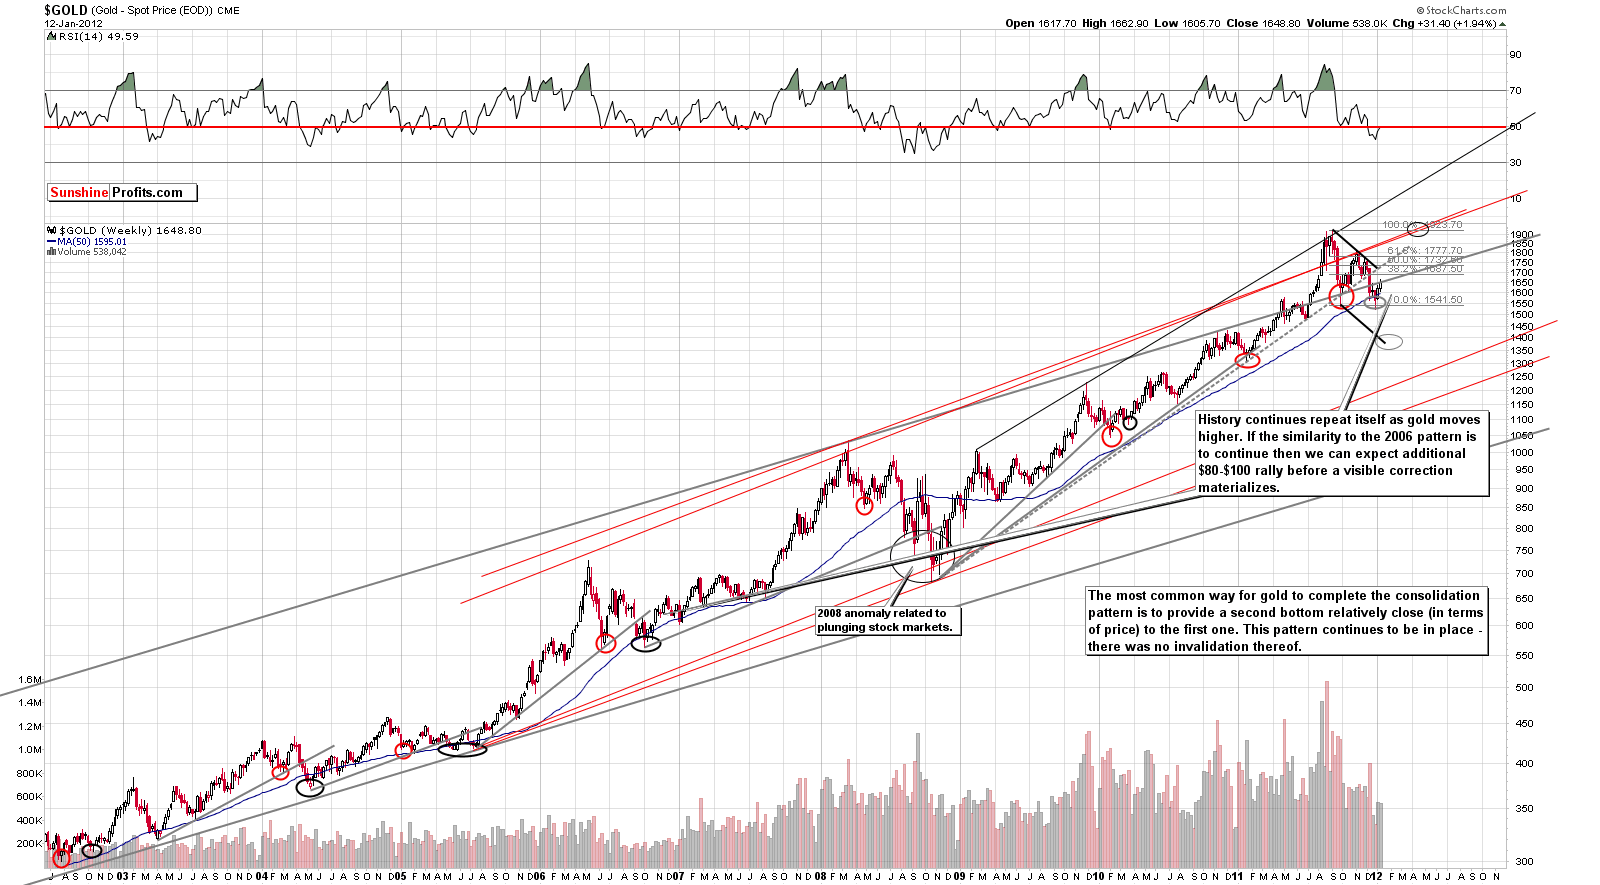
This week, we begin our gold section with a look at the very long-term chart (please click the above chart to enlarge). We have recently seen a nice bottom form at the end of 2011 and gold prices have moved higher in 2012. This rally may continue to record high gold prices, but even if not the case immediately, it still seems we are likely to see higher prices in the short term. This is based on a similar trading pattern which developed in 2006.
If the pattern plays out the way it did in 2006, gold is likely to move higher by $80 or $100 before any serious pause. Of course in 2006, gold finally moved to its previous highs, which here would correspond to around $1,900. It then consolidated close to its previous high, broke out, and saw a powerful rally follow. Such a pattern may be seen again this time or we could see a rally right away without a pause. In any case, it seems that we are quite a ways from any serious correction in the current rally. The long-term picture here is clearly bullish.
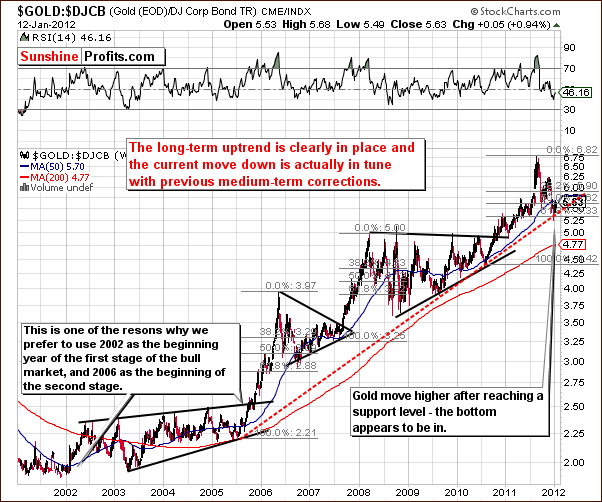
In the gold to bonds ratio chart, we also see bullish signs. The recent bottom formed close to the long-term support level and the index is now right at it after a period of zigzag correction. When comparing current patterns with the trend seen in 2006, it seems likely that a move to the upside will be seen from here.
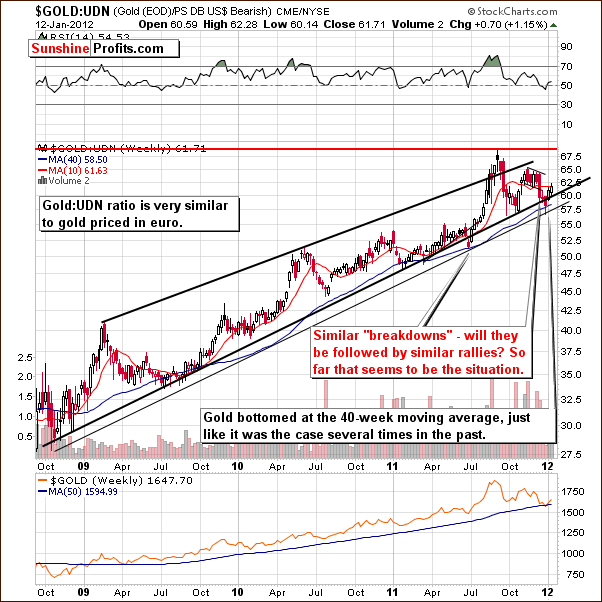
In this week’s long-term chart of gold from a non-USD perspective, we can see that prices are clearly back within the rising trend channel. The pattern here is very similar to what was seen in the middle of 2011 and suggests that a powerful rally without a significant pause is quite possible. After such a rally, a prolonged consolidation would be probable once new highs have been reached. The implications here are different than from the comparison between today and 2006 – consolidation at previous highs vs. no consolidation. However, in any of these scenarios, the weeks ahead should see higher gold prices – also from a non-USD perspective.
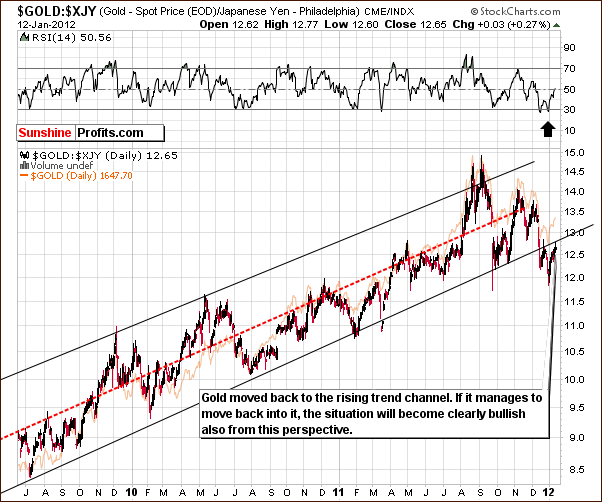
In this week’s long-term chart of gold from the perspective of the Japanese yen, the situation is a bit different. We do not see clearly bullish implications here. While it is somewhat improved when compared to two weeks ago when we saw a big move below the rising trend channel, the outlook here now appears to be mixed. It simply is not clearly bullish, but with the index level no longer below the rising trend channel, it’s not overly bearish either.
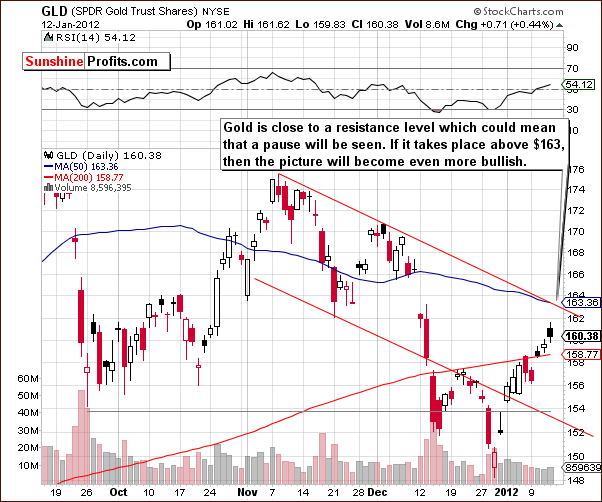
In this week’s short-term GLD ETF chart, we see that gold is about to reach the upper border of the declining trend channel and its 50-day moving average. We could see a pause and possible consolidation around this $163 price level. The outlook will remain bullish here unless a top forms and a decline is seen on significant volume. On the other hand, if the decline takes place above the $163 level and takes gold no lower than to this particular level, it would be a very bullish development and we would likely consider adding to long positions.
Summing up, the outlook for the medium and long term for gold is bullish. The short term could very well see a pause at some point in the next 5 to 10 trading days with the rally resuming thereafter.
Silver
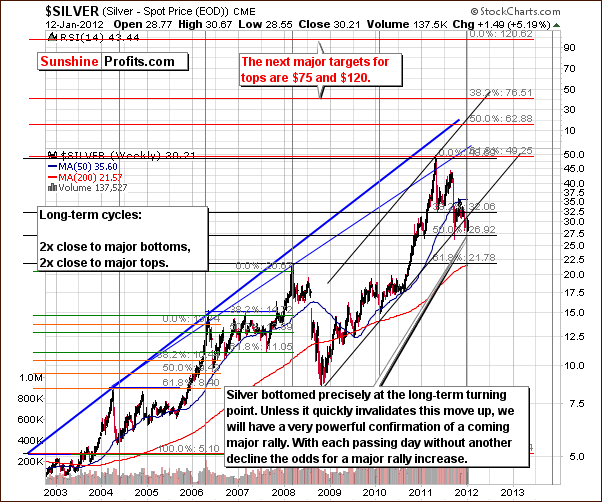
In this week’s very long-term chart for silver, we begin by reemphasizing the importance of a recent development. Silver bottomed right at the very long-term cyclical turning point and prices have moved higher since. The lack of any additional declines has clearly confirmed that the bottom is in and greatly increases the odds of a rally from here.
This appears to have been a major bottom, perhaps as significant as the one seen late in 2008 which was followed but what could be described as pretty much a two and one-half year rally with prices rising more than 500% through early 2011.
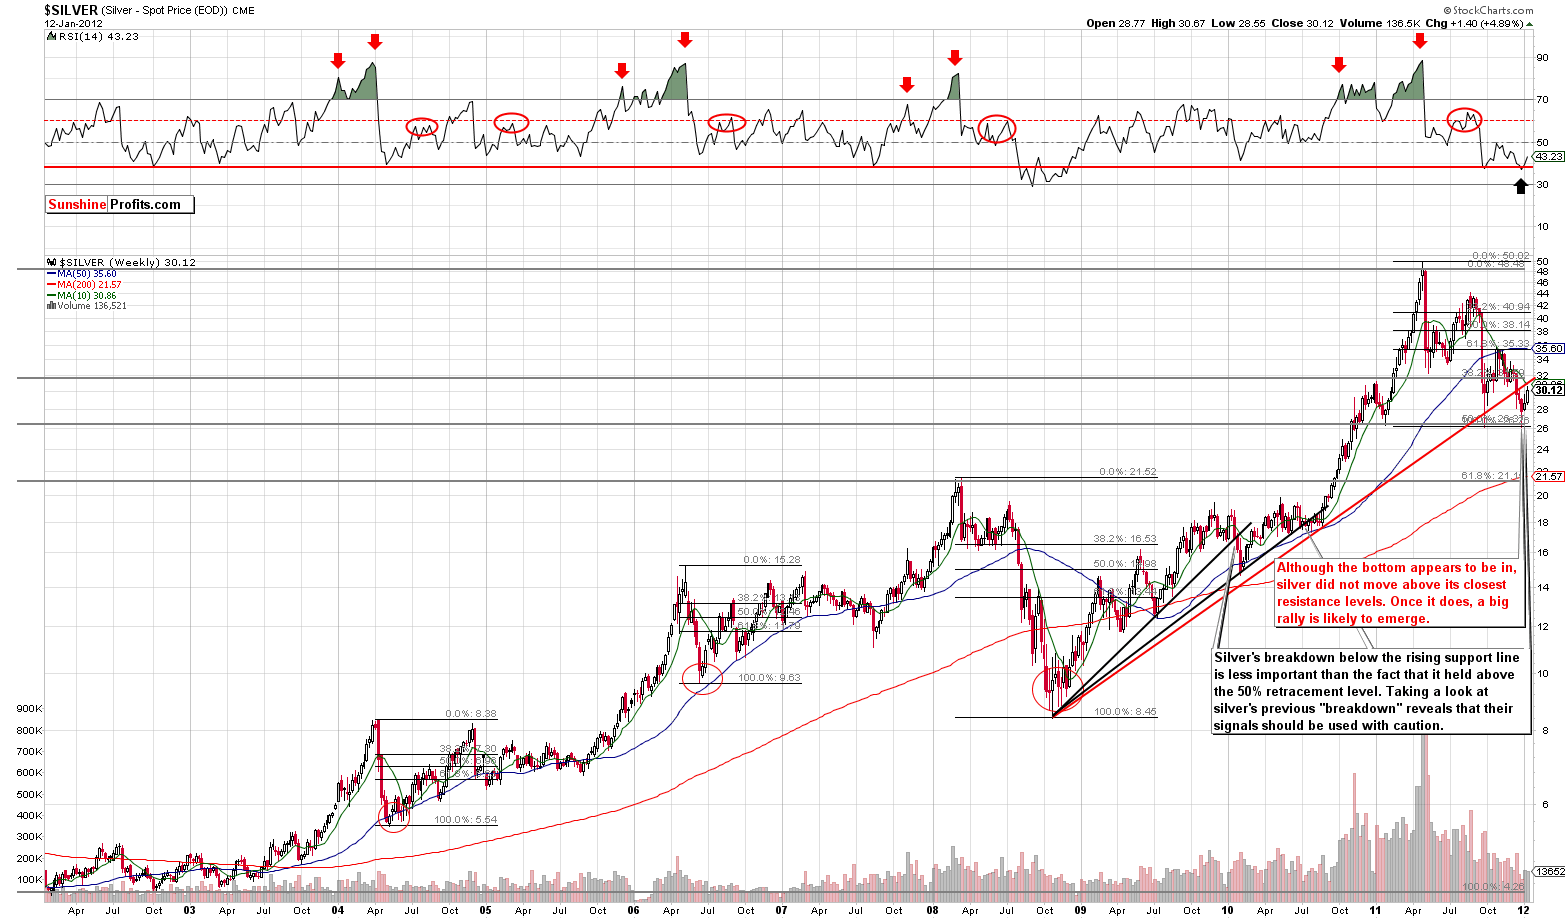
In this week’s second very long-term chart for silver (please click the above chart to enlarge), we see that the bottom appears to be in here as well, and silver’s price is close to a resistance level which is indicated above by the rising red line. This line also coincides with the 10-week moving average (green line). The RSI level also suggests that the bottom is in, but we prefer to see an additional move to the upside – above the resistance levels - before calling the situation more bullish than it is right now. It is bullish anyway, but at this point we see no reason for increasing the size of the long position.
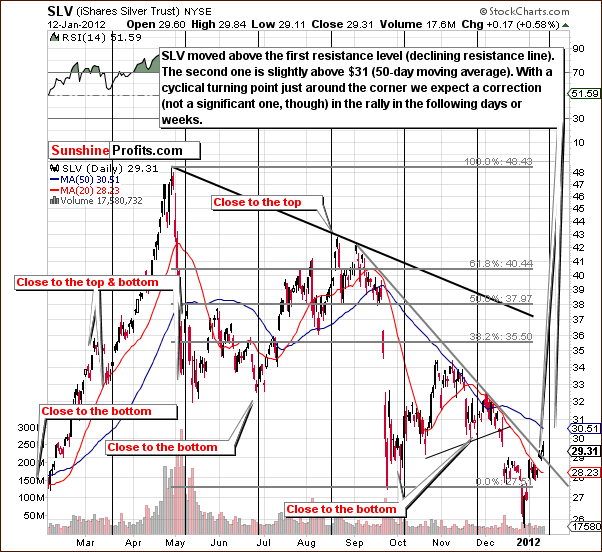
Looking at silver’s short-term chart, it seems that a consolidation is possible here in the next week or so as we are fast approaching a cyclical turning point. One possibility is that we could see a local top followed by a correction, a bottom, and a subsequent rally. It might be similar to what we’ve seen at the end of November 2011, only this time it would be a pause during an upswing.
In short, a pause in the rally is likely close, much the same as we described in our GLD ETF section. Because both the silver and gold short-term charts have similar implications regarding a short pause (however based on different factors), it is more probable that we will see just that.
Summing up, silver’s medium- and long-term outlook is bullish. From the short-term perspective, a consolidation or pause in the rally appears likely within the next week or so.
Gold and Silver Mining Stocks
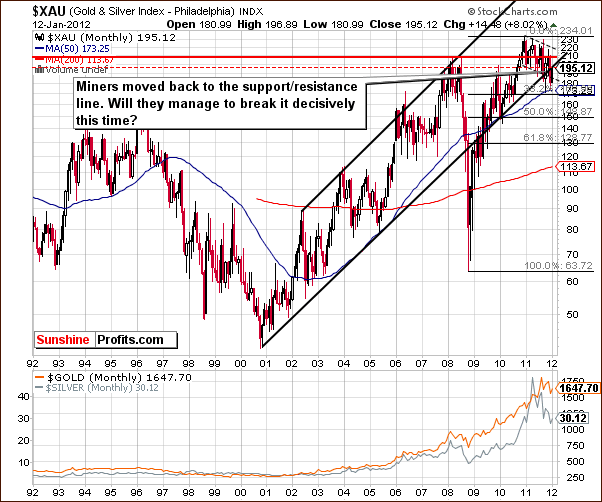
In this week’s very long-term XAU Index chart for gold and silver mining stocks, we see a move back to the long-term rising support line. Thursday’s closing index level is now right at the lower border of the rising trend channel. Because of this, the outlook is no longer bearish although it is not clear whether this resistance line will be broken – the analysis of other charts suggests that it will be the case.
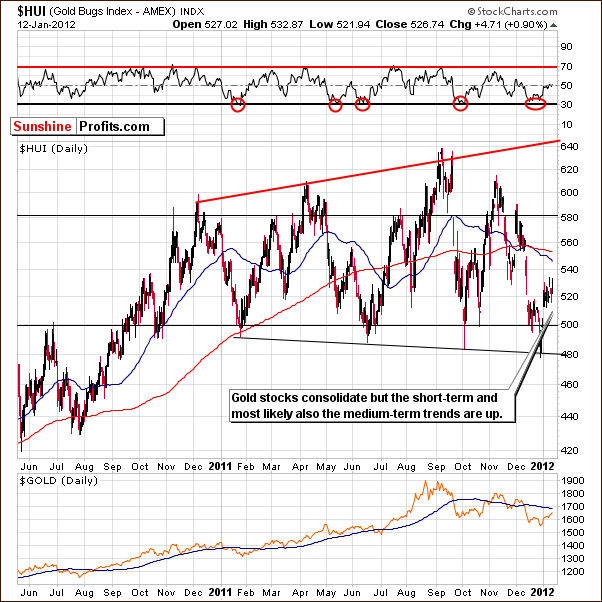
In this week’s long-term HUI Index chart, we see that a clear bottom formed near the end of 2011 and has been followed by a sharp rally and, more recently, some consolidation. This small consolidation period could, in fact, be complete, and gold stocks could rally from here without a pause – thus confirming the analogy between today and mid-2011 seen on the non-USD gold chart.
This rally without a pause would be more likely if gold and silver were to move higher in the coming days. Another possibility is that the HUI Index could correct or consolidate further especially if led by gold and silver. In this case, it still does not seem likely that such a decline would result in the HUI Index moving below the 500 level. In a manner similar to what was seen in late October, any decline will likely be short-lived and therefore not worth betting on.
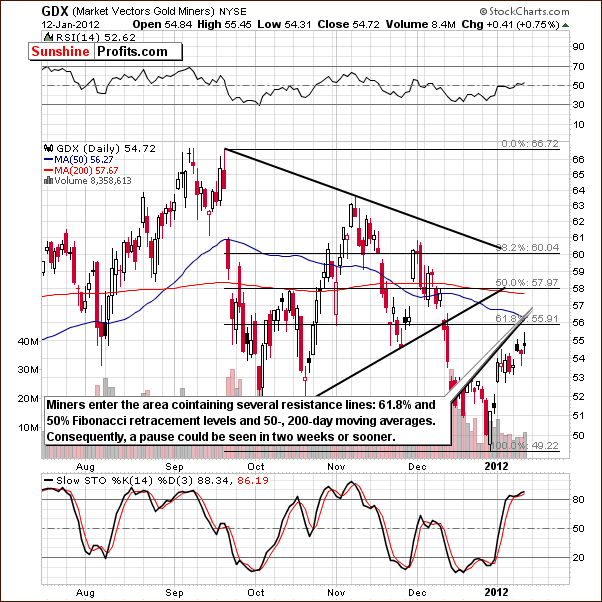
In the short-term GDX chart this week, the mining stocks are about to enter an area of more resistance than seen previously, and a pause is therefore probable. The long-term outlook suggests no pause but the short-term scenario points to this possibility.
Once again, much depends on what happens with gold and silver. None of these pictures provide bearish implications for the week ahead. Any short-term decline should be just that and will likely be followed by additional rally.
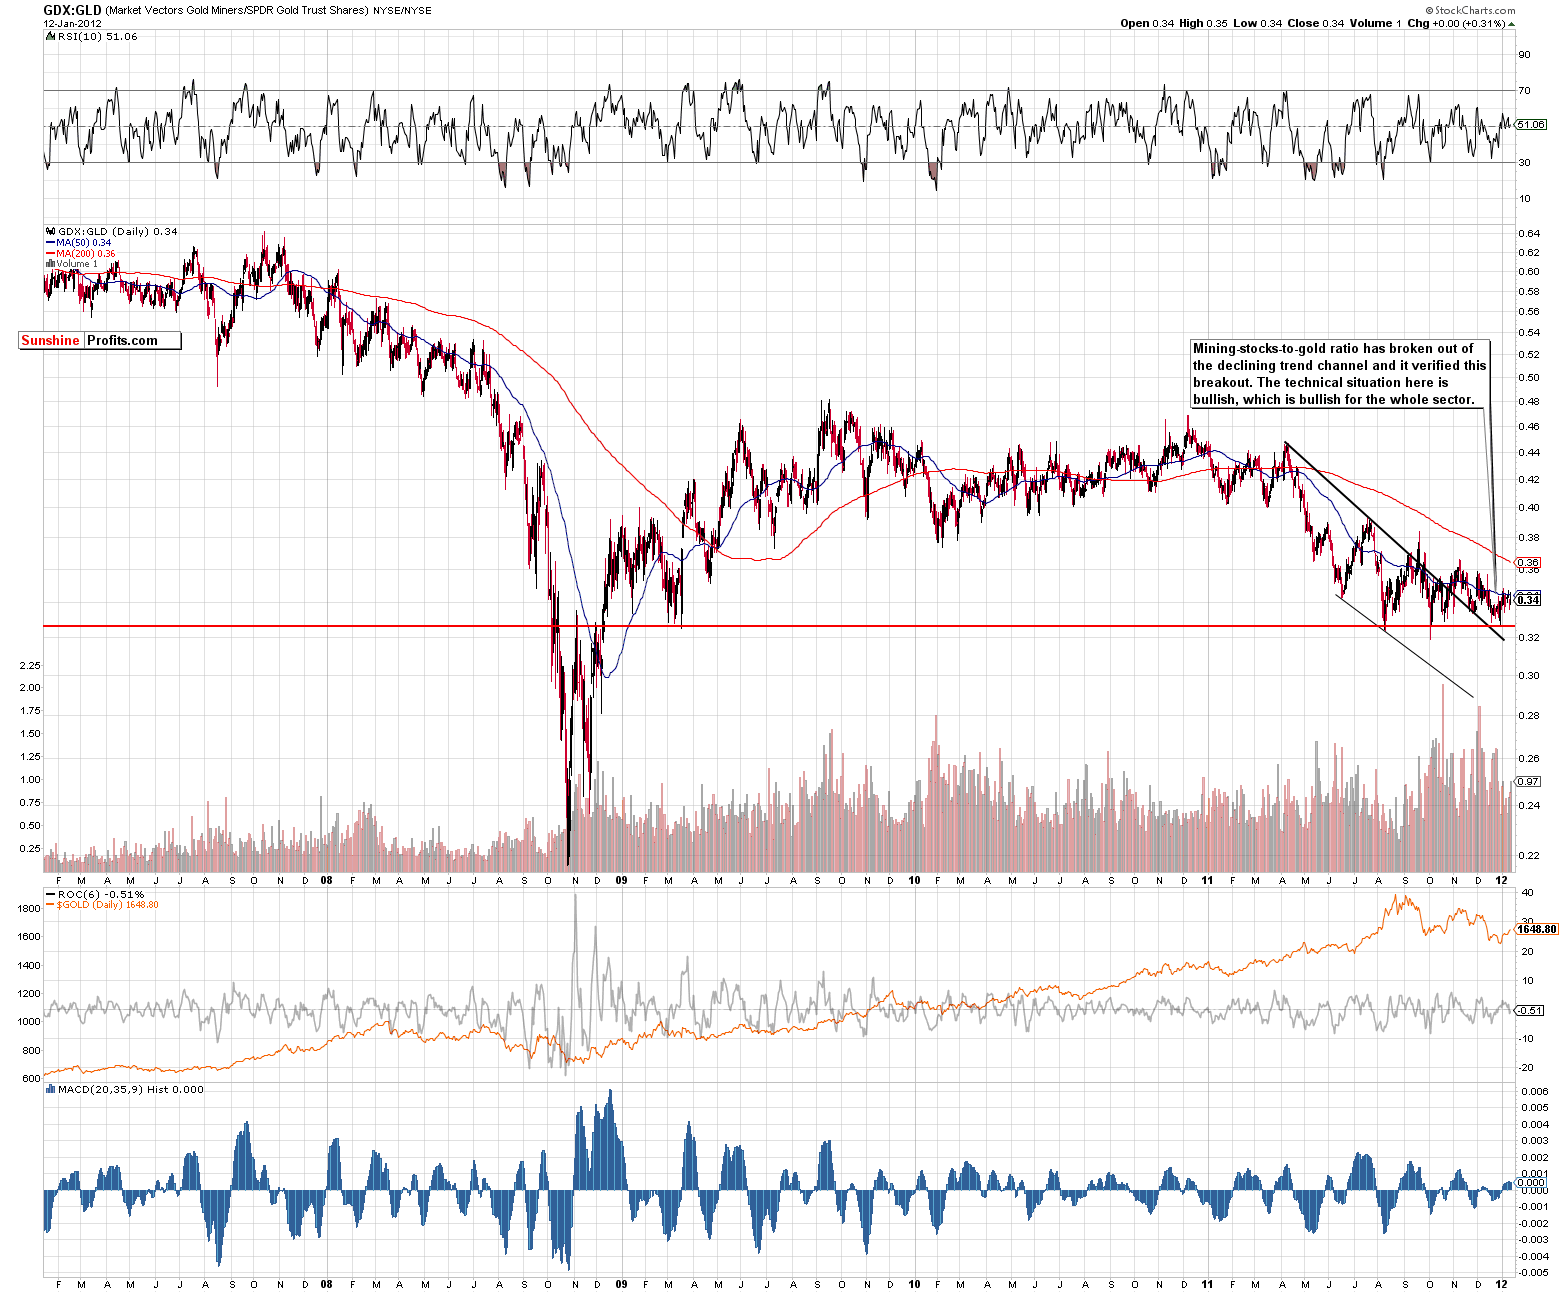
In the miners to gold ratio chart (please click the above chart to enlarge), we saw a move to the downside late in 2011 and a rally to begin 2012. It’s important to note here that the ratio has broken above the declining, medium-term trend channel and verified this move twice. This is a bullish development and gives us bullish medium-term implications for the whole precious metals sector.
Summing up, the long-term and medium-term outlook for gold and silver mining stocks is quite bullish at this point. The outlook is not at all bearish in the short term, but a period of pause in the rally appears probable.
Letters from Subscribers
Q: What is your opinion on this method for gold mining company valuation: start with the number of ounces it has in the ground (a public number accessible to all of us), and simply divide that number into its market cap.
For example, Kinross Gold Corporation (KGC), as of this writing, has a market cap of $18.821 billion, with 62.4 million ounces of gold reserves. By dividing the number of ounces into the market cap, we get a figure of $301.62.
To this total we add the company’s cost to dig each ounce of gold out of the ground. In the case of Kinross, that’s $610. That makes the final figure $911.62 – the cost per ounce of gold you pay for buying Kinross stock. This represents a 49% discount on the current price of gold itself (based on the August 16 close of $1,787.10).
Then you can compare these discounts for other gold miners and buy the most undervalued ones.
A: The described methodology is one of the ways that one can price a company based on its fundamental situation. To be precise, comparing share price to the amount of ounces that this company owns is one of the ways to look at the P/B (price-to-book-value) ratio. While the P/E (price-to-earnings) ratio is the most popular one, there are also other ratios that one can use and P/B is one of them.
There are several disadvantages to this methodology but the most important one is related to the mining sector. Quite simply, not all ounces are equal. Some ounces are "proven" – the company is certain that the ounces are there. Some ounces are "indicated" – the company is not sure the ounces really exist, but it’s highly probable. Finally, some ounces are merely "inferred," meaning that based on some drilling results, there might be more metal in the area – the company tries to guesstimate how many ounces there are and reports that as "inferred ounces."
You can think about it this way: you can have cash on hand (proven), or you can have signed a deal that should provide you with some cash in 12 months, or you can assume that when you complete your PhD studies you will likely get a better job and earn more money than you do now. As you see, these 3 piles of cash are very different and one should not mistake one with another. The same can be said of a company's gold reserves.
The cost of producing one gold ounce from an "inferred ounce" can differ not only between companies but also within a company, based on where these ounces are located and what type of mine is being used (is the mine an "open pit" mine or not?).
There should be no problem with the above-mentioned methodology as long as you are 100% sure that each of the analyzed companies uses exactly the same methodology when describing each ounce and that they all have the same accounting methods. You also need to be 100% sure that there are no accounting shenanigans because that could heavily distort ratios.
If all of the above-mentioned requirements are fulfilled at the same time in all companies, then using the price-to-ounces ratio is ok. Unfortunately, this is not likely, so using price-to-ounces analysis is risky in our view.
Naturally, if numbers were calculated for similar companies with similar resources, operating in similar areas, and the price-to-ounces ratio for one company was several times bigger than the other one, then the outcome of the analysis would be meaningful. However, if companies are different and differences in results are minimal then this method is not very helpful when choosing stocks.
We believe that using the market approach is better than using a variation of the P/B ratio. Measuring how a company's shares respond to the price changes of underlying metals can also say a lot about a company's potential. It is also much less vulnerable to discrepancies between companies' accounting and geological assumptions (not to mention the possibility of manipulation). That's why our interactive stock rankings (leverage calculators in the tools section) use the market approach.
Q: Do you see the current economic picture as deflationary, given the problems around the world, in particular in the EU?
A: In short, we don't. Money supply is rising, and thus the threat of deflation is limited. Whether or not solvency problems in the EU and other parts of the world will lead to financial turmoil is a different matter. Still, we continue to see and hear about inflationary ways to deal with these problems – providing funding, increasing liquidity etc., ultimately leading to more money being created.
The long-term implications (and since we’re discussing fundamentals, we can talk only about long-term moves, as fundamentals don’t drive prices in the short run) for precious metals are bullish as metals will be viewed as a "safe asset" to store money.
One can argue whether the EUR:USD currency exchange rate will move up or down, but what's more important for a precious metals investor is why these moves would take place.
If the EUR:USD falls because nobody wants EUR (problems in Europe) and they buy anything to get out of the currency (including USD), then investors will buy gold as well. However, if people are buying USD because they love it based on some superb fundamental information coming from the US (not because they don't like EUR), then they may sell gold in order to buy more dollars. So, in the long run gold can rise (and likely will) regardless of the situation in the EUR:USD rate.
Please note that at the same time, the correlation coefficients can provide us with a deeper understanding of the short- and medium-term moves.
Summary
The situation in the USD Index is mixed at this time and the impact on precious metals is unclear. The general stock market is in a very similar situation, but it seems that a pause in the current rally will likely coincide with a similar pause in the precious metals market. Based on the ambiguities within the currency and precious metals markets, it seems best to focus on the charts of gold and silver as well as the gold and silver mining charts in order to analyze trading patterns and determine the likely next moves in these markets.
Overall, our analysis this week has bullish implications. Gold is forming a self-similar pattern over the long and medium term and could follow the bullish patterns which were seen in 2006 resulting in a significant rally. It seems that at least an $80 to $100 price rise for the yellow metal will be seen before any meaningful correction. A small pause is expected in the next week or two but this will not invalidate the overall bullish picture.
Silver and the gold and silver mining stocks have an outlook similar to what we have just discussed for gold. Each market will likely see a short pause due to silver’s cyclical turning point and the pending resistance lines slightly above the mining stocks current price levels. Medium-term and long-term outlooks for the precious metals sector overall are clearly bullish and any short-term moves are unlikely to invalidate this sentiment.
This completes this week’s Premium Update. Our next Premium Update is scheduled for Friday, January 20, 2012.
Thank you for using the Premium Service. Have a profitable week and a great weekend!
Przemyslaw Radomski

