Americans just elected a President whose campaign slogan was "Forward." This sounds dangerous given that America is heading toward a "fiscal cliff."
Kidding aside, despite an initial bounce up, gold has so far failed to capitalize on the re-election of Barack Obama, which removed the risk that the Federal Reserve's loose monetary policy program could be halted early. Are we concerned because of that? Not really. That's a fundamental factor that will make gold, silver and mining stocks move higher in the coming months and years. It's not a technical phenomenon that should make metals rally immediately. Therefore, the lack of an immediate post-election rally in precious metals doesn't invalidate the bullish picture at all.
Looking forward to 2013, the gold industry is cautiously optimistic, according to the consensus of bankers, gold traders and investors gathered in Hong Kong for the London Bullion Market Association conference this week. This is the industry's largest annual meeting. According to Bloomberg, more than 700 delegates from 39 countries and 279 different miners, refiners, banks and dealers predicted the price of gold would rise to $1,849 a troy ounce by the time of the next year's conference in September 2013.
That means a 7 percent rise from current prices, less bullish than a year ago when the delegates predicted that gold would be trading at $2,019 an ounce, a prediction made just weeks after gold hit a nominal record of $1,920 in September.
That's exactly how corrections and consolidations work. They cool the excessive enthusiasm and make people (even pros like those mentioned above) hesitate before getting back on the long side of the market. Has the fundamental situation really become worse since last year? No. The momentum weakened but that is actually a good thing for the market because a huge rally is much more likely to be seen after a consolidation and not immediately after a previous major rally. We now have a lot of people who have heard about gold and silver but are not sure if the bull market will continue, so they wait on the sidelines. They will become more certain and enter the market at higher prices, thus further fueling the rally.
This wasn't the case in early August 2011 when gold was rallying strongly (gold moved above $1,725 on August 9, 2011). Sure, everyone was thrilled about gold's sharp upswing, but at the same time there were not too many buyers left. Almost all of those who could have invested in gold had done so by that time. In fact, the buying power dried up in less than 2 weeks – the highest daily closing price was reached on August 22, 2011.
The situation is completely different now. We have seen a lengthy consolidation (over a year) and thus many gold investors are discouraged and tired. Gold is not making headlines in the mainstream media (with occasional exceptions). We even have some pros significantly lowering their price targets even though nothing has really changed as far as fundamentals are concerned (in fact, fundamentals have improved: open-ended QE, Obama's re-election). All of this makes a big rally in precious metals more and more probable. Indeed, this lack of excitement makes us excited.
Let's see if the charts look as favorable as the fundamentals. We will begin our technical analysis with the very long-term US Dollar Index chart (charts courtesy of http://stockcharts.com.)
USD Index

We begin this week with a look at the very long-term USD Index chart. There was basically no change in this perspective and comments made in last week's Premium Update are still up-to-date:
We see that the index moved to the declining resistance line once again. Since this line was reached, the upside direction of the Index will likely change and a move to the downside is probable.
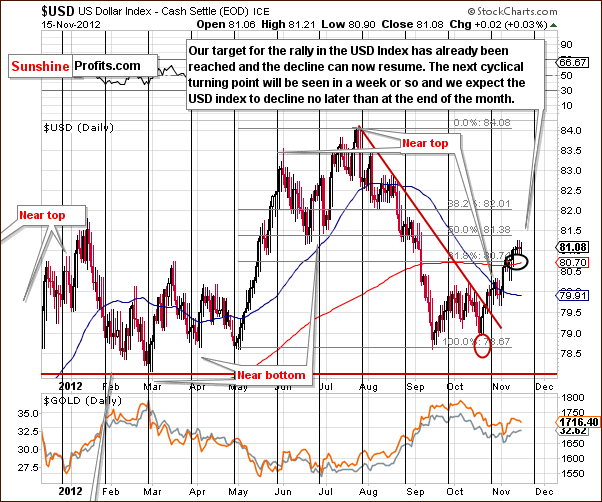
Turning now to the short-term USD Index chart, we see that the index moved slightly above our target area this week but this is not of major concern with the coming rally in precious metals. The trend will remain down even if the USD Index moves to the last Fibonacci retracement level (around 82). With a cyclical turning point fast approaching, the Index is more likely than not to move lower from here from a technical perspective. Fundamentally, we have an open-ended QE in place, Obama in charge, and decisions forthcoming which will likely be bearish for the dollar. Increasing the supply of greenbacks leads to lower USD Index values relative to other assets (in case of tangibles that's inflation and in case of other currencies that means lower USD Index values. That is unless other countries don't inflate their own currencies. However, if that is the case, precious metals will simply move much higher in terms of all currencies, so that's not something to worry about.
Summing up, the situation is slightly more bearish than not in the USD Index. The last few weeks proved that the precious metals were able to rally without lower values for the dollar, so when the USD Index does move lower, the rally in precious metals prices should really accelerate.
General Stock Market
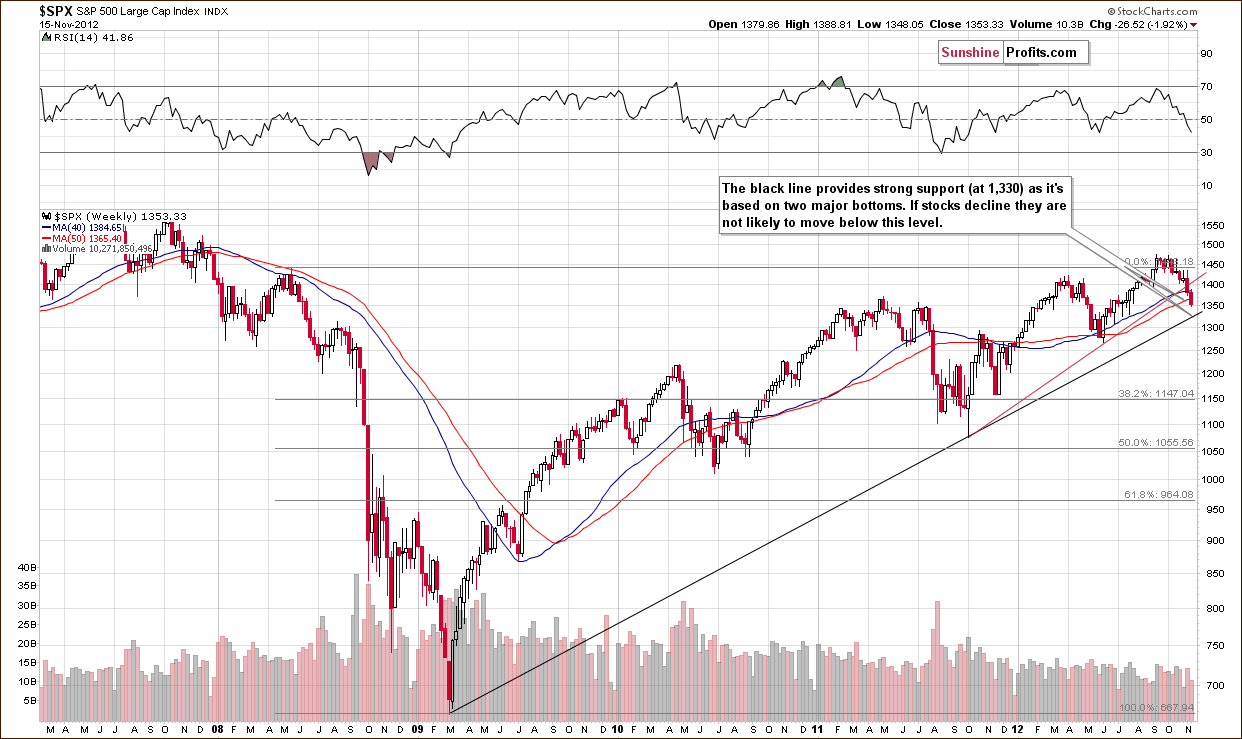
In the long-term S&P 500 Index chart, stocks showed weakness this week. We saw a breakdown below the short-term rising support line and if declines are seen to the $ 1,330 level, this will coincide with the rising long-term support line. This line is quite strong, and we expect it will stop the decline if it is indeed reached since it is based on two major bottoms. Of course, a move to the upside could be seen prior to reaching this support line.
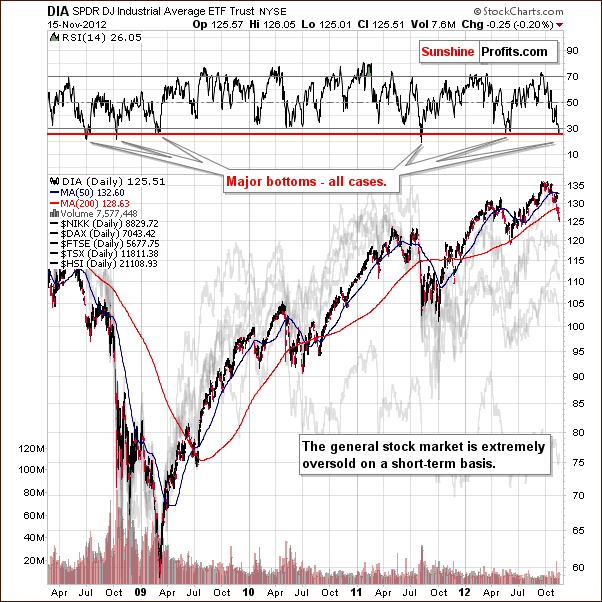
In the short-term DIA (a proxy for the Dow Jones Industrial Average), we see a confirmation of the possibility of higher prices coming soon. The RSI is well below 30, and this has only been seen a few times in recent years. We saw this once in 2011 and twice earlier this year and these generally coincided with major bottoms.
The implications are very bullish. The last time the ETF was so oversold on a short-term basis was at a major bottom of 2011 and prior to that we saw it during the 2008-2009 decline – again at major bottoms. Now, stock prices are much higher, but a similar oversold situation is at hand. We could see prices move a bit lower or rally without additional weakness.
Summing up, stocks appear poised to move higher fairly soon, this move may not be seen immediately. Although, prices could move a bit lower, it seems that most of the decline is already behind us.
Correlation Matrix
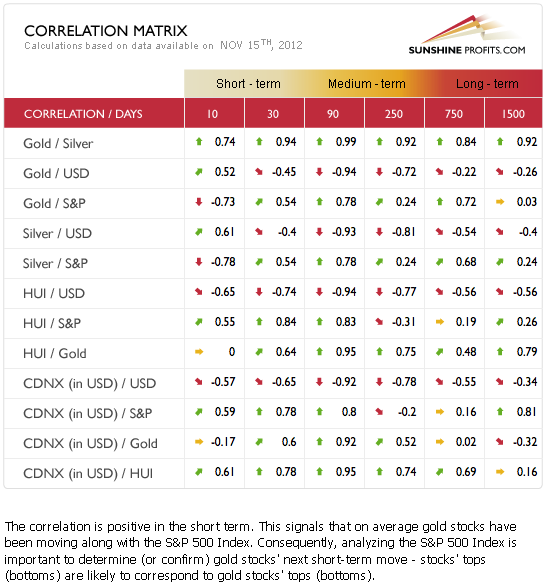
The Correlation Matrix is a tool which we have developed to analyze the impact of the currency markets and the general stock market upon the precious metals sector. All eyes have been on the mining stocks this week as heavy declines were seen, probably ignited to a great extent by weakness in the general stock market.
It is quite common for the strongest sectors to perform poorly at the end of a period of decline after holding up well during most of it. This has been seen in the past and now seems to be the case for precious metals mining stocks. The impact of declining stock prices appears to have been the greatest upon the precious metals mining stocks. They had previously held up quite well indeed.
Silver and gold, on the other hand did not move to lower prices like stocks and in fact are negatively correlated with the general stock market for the last ten trading days. The overall implications of the USD Index are bullish for the whole precious metals sector. The same can be said for the general stock market but since it has not rebounded yet, the situation is a bit more risky for the precious metals mining stocks when compared to silver and gold.
Gold
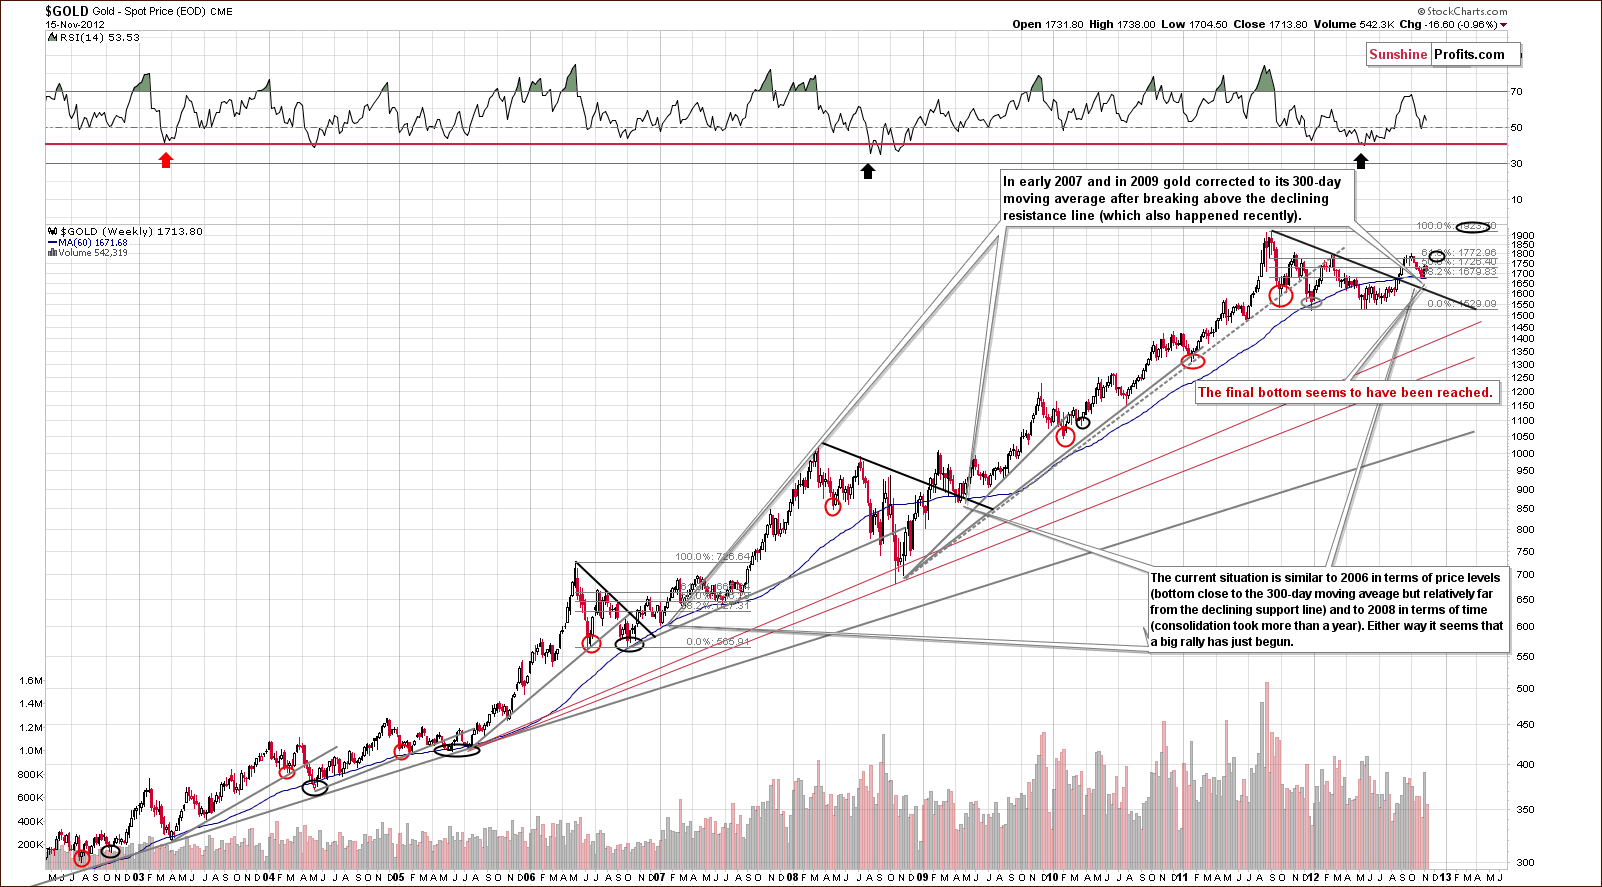
In gold's very long-term chart, nothing has changed this week. Comments made in last week's Premium Update are still accurate:
In gold's very long-term chart, we see that a bottom formed right at the 300-day moving average. This has been seen a number of times in the past, and history has clearly repeated here. Many unusual factors have been in play recently, most notably the open ended Quantitative Easing and European debt crisis and the US elections. This is something that is noteworthy especially if you have begun to doubt technical analysis' usefulness in the current macro-economic environment. Still, history has repeated itself, and technical analysis principles are present. It continues to pay off to follow them.
RSI levels are now moving higher and this – combined with their non-extreme readings – suggests higher gold prices in the following weeks. The yellow metal is not making headlines as it was in early October and this is good news for investors waiting to open positions and those who – like us – are already long. There appears to be clear upside potential given that we have been through a period of consolidation greater than one year and have charts which appear to be very bullish right now. Prices appear ready to move higher, consolidate when reaching the early October highs, again rally to previous 2011 highs, and consolidate once again. We then expect to see further strength.

A look at this week's short term GLD ETF chart, we see that very little has changed. After a sharp move to the upside, prices did not decline back into the declining trend channel. We actually saw a type of A-B-C corrective pattern where prices moved lower, higher then lower again. Thursday's reversal on rather significant volume could mark the end of the consolidation period. The recent zigzag or flag or A-B-C pattern rally will likely be followed by a rally to the October highs. This could very well be seen before the end of November, then a quick consolidation, a breakout to even higher levels and then a bigger consolidation.
Gold moving to $1,706 (the price that we see at the moment of writing these words) does not invalidate the above at all. The consolidation is still small compared to the size of the previous rally.

In this week's chart of gold from the non-USD perspective, the situation has not changed as the cup-and-handle pattern remains in place and the outlook is still very bullish in the medium term.
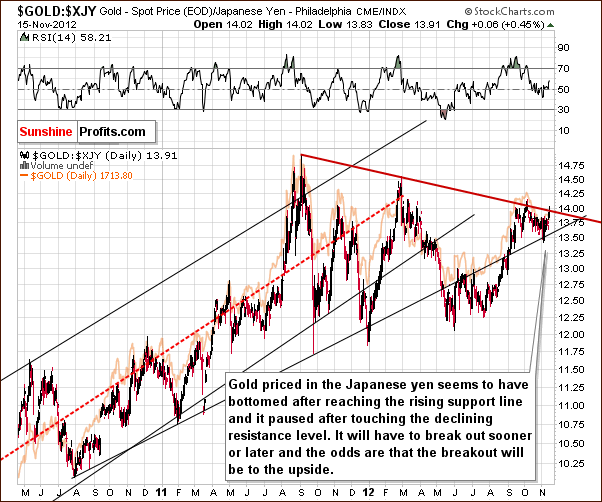
In this week's chart of gold from the Japanese yen perspective, we see a pause in the index after reaching its declining resistance line. It seems likely that a breakout and an acceleration of the rally will follow shortly.

In this week's Dow to gold ratio chart, we see the ratio has moved lower but is still close to the declining support/resistance line. Caution is still advised here as the situation is still risky though the chance of continued weakness in gold appears quite small at this time. In short, the situation improved this week.

In the gold to bonds ratio chart, little has changed this week and the situation continues to look bullish here. It seems that the bottom has been reached and higher values for the ratio and gold appear to be in the cards.
Summing up, a small consolidation has been seen in the gold market this week, which is something normal after a sharp rally – and such a rally was seen earlier this month. Our analysis indicates that gold prices are probably headed back to the level of the October highs from here and then – after a consolidation - even higher, likely to the $1,900 level.
Silver
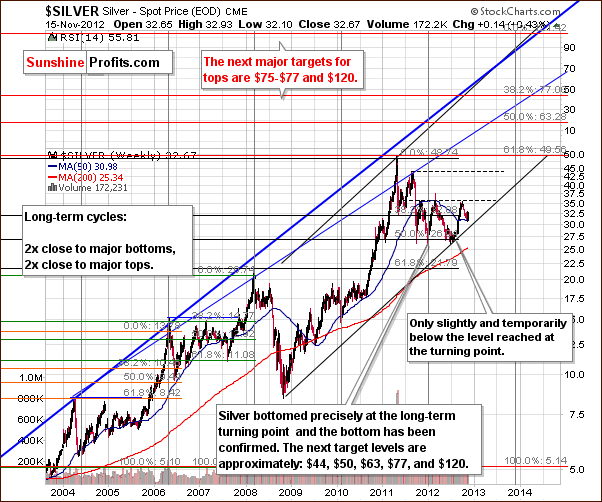
We begin our silver section with the very long-term chart and some long-term price projections this week. We also received a question this week about silver's likely future price moves from a subscriber which will be addressed in our Letters from Subscribers section. This chart provides justification to the target levels that we mentioned there.
The first target level is the October high, and it seems that silver is likely to rally and moved towards this now. After this price level is taken out, $44 level becomes probable. We then see a period of consolidation followed by additional moves to the upside, say to $50.
Another consolidation could then be followed by a breaching of previous highs, but the timing here is uncertain. While it seems probable that this will take place next year, it could be as late as the fourth quarter. Beyond that, target levels of $63 or even $75 to $77 seem within reach (for 2013 that is). In our view, it's not a question of if but rather when silver's price will be in these target ranges.
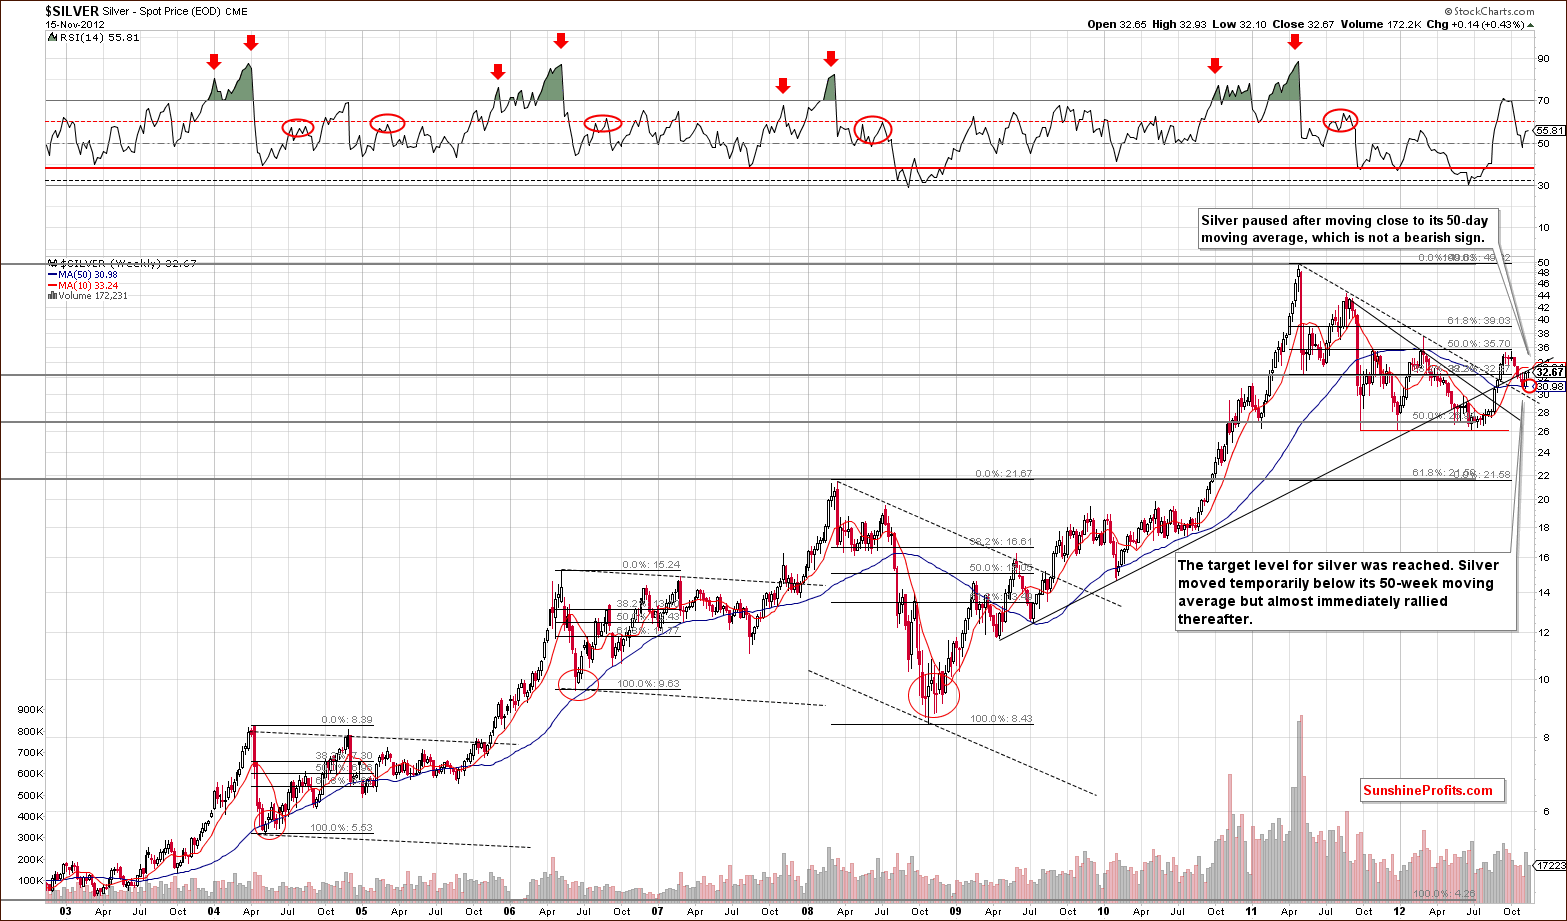
In the long-term silver chart this week, we note a pause in the rally, but this is not at all unusual. Prices reached the previously broken support line, have paused to gather strength, and will probably next move above it. It seems that this will be seen sooner rather than later.

In the chart of silver's price from a non-USD perspective, barely any correction was seen this week. The local bottom is clearly visible, the breakout confirmed, and the implications bullish.
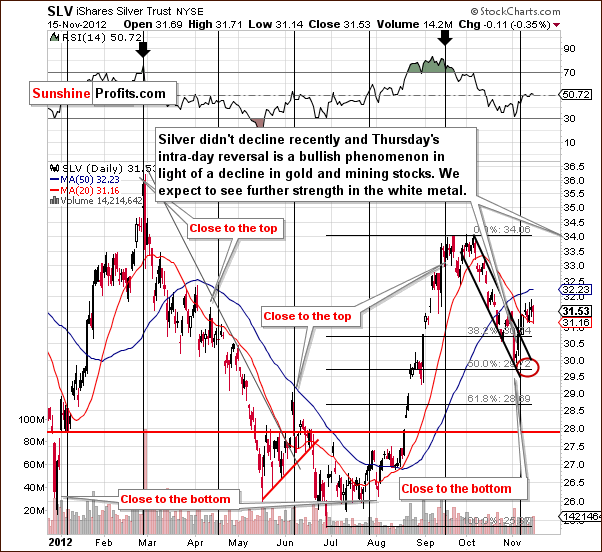
In the short-term SLV ETF chart, we saw no decline in silver's price, just a short term, horizontal consolidation pattern. This verifies the move back above the 20-day moving average. Thursday's price decline and intraday reversal are signs of strength for the white metal.
Summing up, the overall situation looks bullish for silver. Analysis of numerous charts indicates that the rally is likely to continue from here. The next target is the October high: $34 in case of the SLV ETF and $35 in case of silver.
Platinum & Palladium

In the short-term platinum price chart this week, we see that prices have broken above the declining resistance line. This was discussed in Thursday's Market Alert. We have now seen three consecutive closings followed by a move back to this line, which was immediately followed by a pullback. At this time, the breakout has been confirmed and higher prices should now be expected.
At the moment of writing these words, the price of platinum moved lower, to $1,545, however this is not something that we are concerned about right now because the breakout was already verified. The situation still remains bullish.
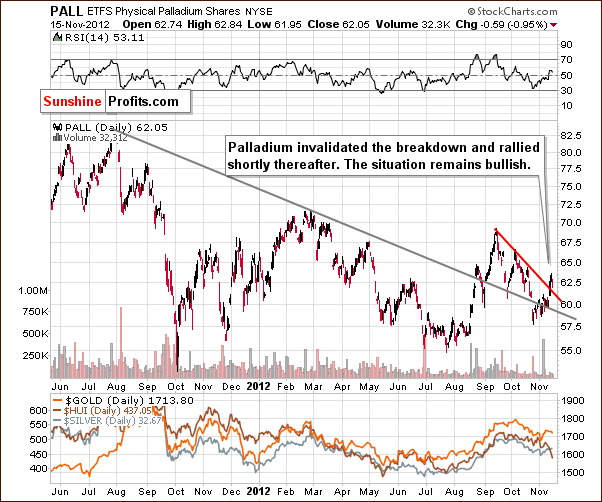
In this week's chart for palladium, the same can be said. Prices not only moved back above the declining long-term resistance line but also moved above the short-term declining resistance line. Therefore, the short-term implications are also bullish here.
Summing up, the platinum group metals suggest higher prices across the precious metals sector.
Gold & Silver Mining Stocks
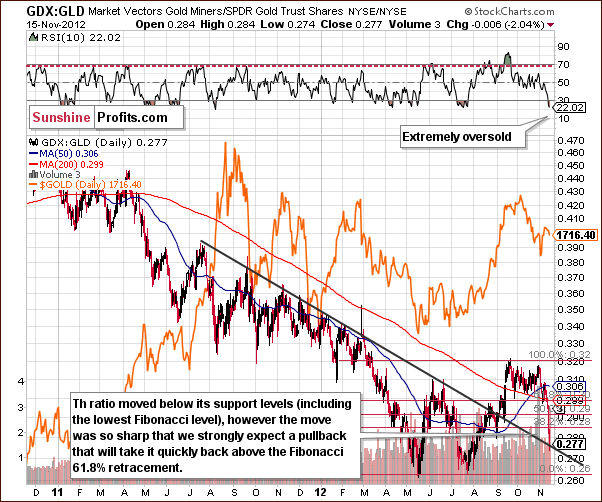
In the miners to gold ratio chart, we see that the ratio plunged this week. This is seen every few months and is almost always followed by an immediate reversal in prices and a major bottom. This can be seen in August 2011, October, 2011 and January, 2012. Very sharp declines are followed by strong rallies, and this is also seen in early July 2012. This was actually the final buy opportunity before a strong rally emerged in gold prices. At that time, the RSI was extremely oversold, and this is the case today as well. Although it may be difficult to believe, the situation is still bullish in this chart.
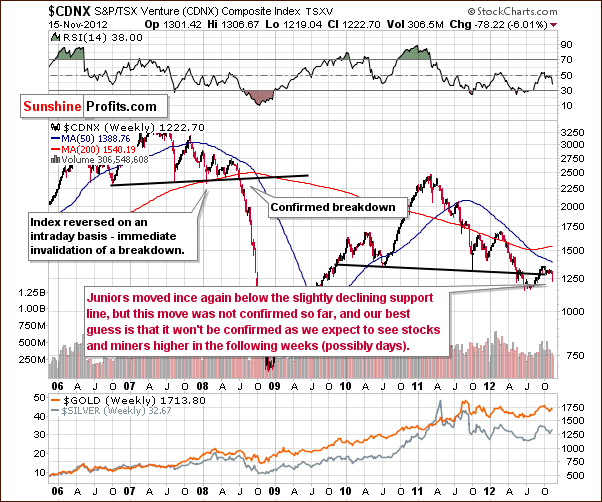
In the Toronto Stock Exchange Venture Index (which is a proxy for the junior miners as so many of them are included in it), we see a move below the horizontal support line. This move was sharp, sudden and has not been confirmed. We expect to see an invalidation of the move in the coming week. Since this breakdown was not confirmed, the situation has become only slightly more bearish this week. Not much weight is placed on this signal given the situation in the rest of the precious metals sector.
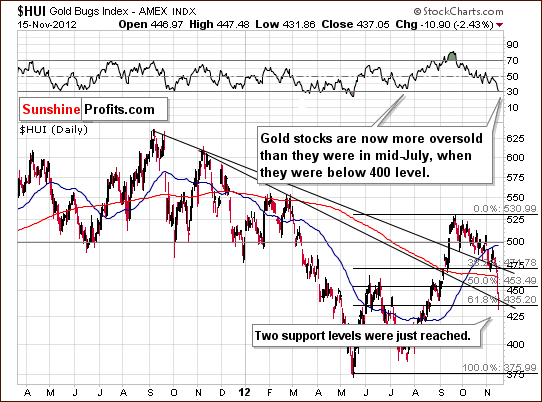
In this week's medium-term HUI Index chart, we see that the index has moved to a combination of support levels. The plunge was dramatic and took the RSI to 30. This had not been seen since the final 2012 decline bottom. Prior to this, it had only been seen a few times. With the situation extremely oversold from a technical perspective, a sharp pullback is likely here.
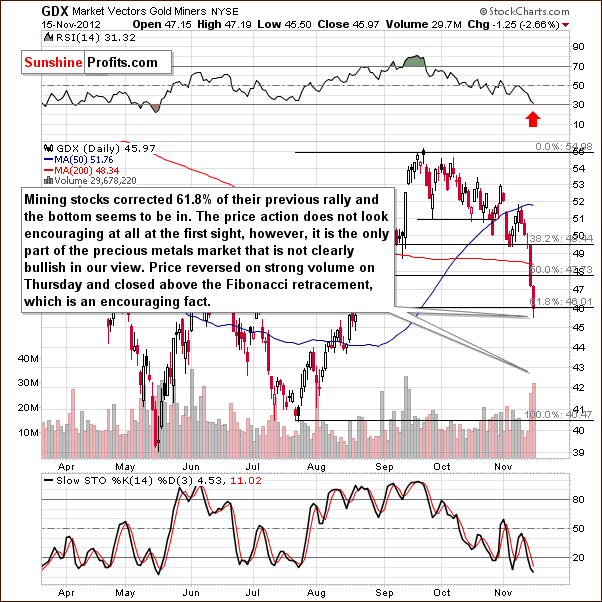
In the GDX ETF short-term chart, we also see the RSI at a buy level. The correction took the ETF to the lowest Fibonacci retracement level. A small reversal was seen on Thursday with huge volume so this is a bullish development and the decline may or may not be over. If not, the bottom is probably close given the many other bullish phenomena present in the precious metals sector and given the oversold technical situation in miners and the general stock market.
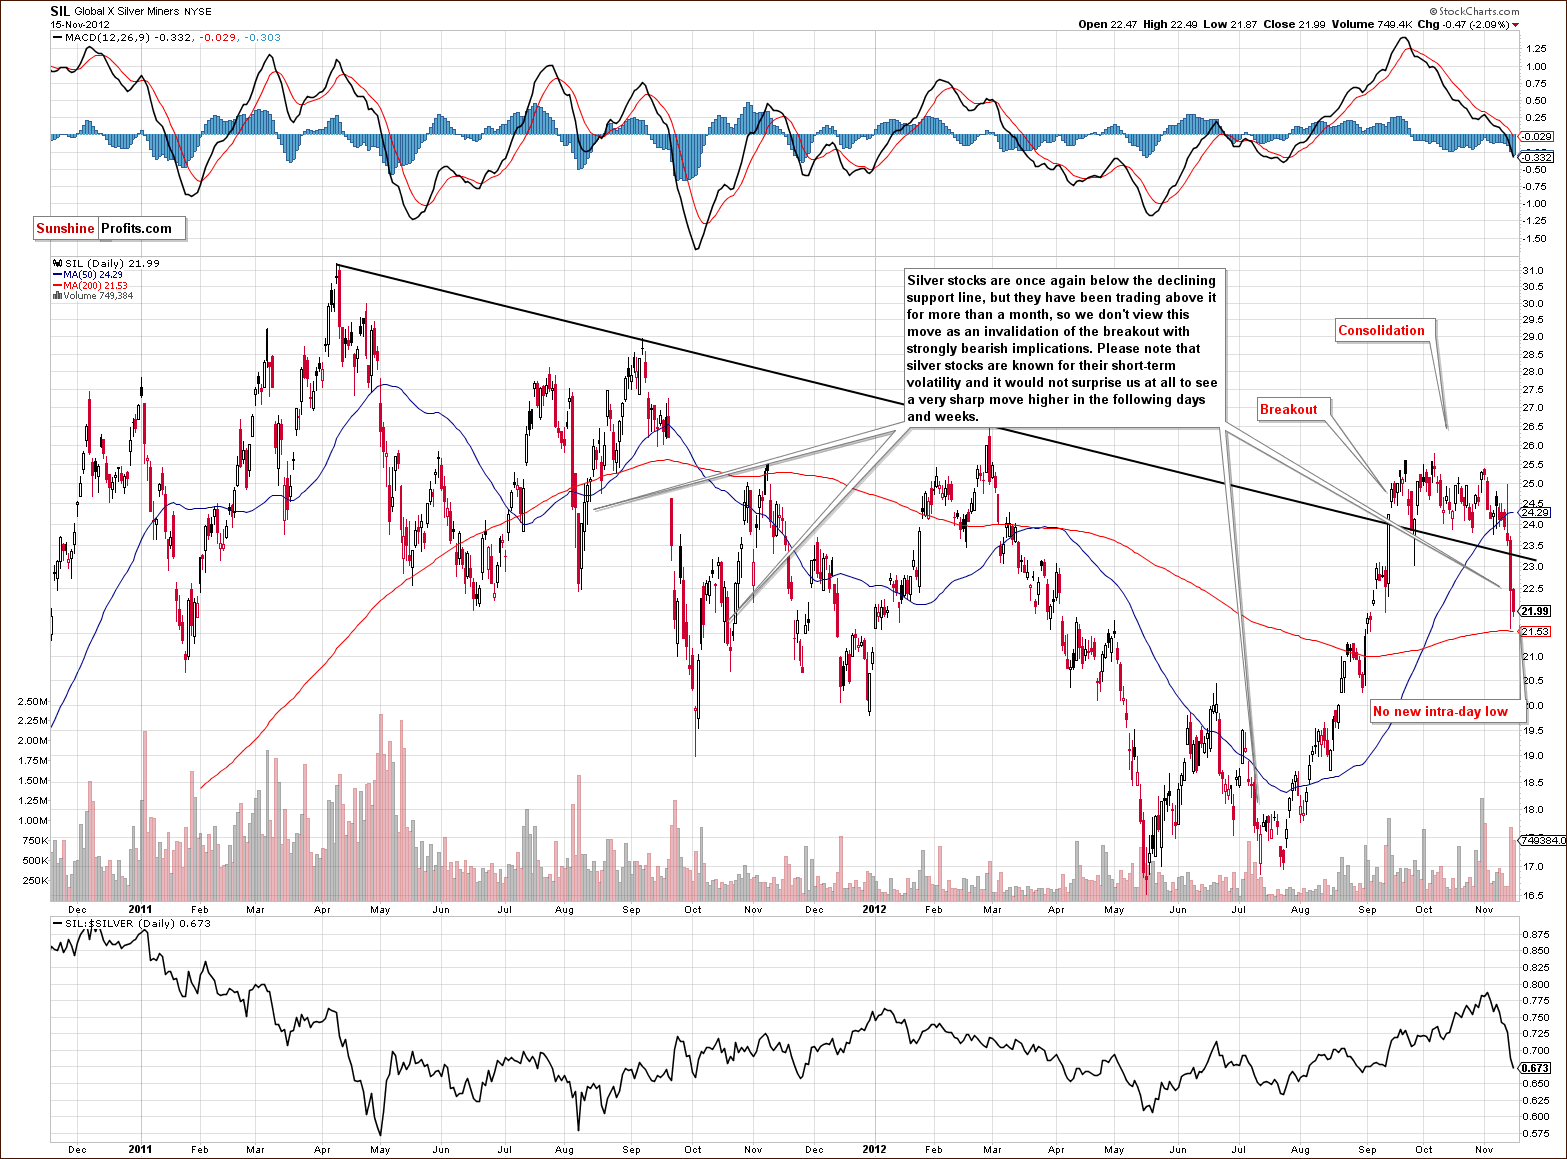
This week we again include the long-term Global X Silver Miners chart. Silver stocks have held their prices well for the past couple of months, but prices plunged in the last two days on significant volume. Since prices were above the declining resistance line for two months and the move lower was so sharp, it is probably temporary given the volatile history of silver stocks. A pullback is probable, which could take the silver bears by surprise. New intra-day low was not made on Thursday, which is a bullish sign.

In the Gold Miners Bullish Percent Index chart, we had a buy signal from this chart last week. Once again, it signals that we are close to the bottom; remember that it is not an exact tool. Still, past performance makes us believe we are at the bottom or very close to it now.
Summing up, the decline seen in the mining stocks was very dramatic. This was virtually the only part of the sector that looked so bearish. Miners can be quite volatile on a short-term basis and we expect to see similar volatility when the rally resumes.
This week's declines are an excellent example of a need for diversification in trading, even though the precious metals sector is closely correlated in most cases. We recently suggested buying gold, silver and mining stocks when gold was at its 300-day moving average. Gold and silver positions are now profitable and mining stocks ones are not due to this week's decline.
Please keep this in mind for future trades: remember that using signals from various sources can protect you from most of the anomalies of this kind. Yes, we believe that this week's action in mining stocks should be called an anomaly. Although the miners follow stocks (in case you believe this decline could have been predicted by looking at stocks' decline), please note that so does silver in many cases due to its multiple industrial uses. This week, we saw declines in the miners along with stocks but not in silver prices. In the last few days, the miners declined heavily and silver not at all. While we can't be prepared for each single outcome because there are too many of them, you can really limit the risk and your exposure to such anomalies through diversification. One way to follow this principle is to take positions in many parts of the precious metals market, another one is to diversify between strategies and there's also one that is based on diversifying sources of signals. You can read more about all of them in our report on gold and silver portfolio structuring.
Sunshine Profits Indicators


Two of our indicators have just flashed buy signals: Short Term Gold Stock Bottom Indicator and the SP Gold Stock Extreme #2 Indicator. According to our research on signals' performance the latter signal is a buying opportunity for gold, silver and mining stocks. The Short Term Gold Stock Bottom Indicator further confirms the bullish case.
Consequently, the part of your trading capital dedicated to the SP Indicators (as a source of signals), should be on the long side of the precious metals market now. It seems likely to pay off in two weeks' time unless we see another buy signal that will prolong the time of the trade.
Letters from Subscribers
Q: When gold broke above its 1980 all-time high it quickly accelerated towards new, higher highs, whereas silver is still below its all-time nominal high. When silver breaks above its April 2011 high, is it reasonable to expect it to soar towards $75?
Also, when do you think we will take out the all-time silver high? We were a few cents away 1 year and 7 months ago. Thanks.
A: Yes, $75 (or $77) is a very good target and one that could be reached in 2013 (in all likelihood - 80% or so - it will be reached no later than in 2014 in our view). There is one more important stop between this level and the 1980 high: $63. We are providing the very long-term silver chart this week to better illustrate.
Q: Could you please give more detail on this: "The buy signal from the SP Extreme #2 indicator means entering a long position in the case of gold, silver and mining stocks with a 2-week trade in mind." My understanding of this is that a long position bought today, Nov 15th, should be sold Nov 29th, regardless of future indicators. If so, could you please include the opening and closing of speculative long positions based on the two week trade in your Market Alerts? Please elaborate. Thank you.
A: A long position bought today, Nov 15th, should be sold Nov 29th unless we see another signal from one of the SP Indicators. It's quite likely that we will see at least one of them because the SP Extreme #2 indicator is still below its signal lines and when it moves higher it will flash a buy signal once again. Consequently, the suggested holding period will most likely be increased in the coming days.
Please note that this refers to the half of the speculative capital that is based on our indicators (objective signals). The other half is based on your editor's analysis (subjective signals). You will find details in our report on gold & silver portfolio structure.
Q: When approximately do you see the October high and the 2011 high being reached, before the New Year, or sometime later? I see no reason to think a major rally is to start in gold. The $1,900 price target is for what date?
A: Well, most of this update (and the same can be said about previous updates) is dedicated to providing the explanations behind our bullish views on gold and the rest of the precious metals market. We'll be happy to discuss the reasons for which you believe they are not important.
We think that $1,900 in gold will be reached in the first half of 2013.
The October 2011 high might be reached this month but we think there's a really good possibility (75%) that it will be reached no later than in December, 2012.
Q: If we fall off the fiscal cliff won't this be bearish initially for all risk assets including precious metals and mining stocks?
A: The truth is that nobody can tell for sure. On one hand you are correct. On the other hand, gold and silver don't have to act like risk assets. In fact, they - especially gold - are known to be hedges against any type of turmoil, like military conflicts. Either of these "reputations" can prevail. However, we don't think that this need be the case. Here's what we wrote about the fiscal cliff last week (it's up-to-date):
Let's see if we can guess what's going to happen: until the very last minute everyone will be fighting over the deal and then a consensus will be reached that will mean more money being created. Our initial thought is that precious metals will rally with the uncertainty regarding the fiscal cliff, and then they will correct (say, 38.2% of the rally will be seen by that time) on the news that more money will indeed be provided for free (i.e. taken by inflationary force from current USD holders). In other words, it could very well be a buy the rumor, sell the fact type of reaction - just like what we saw after the open-ended QE was announced.
So far the "fighting" part is underway.
Q: I think mining stocks will continue to sell off with the general market. The only thing that would reverse that would be some kind of agreement on the on the fiscal cliff. I just listened to the Republican response to the President's speech today and it doesn't sound an agreement is close. At some point I even think gold and silver will sell off like everything else on general risk aversion.
YOU CAN'T OWN MINING STOCKS WHEN THE OVERALL MARKET IS GOING DOWN!
A: We think that the politicians will make it look like that agreement is unreachable until the very last minute - and then they will reach it. We already quoted our comments from last week on that matter and they are applicable in this case as well.
Those who owned miners between 2001 and 2003 and the last quarter of 2008 will not confirm your statement about mining stocks and the general stock market. In both periods strong rallies were seen in miners despite significant declines in other stocks.
We think that the stock market will bottom soon or has already bottomed.
Q: What is your view on Bullionvault vs. GoldMoney as a platform to buy physical gold? What is your take on the allegation of JPMorgan's manipulation of the price of silver with a gigantic short position for around 4 years? Thanks.
A: As both platforms offer coverage in physical metal, we think that both can be good vehicles to buy gold as a long-term investment. Unlike with most ETFs, Bullionvault and GoldMoney (our affiliate link: http://www.goldmoney.com/?gmrefcode=sunshine) maintain a 1:1 ratio of physical metals to customer holdings. Bullionvault (our affiliate link: http://www.goldmoney.com/?gmrefcode=sunshine) is also interesting because it offers you the possibility to store your metal in the U.S., U.K. and Switzerland, which is consistent with our views on geographical diversification of gold and silver holdings. You can learn more about electronic forms of gold ownership in our section.
The issue of whether JPMorgan manipulates the silver market is not a new one. According to the Financial Times, the Commodity Futures Trading Commission was looking into “complaints of misconduct in the silver market” as far back as 2004. That enquiry, as well as a subsequent one in 2008, did not find JPMorgan guilty of unlawful practices involving price manipulation in the silver market. Individual silver traders have been raising complaints about alleged price manipulation for years.
The problem with those claims is that the CFTC did not find enough substance in them, even though it was revealed by the same commission that in 2010 “42 per cent of the net short position in silver was held by four or fewer traders.” Detailed accusations were made in 2010 by Andrew Maguire, a former Goldman Sachs trader who went on to claim that JPMorgan was actually shielded from substantial losses by the Fed. Maguire was shortly thereafter injured in a hit-and-run car accident.
Despite a prior lawsuit accusing JPMorgan and HSBC of jointly controlling “over 85 percent of commercial net short positions”, a position inherited mainly from the liquidated Bear Stearns business, the CFTC seems inclined to drop any case it has against JPMorgan, making this the third case in a row that has not found proof of wrongdoing.
A short word on the structure of the alleged short-selling scheme is needed at this point. Silver traders and market pundits have made a case that the concentration of short positions among the biggest market players may allow them to suppress the price of silver. This practice would be called “naked short-selling” since huge institutions, being market makers, do not have to meet margin calls while maintaining open positions. This would allow them to place considerable short orders without having to cover them in the foreseeable future. These shorts would put a cap on the price of silver since they would artificially increase the supply of electronic/ paper silver.
Our comment here would be that regardless of whether silver is deliberately manipulated on a regular basis, it has been able to appreciate strongly in recent years. Because of that, it does not seem possible for potential manipulators to suppress the price of the white metal forever. Going further, if the scrutiny from the CFTC or other external factors forced naked shorts to be covered and big players had to unwind their shorts even partially, this could result in strengthened buying power which could, in turn, elevate prices to new highs.
To close this comment, we would like to remind you that during the development of one of our proprietary tools called “True Seasonals” (to be available for you in the near future) we discovered that the prices of metals tend to decrease around expiration dates of gold and silver derivatives. Because of that, our suggestion is to pay special attention to the gold and silver markets at the end of each month. If any manipulation takes place, the end of the month is the time to be particularly observant.
Q: I appreciate your earlier email and plan on subscribing to your market letter for 1 month and then will go from there.
Because I'm so ultra bullish on precious metal stocks for at least another month, I've decided to go whole hog on the following out of the money options that all expire on Dec. 22, 2012:
ABX 19 options - $37 call
NEM 15 options - $50 call
NGD 10 options - $11 call
If I'm wrong, then I just blew $5k!
Needless to say, I already used your service yesterday to change my previous out of the money options on AEM & HL to ABX & NEM!
A: I'm very happy to hear that you like our service. Please keep in mind that the size of the speculative position should be small relative to the value of one's total precious metals portfolio, especially if the position is heavily leveraged (which is the case with short-term options). Not losing capital is ultimately more important than gaining it, so be sure not to overdo your trading even if the situation is as bullish as it is right now (and we agree that the case for metals looks very favorable). Years of experience simply suggest caution regardless of how great the situation might look. You will find more information on trade size in the Portfolio Structuring report (click on the pictures at the bottom of the essay) and you will find an in-depth discussion of the reasoning behind relatively small trade size in "The Universal Investor" report.
Q&A (the following is one reply that is divided into several parts):
Q: I see your point [Editor's note: that it made sense to close a previously opened long position because the probability of a decline in the short-term was greater than the probability of a rally.Since a small loss was better than a big loss, we suggested getting out of the long position in miners. Please note that this question was asked a few weeks ago after we suggested getting out of the short position in miners but we didn’t suggest going long – but the person who asked the question went long miners anyway.] Let me rephrase the question: if I am confident enough that I need to take a loss in the face of more impending declines, why am I not confident enough to hold short in anticipation of the same?
A: Because there is also the "neutral territory" where no position is suggested. This exists because of the asymmetric relationship of gains and losses to your portfolio. The problem with a 50% loss is that a 50% gain is not enough to come out even. You'll need a 100% gain for that. Here's a quick example: A 50% loss followed by a 50% gain would give you 0.5*1.5=0.75, meaning 75% of your starting capital, meaning a total loss of 25%.
Therefore, not losing is more important than winning. It's not symmetrical. Consequently, the focus is not on winning but on not losing. Furthermore, the threshold for not losing should be higher than for winning. So, first of all, you don't want to lose on either a long position or a short position. When you exit a long position because you don't want to lose when the price moves lower, that doesn't automatically mean that you are confident enough that you want to risk losing on a short position. It may or may not be the case depending on the certainty and predicted size of the move, but it is not a sure bet.
In the abovementioned situation the point was to exit the position in order to minimize losses.
Q: I see the point about looking at each trade individually, but allowme to present you with a different real-world scenario: I will call my stock 'GOLD' and assume it behaves like GDX, but moves about 50 cents for every $1 move in GDX. Consider, please, the following situation: My BUY price is $34.50, which nets me a total of 9,155 shares. GOLD falls to $33.77. If I exit here, I incur a loss of $6,774, or, let us say, about 200 shares of GOLD…
A: We respectfully disagree. If GOLD falls to $33.77 then you have already incurred a loss. Your accountant may disagree, but this is how we view it and how you should view it (an explanation is below). Exiting the position changes your exposure, but not the loss. If you sold and bought back in a second (assuming the price didn't move and you were able to do so without a commission), would it change anything? Nothing at all. So just because you didn't exit the position doesn't mean that you don't have a loss.
Before we wrote the final version of the reply to this question we made a few earlier attempts but they were all unclear - that is until we realized that we should start with the definition of a loss. There are several ways to look at a loss and each has different implications for your money management. Even in terms of accounting, there's more than one way to look at losses and gains. Depending on the nature of the investment, unrealized (a.k.a. "paper") losses and gains may or may not be visible on companies' income statements (and they may or may not have tax consequences).
From a psychological point of view, the situation is even more complicated, because investors and traders will tend to do whatever it takes not to admit that they have a loss because they will (incorrectly) always associate a loss with their own personal failure. (The correct action is to realize that losses are inevitable and an inherent part of the investment/ trading process. But that is not intuitive, which makes it so difficult to apply in practice.)
Since people don't want to view themselves as those who have made bad decisions, they will "frame" the current situation so that it doesn't look like a failure.The human brain is creative and can come up with many excuses to protect an investor's self-esteem. The 2 most popular ways the brain does this is by blaming others (manipulation of the market?) and by looking at a losing position in a way that doesn't make it look like a losing one ("I didn't close the position so there's no loss"). The subject is tricky because manipulations can really occur and in accounting terms this definition of a loss (“no loss as long as a position is open”) can be correct.
So, what is a loss and what is not a loss? What definition should we use? Usually the best way to deal with any complicated matter is to go back to the basics and start the thought process from there. Why are we investing/ trading in the first place? In order to either make money or to protect what we already own. The practical definition of a loss that will help us achieve this goal will therefore be the correct one. Whether you are trading or investing, ultimately your brokerage account (or your personal notes) will simply show a series of transactions. You can refer to a few of them as "elections trading" or "looking for the major bottom trading" etc., but ultimately each of them will separately contribute to your overall profitability.
Does psychological grouping make any of them special, relative to the ultimate profitability or size of the portfolio? No. Does the associated happiness (after cashing in profits), fear (of losing a trade), or sadness (after taking a loss) affect long-term profitability? No, at least not directly. The only thing the portfolio size "understands" is the sum of outcomes of previous transactions. The outcome does not depend on the number of losing trades or the number of winning trades. Was there a series of small losses following a big profit? Or was there a series of small gains followed by one single loss? It doesn't matter as long as the final outcome is the same. Emotionally, investors and traders would much prefer the series of profits and one big loss than the other way around because they would have to deal with the pain of dealing with a "failure" just once, and they would feel happy many times.
Why is following this intuitive approach bad? In order to minimize the number of losses, investors/ traders will tend to close winning positions too soon (being afraid that winning trades will turn into losing ones, whose number they want to minimize), and they will tend to keep losing positions open too long in the hopes that these positions will eventually become profitable. This is exactly the opposite of what traders should aim for - small losses and big profits. Precious metals investors should be ok with the latter because gold and silver are in a secular bull market. However, “ok” doesn't mean making the most of it. If metals are likely to move lower, then by exiting a long position (regardless of its profitability or lack thereof) and reentering it at lower prices, one would increase their rate of return even though this could mean having one losing trade and one winning trade instead of simply one winning trade.
The goal of investing is not to avoid losses, but to make the most money possible in the long run (this by itself implies proper risk management). In fact, those with many losing trades can be very good traders. Those that hate taking losses will eventually lose a lot of money, because they will hold on to losing trades for a very long time just to avoid "recognizing" the loss. They simply don't want to admit to themselves that they have lost a trade. This is where perfectionism is bad for traders because one only needs one bad trade to lose everything - the one trade that is big enough. And it will be big enough if one lets it become that big by not closing it and not taking the loss while it is still small or moderate.
The above example revolves around "erasing the loss" and the loss itself, which suggests that "loss aversion" is in place. This is actually one of the emotional biases identified by behavioral finance. The result of this bias is becoming overly short-term focused and losing perspective on the whole portfolio, which can lead to overtrading, taking positions that are too risky, and the abovementioned cutting winning trades too early and letting losing trades become even worse.
Q: …At this point, GOLD must fall to $33.10 before I can use my proceeds to buy back in and 'erase' my loss. Obviously, if it falls further I am ahead; but if GOLD doesn't decline to at least $33.10 and instead moves back up, I must now buy back in at a higher price and add to my $6,774 loss.
A: We respectfully disagree once again. GOLD doesn't have to fall to $33.10 before you can buy back in and 'erase' your loss. If GOLD fell just to $33.50 and you bought back, you would still erase the loss (partially, but still) and you would be better off than by simply waiting out the move lower. So, even if we stick to the point of view in which we discuss adding to or lowering one loss, exiting the long position on a declining asset is a good idea.
It is much clearer if you view each trade separately. You are long but you no longer think that the asset will move higher. So you exit the position regardless of the price (whether you exit it at a profit or loss is not important at all - if it was profitable you would call that "taking profits off the table" and if it was a loss, you would call it "cutting losses"). When you believe that the position should be reopened, reopen it - whether the price is higher or lower than when you close your previous position. Simple as that. The point is that when you thought the price was going lower, you believed that you would have a better opportunity to reopen the position, so if you were correct, the odds were in your favor. By following this principle, you have to come out ahead if your estimations are correct. And this is what trading is all about - taking on a reasonable amount of risk in order to profit on changes in prices.
The goal of trading or investing is not to "erase a loss", but to make the most money in the end. If your aim was not to see yourself taking the loss then you could indeed achieve that by not exiting a losing position and defining a loss as only the closing position. This approach, although more pleasant psychologically, will lower your overall rate of return. In other words, you will pay for the "psychological comfort" with lower portfolio value. We strongly believe that by adjusting their approach one can improve the rate of return and at the same time still enjoy this psychological comfort.
- Practical advice #1: Once the position is established, forget the entry price. Seriously. Remember the reasoning behind the direction of the trade and be sure you know when you should close it (by stop-loss or other means), but don't pay any attention to the price at which you entered the trade. It doesn't help you in anything at all and can make you physically anchored to this level in some ways ("I have to wait for the price to get back to this level to come out even" is a good (actually, bad) example).
- Practical advice #2: Always ask yourself the following question: "if I hadn't entered this position earlier, would I still open it today?" If the answer is "no", then close the position. Simple as that. The fact that you have entered a position is no justification for keeping it open. Unless you’re the head of the Bank of England or you can have a similar impact on the market, the market doesn't care about the price at which you have entered the trade, and doesn't take that information into account when establishing a trend. And you shouldn't use it as a factor either.
- Practical advice #3: Never, never, never mix what you think about a given trade with what you think about yourself. No matter how dedicated you are to your investment and trading, and no matter how much you care about the financial future of yourself and your family, you are not your trades. Losing a trade or exiting at a loss doesn't make you a bad person, a loser, etc. The efficiency of any trader can only be determined in the very long term.
In a restaurant, you don't taste a meal before it's ready and served. A jury doesn't vote before all the matters have been discussed. Investment and trading are not one-time events. They are a process that often spans over several decades. What sense would it make to judge the cook after they have just added the first ingredient and what sense would it make to reach a verdict after hearing just one witness? None. Similarly, it's pointless to judge your actions by yourself by just one trade, or even after a few months.
Plus, in the case of investing and (most of all) in the case of trading, randomness plays a huge role - you can't blame yourself for a losing trade just because you lost it. You can blame yourself if you lost it because you didn't pay any attention to what was going on in the market, but if your reasoning was good and you made the effort (and since you are reading this right now - you ARE making an effort), then it's simply not your fault if the trade was lost.
Does it have to be someone's fault? People like to think so because that makes them feel like they control the situation, but that's simply not true. Finding the guilty and teaching them a lesson or punishing them may work in most areas of life, but not in trading.It can be the case, and quite often will be, that a losing trade will be nobody's fault. It's just how markets work. There are no sure bets and no riskless assets (cash is not a riskless asset in our view as it constantly loses value through inflation and currencies are not eternal), and trading is a game of probabilities. You have to lose a trade every now and then - that's not bad, that's normal and you should expect it. The fact that you care about your and your family's future by managing your money after having thought about it, and by always making trades that are well-justified, makes you a good investor/ trader and - in the investment-related aspect - a good person. Losing one or a few of the trades does not change that at all.
Q: Now, in the current environment, GOLD could go up or down. I am going to assume that at some point GOLD will return to $34.50 - that's a pretty sure bet. The question is, how much further below $33.77 might it move first, and am I inclined on betting on that move?Again, to break even it has to hit $33.10. To make any real money, it has tohit $32.50 or so. My position is that, in order to risk the 'loss' of my 200 shares, I must be adequately compensated. And of course, that depends on the size/probabilities of a move downward, as you pointed out in today's update.
[This is no longer applicable in today's situation, but we decided to keep this part of the question to keep its integrity.]
Q: My point is, if I were to look at this trade in isolation, yes, sell now before it goes lower. But that is notalways the way to look at it in practical terms. I might suffer a bigger paper loss here temporarily, but there is really little chance of me translating that to a real loss - unless the bull in gold changes. And I am all about preventing losses.If you see anything wrong with my approach, I would appreciate (really) knowing.
A: In our view, that's precisely the practical way of looking at trades. Paper loss is really… a loss. Instead of agreeing to suffer a bigger paper loss we suggest staying out for at least a part of the decline. Thanks to this, in accounting terms, you will have a losing trade and a winning one (instead of just eventually having a winning one), but your profitability will increase. Ultimately, the point of investing is not minimizing the number of losing trades but making the most money in the long run.
We are about preventing losses too. However, the key point is what we mean by that. The point is to cut losses by exiting current positions as soon as you realize you wouldn't reopen this position if you didn't already have it. The point is not to prevent recognizing and acknowledging a losing trade simply for the sake of not having a losing trade in accounting terms.
Summing up, the reasons for which we believe that treating each trade separately, looking at "paper losses" as "losses", and not focusing on particular trades and their results are all good ideas are: increased profitability and greater chances of detecting and mitigating some emotional biases (mostly revolving around "loss aversion") which could otherwise further decrease profitability and increase investment risk.
Question and Answer Panel
We have updated the Q&A Panel this week and it now includes a complete set of replies from previous updates that were universal (relevant regardless of the time in which they were asked, which is another way of saying that they are up-to-date today as well).
If you didn't review this section previously and you didn't read all the Premium Updates in the past years, here's the list of questions that you might have missed and that you might be interested in. The list is available in the Q&A Panel along with longer questions, but we thought that you might appreciate the ability to skim through the questions quickly on just one page.
- Could gold ever move $100-$200 in a day?
- What do you think about the Andrew's Pitchforks and the Ichimoku Cloud?
- Can an unbalanced U.S. budget have meaningful impact on precious metals?
- Do you suggest GLD and SLV for opening speculative long positions?
- How can we profit from intraday trading?
- What's your opinion on point and figure charts?
- Is a long-term correction in gold possible?
- How to deal with huge volatility in gold and silver prices?
- Can gold miners deliberately sit on their reserves?
- Why do you look at gold priced in Japanese yen?
- What are your thoughts on DGP/AGQ funds?
- It would be good to see your results, stop-losses and the risk you take.
- How can I hedge my gold holdings in India?
- Is the economic picture deflationary?
- What's your take on gold mining company valuation?
- What do you think of AGQ ETF as a fund tracking silver?
- How do you develop and use your precious metals cycle analysis?
- Is it true that low interest rates don't result in higher stock prices?
- Is it correct to treat junior gold and silver stocks as long-term capital?
- Are you using GDX as a proxy for miners, or either the HUI or XAU indexes?
- How about using DUST ETF for precious metals trading?
- Gold confiscation - any thoughts?
- Is AAPL:GLD a good ratio to use to buy gold?
- Can you give me some clues as to how to interpret your indicators?
- How long do you think the bull market in precious metals will last?
- What if I see a double extreme indicator on two consecutive days?
- How did you come up with a price target of $5000 for gold?
- Should I gather copper pennies and nickels?
- Does it make sense to stay in the gold market if it is manipulated?
- What to do when I lost 90% of my speculative capital with a huge bet on precious metals?
- How can I hedge my junior silver miners portfolio?
- How has the purchasing power of gold increased since 1900?
- What if the Fed devalued the dollar by 40%?
- Why is your analysis of gold heavily influenced by the US dollar?
- Is gold correlated with the US debt ceiling?
- Can you suggest a book for learning how to read gold and silver charts?
- What will be the role of China in the precious metals market?
- Why do your indicators flash buy signals when your predictions are bearish?
- Which ETF is better: GLD or CEF?
- Why are your definitions of risk-tolerance and risk-aversion different than the general ones?
- Are short counter-trend rallies important at all?
- Could you recommend a book on behavioral finance?
- What impact would the nationalization of mining in Bolivia have on silver?
- Could you explain the terms: long position, short position, long-term position and short-term position?
- Why don't you provide trading signals for the general stock market?
- Which scale is better: linear scale or logarithmic scale?
- How do you define a breakout?
- Are restrictions on owning gold likely to be imposed?
- How high do you expect the gold:silver ratio to move?
- When will the U.S. dollar crash?
- If the dollar collapses, will I be able to sell my precious metals?
- Do you use the Hindenburg Omen in your analysis?
- Why don't you use the Elliott Wave pattern analysis?
- Is there a way to avoid the precious metals tax paradox?
- When does a junior stock come off the pink sheets?
- Could you give me some information on the PHPP ETF?
- Mining stocks going up on rising volume near the end of the session - is this a bullish signal?
- Should I buy gold priced in USD or gold priced in other currencies?
- Taking a bank loan to finance my investments - is this reasonable?
- Would a collapse of the euro bring precious metals down?
- Which mining stocks should I hold?
- If the bond market collapses, will precious metals decline?
- Will the maintenance margins for gold and silver rise in the future?
- Is there any difference between the Democrats and the Republicans for a precious metals investor?
- Should I short gold to protect my physical bullion?
- Can I use fundamental analysis alone?
- What if the CFTC makes an intervention on the derivatives market?
- Should I go long gold when the government prints money?
- What if the analyses we use are wrong?
- What if human nature has changed the precious metals market?
- My junior stocks don't perform well. Should I sell them?
- Can I profit on options even if I'm wrong several times?
- Don't your charts become outdated if the market conditions change?
- Which Indicator From the Charts Section is Most Useful for Me?
- Do you feel that the Canadian, US, and Australian stock markets will survive?
- I'm new to investing in Precious Metals - do you have a set portfolio or do you provide trading tips?
- Precious Metals are usually weak during the summer months. Why is it different this year, or is it?
- Volume is so important on stocks - does volume influence your option picks?
- Wouldn't small volume on the options market cause their price to spike if many investors buy at the same time?
- Why do we need graphs, slopes, etc.? Can't we just stick to fundamentals?
- Are numismatic coins better than junk coins?
- Does technical analysis work on manipulated markets?
- When do you expect the USD to crash and gold to sky-rocket?
- Are we in deflation? If so, will gold still rally?
- Fundamentals are awful and bound to cause a steeper decline!
- Do you agree that trading in gold may be banned?
- Junior stocks and their cash reserves
- Retirement: all in silver? Electronic silver?
- How can a silver producer be uncorrelated to silver?
- Your last prediction didn't play out as expected...
- You are reading charts in the wrong way
Summary
The situation in the USD Index is a bit more bearish than not. Stocks could rally immediately or move to the $1,330 level; they are already extremely oversold. The overall picture for the precious metals is bullish and any additional weakness in the sector should be very temporary. The mining stocks declined heavily this week and the rest of the sector did not. We view the current performance of miners as an anomaly that will soon disappear when metals continue their upswing.
Most important is what comes next. The outlook did not change for gold, silver and mining stocks and remains bullish for the short, medium and long term. Being speculative long appears to be a good idea at this time.
Gold moving to $1,706 (the price that we see at the moment of writing these words) does not invalidate the above at all. The consolidation is still small compared to the size of the previous rally. Gold touching its 300-day moving average means that a major (!) bottom is in place and that was the case very recently. Additionally, the True Seasonal patterns suggest strength in the second half of the month.
Long-term investments: remain in the market with your precious metals holdings. We have changed the allocation in this part of the portfolio – we moved part of the capital from metals to mining stocks in order to take advantage of the current sharp decline in the miners to gold ratio. How much? Depends on your risk preferences and other factors – please see the gold & silver portfolio report for details. The 3 pictures at the bottom of the report (with 3 portfolios) have been adjusted to reflect this change.
"Being brave when others are fearful" is one of the profitable principles when it comes to investing and this is the moment when we execute it.
Trading – PR: Long position in gold, silver and mining stocks
Trading – SP Indicators: Long position in gold, silver and mining stocks with a 2-week trade in mind
| Portfolio's Part | Position |
|---|---|
| Trading: Mining stocks | Long |
| Trading: Gold | Long |
| Trading: Silver | Long |
| Long-term investments | Long |
Thank you for using the Premium Service. Have a profitable week and a great weekend!
This completes this week's Premium Update. Our next Premium Update is scheduled for November 30th – there will be no Premium Update next week. However, we understand that because of the sharp decline in the mining stocks you might appreciate some extra updates from us. Consequently, until the next Premium Update is posted (in 2 weeks), we will be sending Market Alerts on or after each trading day regardless if a material change is seen or not. You can rest assured that you will be kept up to date.
Przemyslaw Radomski, CFA


