
Whatever glow there might have been from last week’s European summit turned to gloom as markets turned downwards Monday. Global investors drove down everything in sight, including gold which dropped nearly 3% to a seven-week low to trade under $1,660 an ounce. Gold got lumped with other assets considered risky (we live in interesting times, as gold was known to be the “safe asset” for millennia and now it’s a “risky asset”). European indexes were down: Germany 3.4%, France 2.6% and Italy 3.8 %.
Everyone seemed worried that the steps taken by the EU last week fell short of what is required to stabilize Europe's sinking bond markets. Stop-gap measures such as the coordinated international injection of liquidity only buy time. Can they buy a lot of it? Likely a few more years. Is the situation “taken care of” in the short term? Yes. What’s making the price move lower in the short term? Emotions. And in this case? Worries.
At the bottom of all this anxiety is fear of an imminent demise of the eurozone and extreme fear is something that we see around bottoms, before a rally starts. Whether the fear is currently extreme is a different matter.
We sent out a Market Alert Monday outlining several possible outcomes:
- If gold closes above $1,700 then nothing will change as far as our views on the market are concerned. Namely, we will continue to view the probability of $1,900 and $40 being reached (gold and silver respectively) before a move to $1,600 or lower at 75% or so,
- If gold closes above $1,660 but below $1,700 then, we will adjust our view on the probability of $1,900 and $40 being reached (gold and silver respectively) before a move to $1,600 or lower to 70% or so,
- If gold closes below $1,660, the probability of the above-mentioned targets being reached before a move to $1,600 (or lower) will be lower than 70%, but it's impossible to give an approximate probability because there are too many factors that are involved (like volume).
Today, we will provide an update on the above.
Tuesday, U.S. stock futures edged temporarily higher after encouraging economic-sentiment data from Germany and ahead of the U.S. Federal Reserve’s announcement on monetary policy.
In a knee-jerk reaction, as is the case in previous downturns in the price of precious metals, the anti-gold faction had a field day this week. Mark Gongloff in The Wall Street Journal wrote rather sarcastically:
Time to check back in on how precious metals are working as safe havens: Yep, still not working. Gold and silver getting absolutely pounded today, doing much worse than the stock market, providing not one quantum of solace for anybody who’d bought them assuming they’d hold value amid a global credit apocalypse.
Although it is true that we did not get much "solace" from Monday’s market action, we beg to differ on Gongloff’s assessment of gold as a safe haven. He himself said in his article "the global credit apocalypse still has some time to play out."
To be fair, it is not only the gloating anti-gold gremlins that were down on gold Monday. Newsletter writer Dennis Gartman, who has invested in gold in the past, said he is reducing his position in the metal and will wait on the sidelines. "We’ve been bullish for quite some while; that bullishness has been proven proper, and if the market’s price action dictates that we hove to the sidelines, hove we shall," he said noting, that when he will reenter the market, it will be to own gold and gold equivalents, and not gold equities.
It is precisely at turbulent times such as these that our emotional responses kick in, our time horizons shrink and we tend to make investment mistakes. To the extent that we can control our emotional and psychological involvement, we’ll outperform other investors. Let others make decisions based on irrational exuberance or irrational fear instead of sound financial reasoning and we can earn the “anxiety premium” by taking advantage of other people’s nervousness.
At times like this you need financial liquidity to survive market downturns, but more important, you need what we call “Emotional Liquidity” to see you through. For that you need to know what your financial personality is and how you are likely to respond to market events as they happen.
So, how you do you manage to keep your cool? Sitting on large piles of cash keeping money out of productive investment is an expensive way to limit risk since inflation is eating away at the value. There are other things you can do as a way of smoothing out the short term bumps, mainly diversification, rebalancing strategies for portfolio and use of products that offer downside insurance.
In other gold-related news, perhaps you might have heard that Russian Oligarch, Mikhail Prokhorov, 46, the third-richest man in Russia and owner of the New Jersey Nets basketball team, is planning to run for the presidency in Russia. This is after thousands of middle-class voters demonstrated this week over alleged vote-rigging in parliamentary elections. What is not so well known about Prokhorov is that he became one of Russia's leading industrialists in the precious metals sector. While he was running Norilsk Nickel, the company became the world's largest producer of nickel and palladium. He is also the former chairman of Polyus Gold, Russia's largest gold producer.
Also, what is billed as the world’s most valuable rare gold coin was sold for a record $7.39 million recently by U.S. coin dealer Blanchard & Co. The coin is the "Brasher Doubloon" with the punch on the breast, America's first and most important gold coin and the only one known example. This is highest price ever paid for a coin in a private transaction. According to the Blanchard release, the gold coin was minted in 1787 by Ephraim Brasher, a silversmith and goldsmith in New York City, and it contained $15 worth of gold at the time of its minting. At 26.4 grams of 22 carat gold the coin would be worth about $1,275 based on its gold content. The Brasher Punch-on-Breast Doubloon is the first American-made gold coin that had a denomination in dollars and that was struck to the same standard that was later adopted for all U.S. gold coins, making it what is today considered the first truly American gold coin.
To see what the near future has in store for precious metals let's begin this week's technical part with the analysis of the Euro Index (charts courtesy by http://stockcharts.com.)
Euro - USD Indices
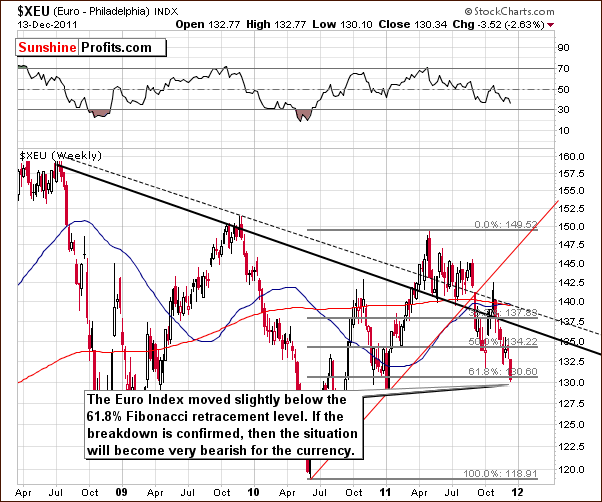
We begin this week with a look at the long-term Euro Index chart, we see that the index moved lower this week past the level of the previous low and slightly below the 61.8% Fibonacci retracement level. Since the week has not closed, the latter is not yet a clear and confirmed move but the situation is clearly more bearish than last week. The uncertainty in Europe is undoubtedly contributing to the lack of clear focus here.
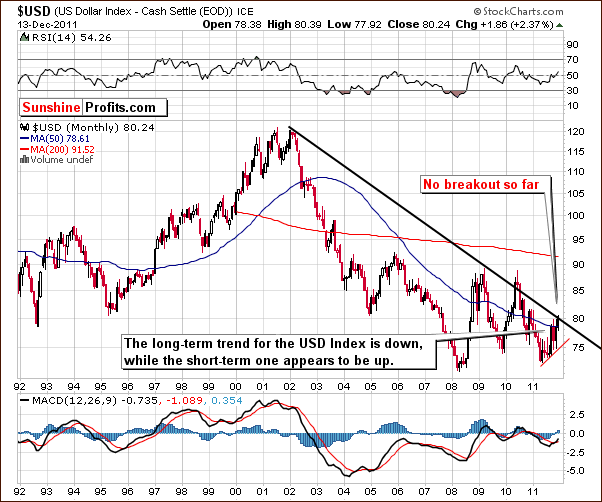
In the very long-term USD Index chart, the situation is not as bullish as would be implied by the Euro Index analysis. The reason for this is the 80 level. The USD Index has moved slightly above 80, but this move has not yet been confirmed. The outlook for the dollar is more bullish than last week but not clearly bullish at this time. It’s simply not a sure bet that the index will move higher from here.
The long-term outlook appears bearish while the short term seems somewhat bullish. This mixed outlook is due to the move above 80 and the uncertainty as to whether this move will be confirmed. The best way to describe the index today is mixed.
Summing up, the outlook for the euro has turned more bearish this week and the outlook for the dollar more bullish. The uncertainty is due to the 80 level in the USD Index and whether or not this level will hold subsequent declines or be broken to the downside in the next few days.
General Stock Market
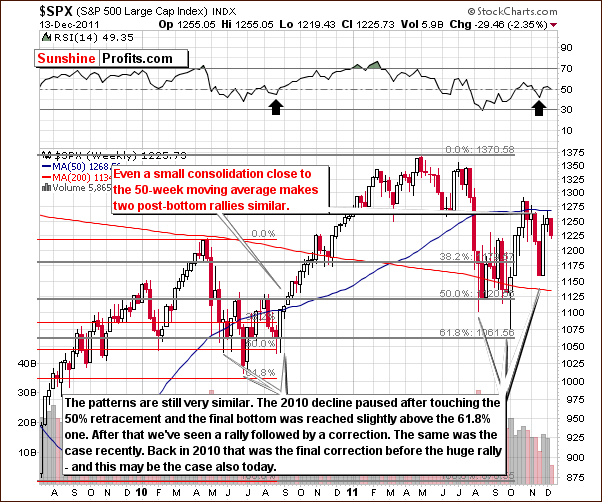
In the medium-term S&P 500 Index chart, there is nothing to add to what we said about the general stock market in last week’s Premium Update:
The index is now close to the 50-week moving average and this is a situation which was also seen near the middle of 2010. The trading patterns seen at that time were also quite similar to the price action of the past few months.
The implications here are bullish for stocks in general. Last year, when a period of consolidation was followed by a breakout above the 50-week moving average, a significant rally materialized. This rally saw the S&P 500 Index level rise from around 1125 to the 1340 level or so, a 19% increase in less than six months! A similar move could be seen once again in the coming months.
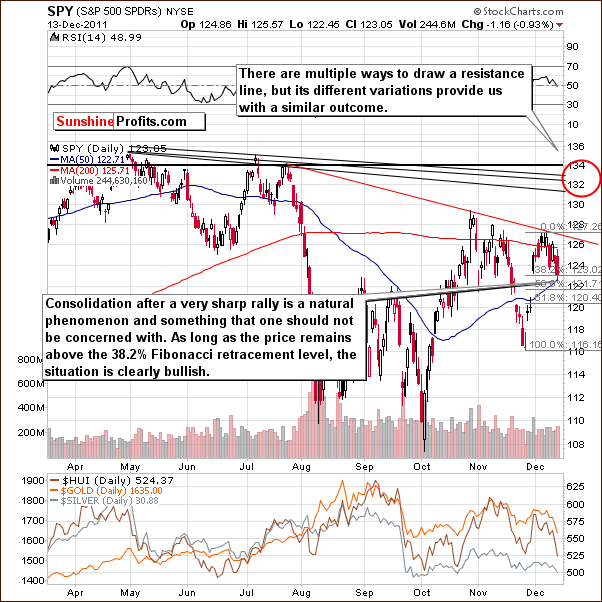
In the short-term SPY ETF, stocks declined this week but stopped at the first Fibonacci retracement level. This is important and causes the bullish outlook to remain in place and the short-term trend to continue to be bullish as well.
Summing up, the situation in the general stock market remains bullish. Declines this week appear to be part of a small consolidation period in advance of a probable resumption of the rally.
Correlation Matrix
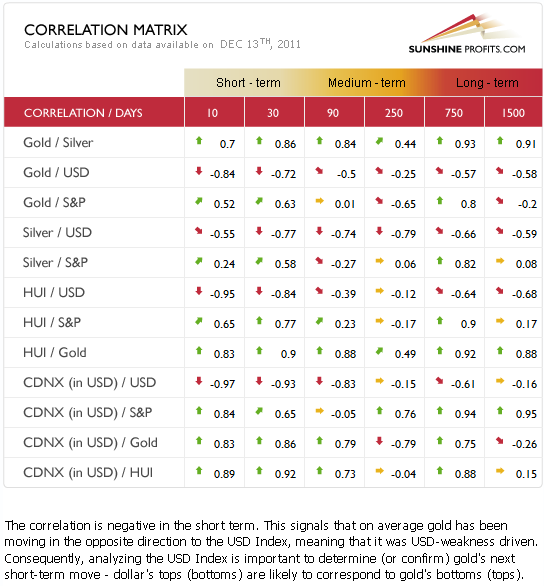
The Correlation Matrixis a tool which we have developed to analyze the influence in the coming weeks of the currency markets and the general stock market upon the precious metals sector in short-, medium-, and long term.
This week the correlation between gold and the USD Index continues to be negative although the developments in the currency markets this week have made their influence less bullish upon the precious metals sector. Last week the USD Index had a bullish influence upon gold, silver and gold and silver mining stocks and this week the situation is mixed. The situation has clearly deteriorated somewhat.
The general stock market and precious metals correlation has remained positive since last week. The implication upon the metals from stocks is still bullish for the short term as seen in the 30-day column.
Summing up, based on the analysis of the currency and the general stock markets, the situation is still bullish but less so than it was last week.
Gold
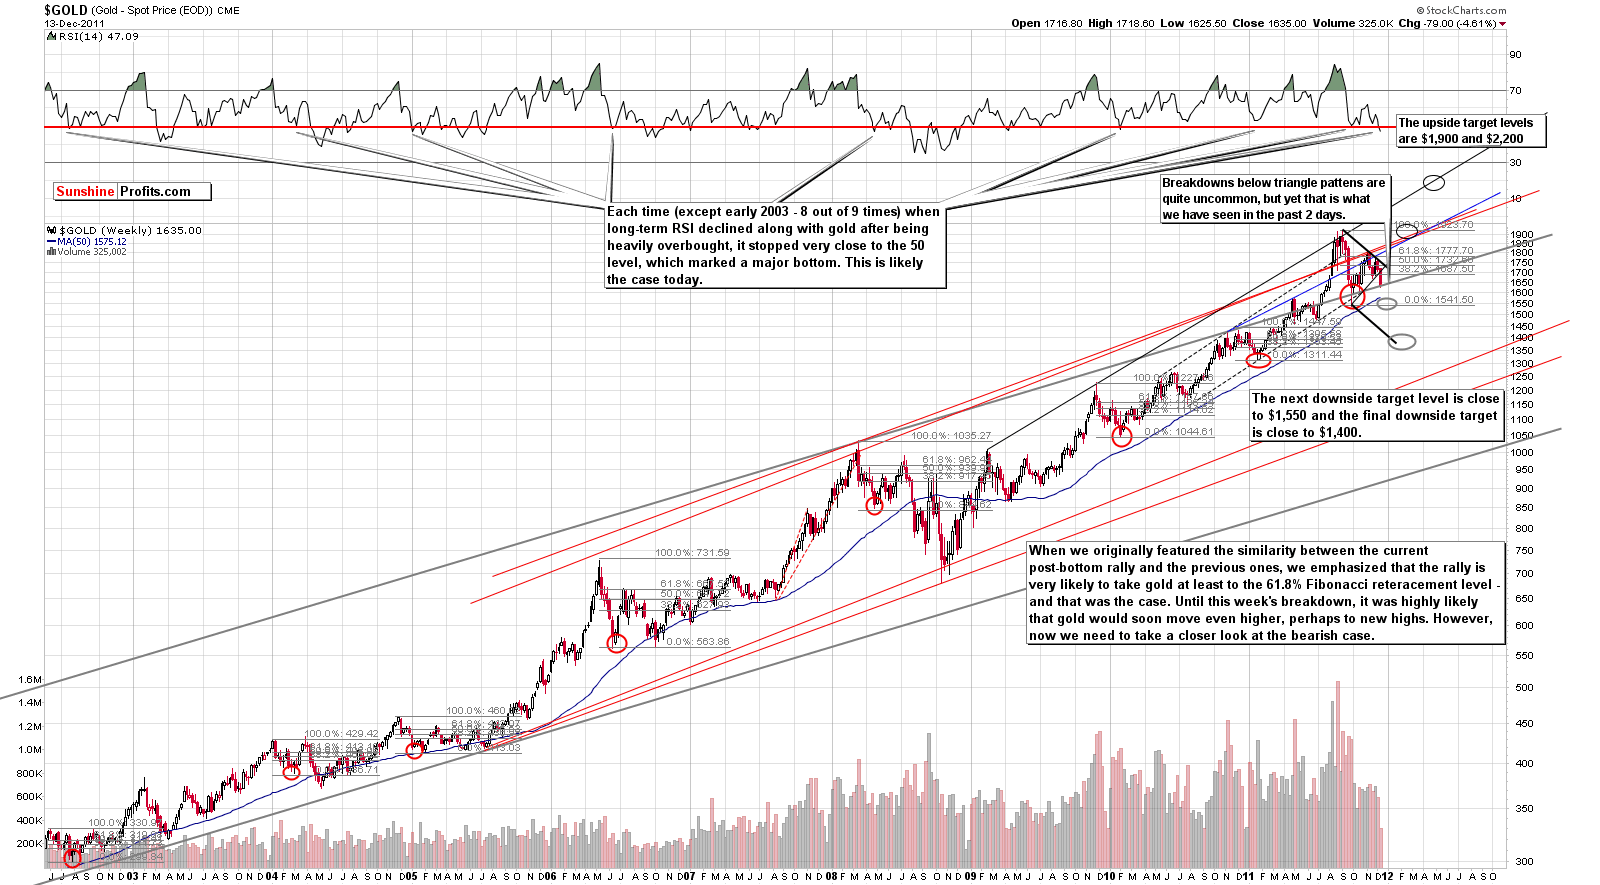
This week, we begin our gold section with a look at the very long-term chart (please click the above chart to enlarge). With the breakdown being in place, we now must consider downside target levels. If the current decline stops fairly soon, the likely target level is around $1,550, which is a bit more than 5% below Tuesday’s closing price. A continuation of the decline could bring prices down to $1,400, which seems to be a long-shot but is still a valid maximum downside target level at this time based on technical analysis of this chart.
The bearish trading pattern was not expected, since triangle patterns normally are followed by a trend in the same direction as the one which preceded it. This is not what happened this time, however, although the recent breakdown could still be invalidated. However, with prices having declined significantly on corresponding high volume, the bearish scenario is more likely, and an invalidation of the breakdown does not seem very probable on Wednesday.
In the past, post-bottom rallies (bottoms are marked with red ellipses on the above chart) frequently resulted in prices rising at least to the 61.8% Fibonacci retracement level (and gold has in fact moved to this level). In many cases the rally took gold even higher – to previous highs or even higher. Consequently, that was the expectation as we looked ahead last week. Instead, we have seen a breakdown from the triangle pattern and the move to the upside is no longer a likely outcome.
In the past, when price levels did not pursue the level of the previous high, declines generally stopped close to the level of the original bottom and then rallied. This would coincide with our $1,550 target level from the bottom seen earlier this year, so there is a good chance that gold will rally if the decline takes it down this far.
Two exceptions to this rule have been seen in recent years. One was in 2008 (gold moved significantly below its first low), which does not seem likely to repeat as overall market conditions are much different today. The general stock market also plunged at that time, and there is no sign of this on the horizon this time around. In 2004, gold’s price went slightly below the level of the previous low and this is why we have a not-too-likely worst case scenario of $1,400 on the downside. Although the outlook based on this chart alone is bearish today, the next rally could still bring gold as high as $1,900 or even to the$2,200 price range.
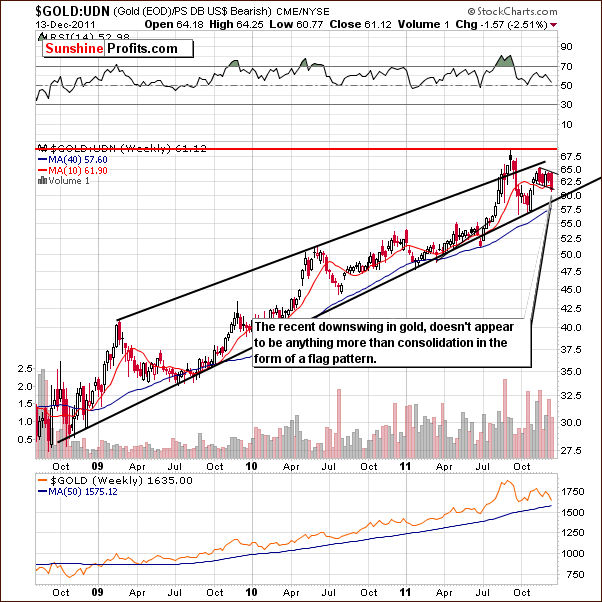
In this week’s long-term chart of gold from a non-USD perspective, overall analysis shows that the chart is bullish. The flag pattern after a sharp rally usually results in an uptrend to follow but this week we have seen what seems to be a small consolidation. This could be beneficial for the short term as consolidations following upswings are often followed by another rally. For the short term, therefore, the above chart appears bullish.
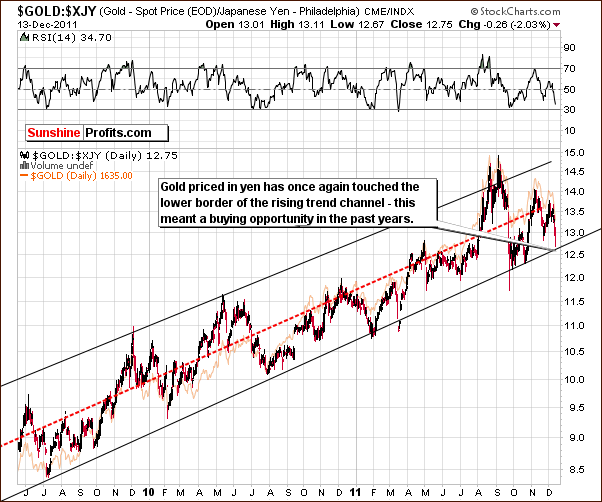
Looking at gold in terms of the Japanese yen, we see a move to the lower border of the rising trend channel. This has frequently coincided with buying opportunities in the past few years and the implication here is therefore bullish at this time. While the bounce may not be immediate, it is probable that it will be seen soon based on the chart above. So far, no real breakdown below the lower border of the trading channel has been seen except for a very short period last spring which was quickly followed by a 10% rise in price levels over the next few weeks.
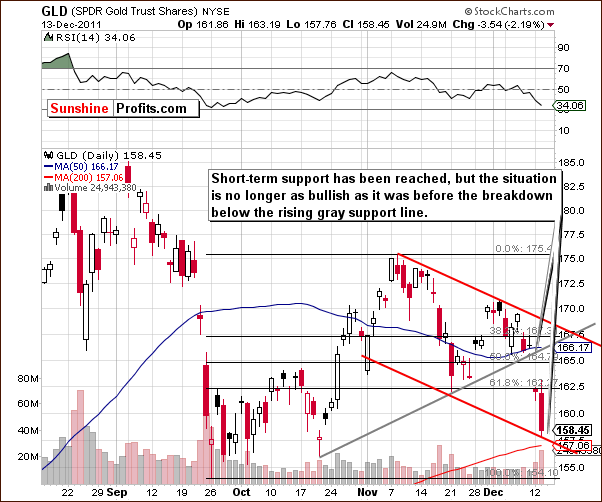
In this week’s short-term GLD ETF chart, we see that a short-term support level has been reached. Also, an ABC correction is seen which may be an indication that we have seen the final part of this move down. Based on the breakdown below the rising support line, the situation is not as bullish as it was a few days ago but this chart is not as bearish as the long-term gold chart presented earlier.
Please note that the recent move lower took place on significant volume which is a bearish confirmation.
Summing up, the overall analysis of the gold charts this week shows a more bearish bias than it was the case just a few days ago. The non-USD chart is bullish and so is the chart featuring gold from the yen perspective. The short-term GLD chart is mixed and the (most important) long-term gold chart is rather bearish. So overall, the situation for gold can best be described as mixed at this time.
Silver
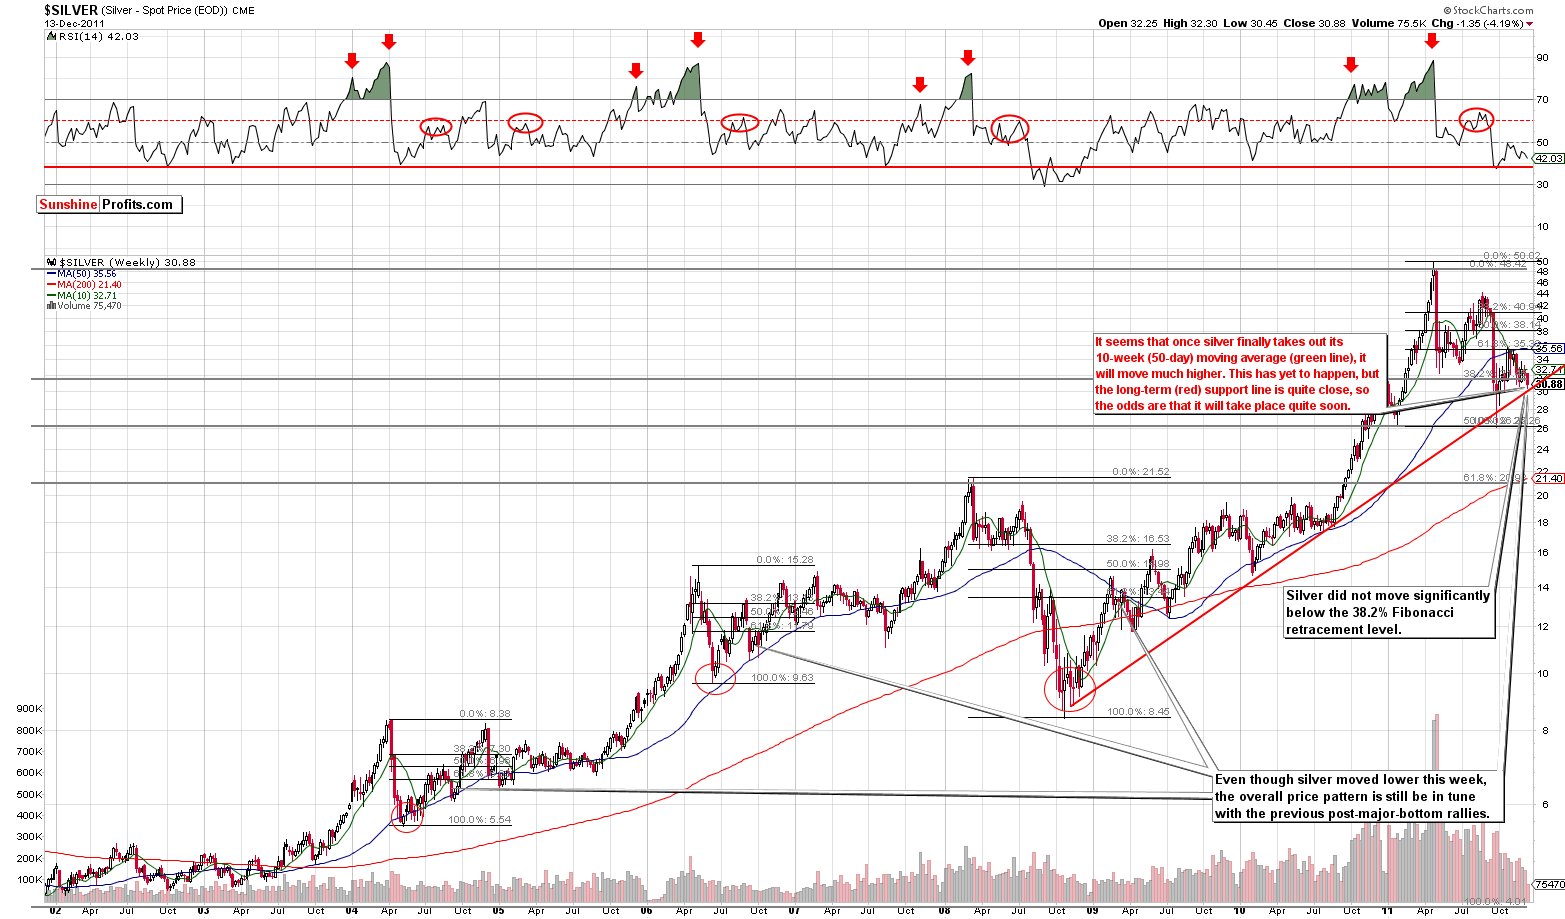
In this very long-term chart for silver (please click the above chart to enlarge), silver’s price has moved down close to the long-term rising support line, and it seems that a major bottom may be in at this time or close to being in. Silver’s price has moved below the 38.2% Fibonacci retracement level but not significantly. The breakdown is not in from the very long-term perspective and the price patterns are still consistent with previous post major bottom rallies.
Looking at another very long-term chart for a somewhat different perspective, it seems that silver is likely to reverse in the week ahead and rally once again. A cyclical turning point is in play which could lead to a turnaround in silver’s price to the upside before the end of 2011.
Another way to look at it is that we could see a significant plunge after silver breaks decisively below the rising support line. That’s not the most likely outcome, though.
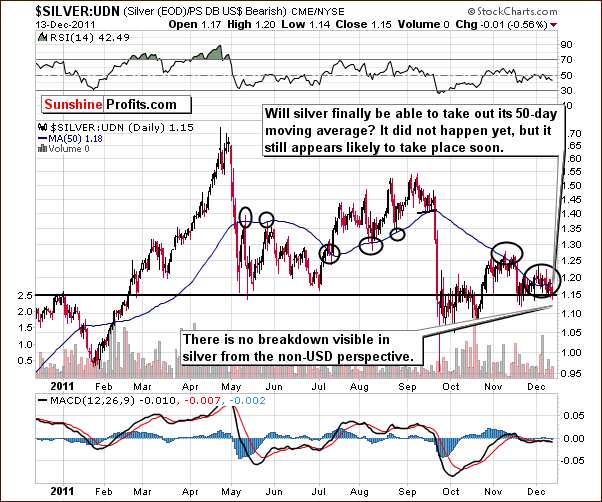
We now look at silver from a non-USD perspective in this week’s short-term chart. No breakdown is seen here and silver is still trying to move above its 50-day moving average. Although such an attempt failed last month, it seems that this may be accomplished soon and a strong move to the upside could then very well follow – however we would first need to see breakout’s verification. The situation is mixed due to the possibility of a breakdown and the time lag issue with respect to breaking above the 50-day moving average.
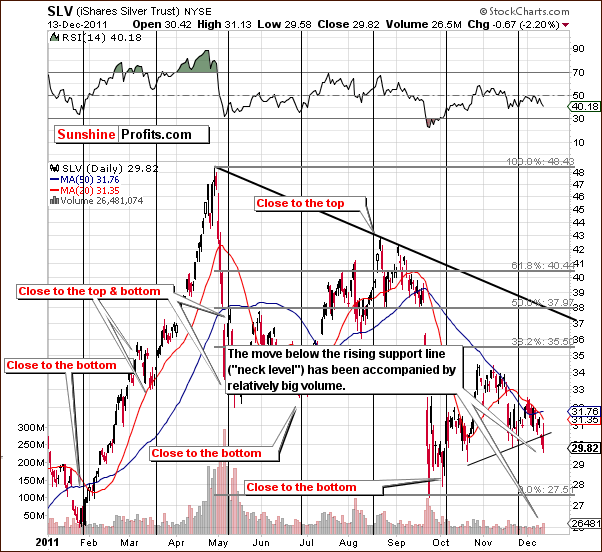
In the short-term SLV ETF chart, we have bearish implications this week. Prices have moved below the rising support line which corresponds to the neck in the bearish head-and-shoulders pattern. The price decline was seen on relatively high volume and this is also a bearish signal. The breakdown is not yet confirmed since Monday and Tuesday represent only two days of closing prices below the rising support line. If Wednesday’s close is higher – above the rising support/resistance line, the breakdown will be invalidated.
The situation here is very interesting because it is quite the opposite of what’s seen in the gold market. Here the long-term chart appears bullish and the short-term one is bearish, whereas the exact opposite situation is seen for the yellow metal.
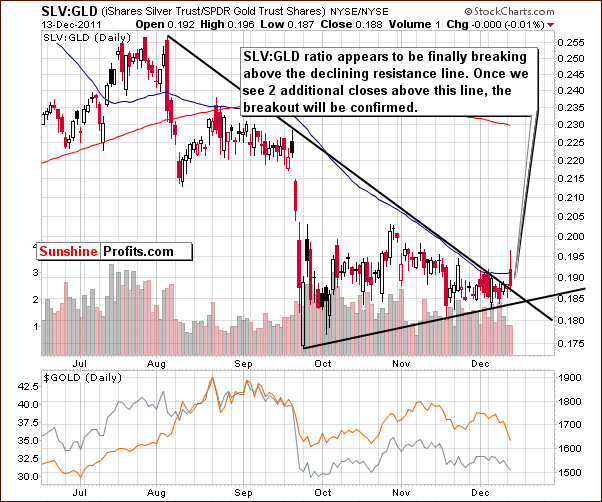
In the silver to gold ratio chart, we have seen a breakout upswing here. In last week’s Premium Update, we discussed this very topic:
In the silver to gold ratio chart, we see that silver appears to be in a position where a breakout or breakdown could, in fact, be imminent. It seems probable that this ratio will move higher based on factors discussed previously in this update. Furthermore, with silver typically moving quite sharply (when it finally moves), it appears that its next move can take silver much higher after the breakout – in terms of the ratio and spot price.
If two more closing prices above the declining resistance line here are seen here, the case will have been made in support of the statement that silver is outperforming gold. This is by no means a sure bet, however, as the short-term implications have bearish factors to consider as well.
Summing up, the outlook for silver is more bullish than gold’s. Silver has bullish implications in its long-term chart and these signs are more important than signals from short-term charts.
Gold and Silver Mining Stocks
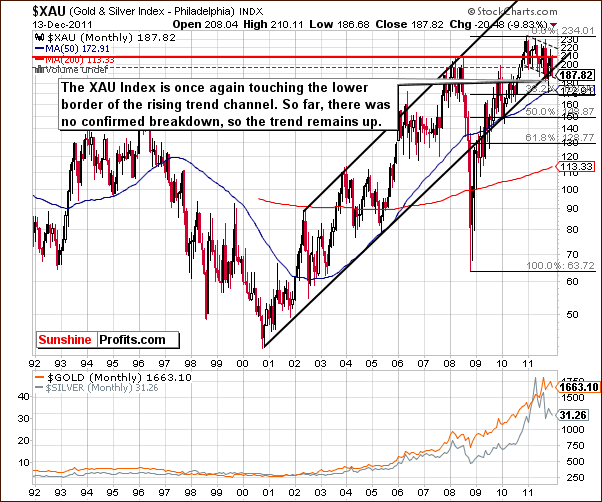
In this week’s very-long term XAU gold and silver miners’ index chart, we see that the index level has moved slightly below the long-term border of the rising trend channel. Since this move has been rather insignificant, it is not an overly bearish sign. Consequently, the trend here still appears to be bullish this week.
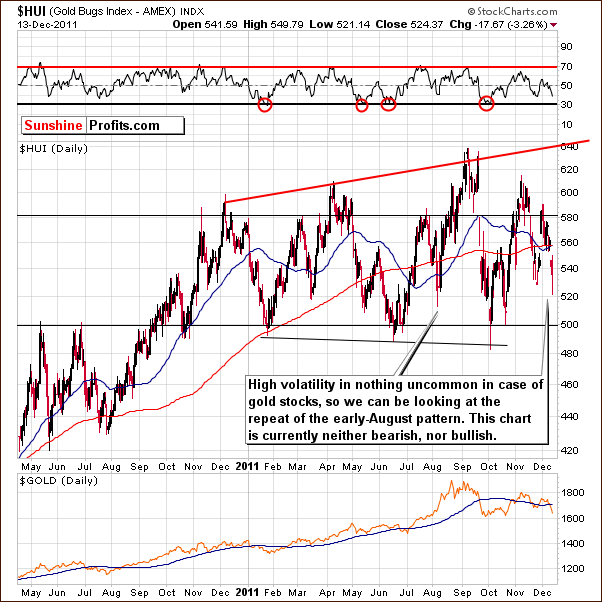
In this week’s long-term HUI Index chart, we are reminded that gold stocks are quite volatile in both uptrends and downtrends. Trading patterns this week have been quite similar to the ones seen in early August. At that time, the next move seen was a sharp turnaround to the upside. Of course, one similar situation doesn’t make the picture bullish here – but it suggests that it’s not clearly bearish either. The situation here is therefore mixed.
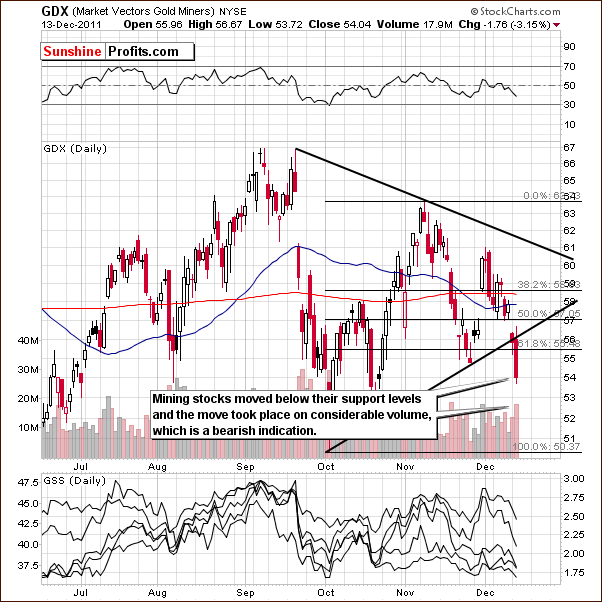
In this week’s short-term GDX ETF chart, the situation has turned bearish. A breakdown below the rising support line and below the neck of the head-and-shoulders pattern has been seen. The situation is similar to the long-term gold and short-term silver charts. Declines were seen on significant volume and the indications here are therefore bearish.
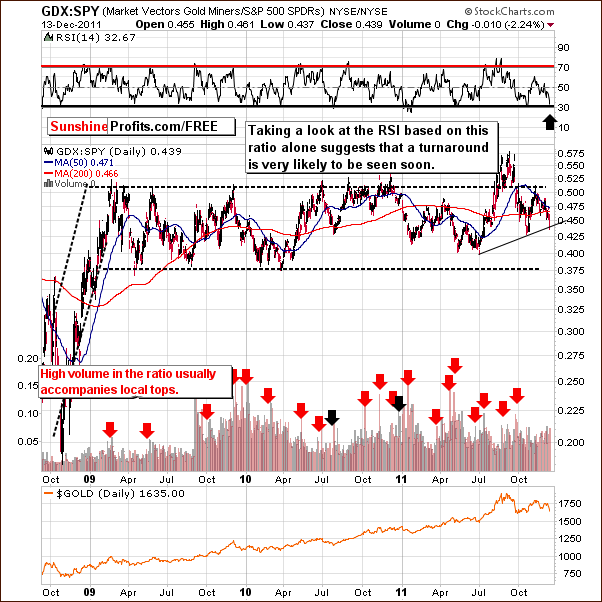
In the GDX:SPY ratio chart, the mining stocks performance is measured relative to other stocks. The ratio declined this week and the RSI Indicator here is close to 30. This has coincided with bottoms and buying opportunities in the past.
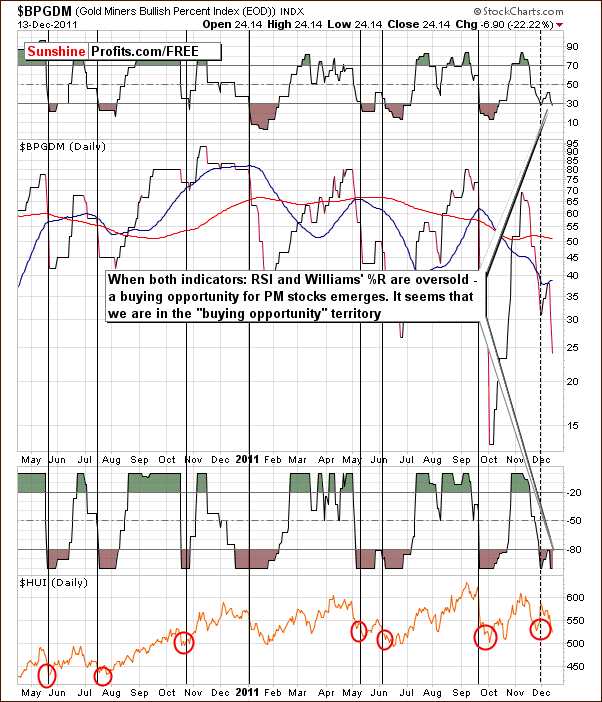
The Gold Miners Bullish Percent Index chart gives us similar signals as the GDX:SPY ratio chart. The RSI level and Williams’ %R are both oversold and this indicates a buying opportunity. Keep in mind that the final bottom may not be in yet as the implications based on this chart are an early signal. Either way, indications are more bullish than not at this time.
Summing up, the outlook for mining stocks has changed from bullish to mixed based on a bullish XAU chart, and signals coming from Gold Miners Bullish Percent Index and the GDX:SPY, a bearish GDX chart and a mixed HUI chart.
Letters from Subscribers
Q: When you say "the bullish stock market is bullish for precious metals," how so? Might you mean bullish for silver? If you look at the SPY vs. Gold over the last few years, and over the last 11, they are uncorrelated, or at least poorly correlated.
A: When we wrote "the bullish stock market is bullish for precious metals" we meant the next short-term move - meaning a move that was to take gold to $1,900 and stocks to their previous highs. We meant the whole precious metals sector, not just silver. While it is certainly true that in the very long run, gold and silver move more or less independently of the main stock indices, the latter do influence their short-term moves.
Please take a look at the Correlation Matrix. The correlation coefficients in the 1500-day column are close to 0 for gold, silver and mining stocks. Therefore, in the long run, each market moves according to its own fundamental situation.
However short-term moves (say, weekly or monthly) either up or down often take place at the same time in gold, silver, mining stocks and the general stock market. Yes, the link between silver, miners and the main stock indices is stronger than the link between gold and stocks, but that doesn't mean that the gold-stock link is not present. For instance, both stocks and gold have put in a local top in early November and they put a local bottom in late November (after which they rallied together).
Sometimes metals move in tune with stocks (for instance both rally when there's more money pumped into the system) and sometimes against them (investors focus on gold's role as a hedge against financial turmoil) - that's why we monitor the situation on a continuous basis and provide you with an updated Correlation Matrix each day in the Tools section.
Q: Please explain this "before moving to 1600" statement. Saying "there is a 75% chance gold will go to 1900," and "there is a 75% chance gold will go to 1900 before it goes to 1600" are two entirely different things.
A: Naturally, if one wants to dig deep into details, it is true that saying "there is a 75% chance gold will go to 1900" is different from "there is a 75% chance gold will go to 1900 before it goes to 1600.
The latter is more precise and is therefore correct. We're long-term bullish on gold and silver (we believe that gold will likely go above $5,000 before the bull market is over), so the probability that gold will EVENTUALLY move above $1,900 is not 75%, but rather 99% or so.
We assumed that we were clear on this one (we apologize for any confusion). By saying "gold has a 75% probability of moving to $1,900," we actually meant "gold has a 75% probability of moving to $1,900 before a major correction takes place."
Q: Is it a good time to buy 3x 10 oz A-MARK silver bars?
A: The author of this question did not specify whether they meant long-term investments or short-term speculation, but in case of long-term investments, the answer is “yes”. For short-term speculation, the answer is “not yet”.
Summary
The USD Index now has a mixed outlook as compared to the strong bullish outlook we reported last week. The Euro Index sentiment is currently somewhat bearish but much remains to be seen here. The situation in the general stock market remains bullish and the implications upon gold, silver and the gold and silver mining stocks remain bullish as well. Overall, the currency markets and the stock market continued to have a positive influence on the outlook for precious metals but it is not as strong as it was last week.
The outlook for gold is also less bullish than it was in our last Premium Update as prices declined on high volume this week. The short-term outlook for silver is not overly bullish and the same can be said for gold, silver, and gold and silver mining stocks.
Some bullish implications are present however. The RSI signal from the GDX SPY and the two indicators from the Gold Miners Bullish Percent Index both indicate that a buying opportunity is close at hand. The outlook for gold from a non-USD perspective is also bullish as is the long-term outlook for silver.
The bottom line here overall for the precious metals sector is that the short-term situations appear less bullish than last week and the long-term outlook remains as bullish as it has been. It still seems that the precious metals will move higher in the first part of 2012. We believe that keeping one’s long-term precious metals holdings intact is a good idea right now.
The probability of gold moving to $1,900 before a meaningful correction appears now to be about 55% as opposed to last week’s 75% likelihood. A meaningful correction, which means a price decline to $1,580 - $1,550 or lower, now appears to have about a 45% chance. A move down to $1,400 or so seems fairly remote with an estimated 10% likelihood at this time (which implies that the probability of a decline, but not as severe is approximately 35%).
Again, based on the above, we believe that the long-term holdings should remain in place at this time and adding to these positions still seems to be a good idea. The bull market is not ending, even though the move down may (!) not be over yet. Short-term speculative long positions however should be closed. It seems best at this time to wait for confirmation of a bottom before reentering speculative positions in precious metals. The probability of an imminent move higher is simply too low (55%) to justify an open position.
No buy signals are presently forthcoming from our SP Indicators. We feel it best to wait for buy signals (preferably coming from at least one of our SP Extreme Indicators) in order to enter markets with speculative capital. Short positions are not advised and do not appear to be worth the risk at this time. So, all in all, no speculative positions seem favorable today either.
This completes this week’s Premium Update. Our next Premium Update is scheduled for Friday, December 23, 2011, however we will let you know sooner (in fact as soon as possible) should any of the above precious-metals-related points change.
Thank you. Have a profitable week with a great weekend to follow!
Przemyslaw Radomski

