
Today's EU summit has been billed as the best-- perhaps the last-- opportunity to save the euro. As we publish today’s issue of the Premium Update we still don’t know the results, and gold, like most asset classes, will react to headlines coming out of Europe. Will "Merkozy," (ladies first), the leaders of Germany and France, be able to pull a rabbit out of the hat and save the day? On Monday the two issued an ultimatum demanding that all 17 nations in the eurozone agree to a change in European treaties that would compel them to balance budgets or face sanctions. German officials insist that budget discipline will restore investor confidence. However, the Franco-German plan could exacerbate Europe’s fundamental problem, which is a lack of growth.
On Wednesday Germany insisted that its European partners must undertake the politically charged process of changing European Union treaties, or at the very least, accept a binding new eurozone accord. It is likely that gold will rally in the event of a positive outcome from the summit since the yellow metal has been recently trading in correlation to risk assets. If in the longer term Europeans begin to get a whiff of a eurozone breakup that would also be bullish for gold since it is likely that investors will rush to diversity their euro exposure with gold.
For whatever it is worth, a new study commissioned by the World Gold Council shows that in periods of extraordinarily economic uncertainty such as those facing investors in the eurozone, an optimal strategic allocation to gold for euro-based investors ranges from 2-3% for the most diversified and lowest risk portfolios, to between 4-9% for portfolios split 50/50 between equities and bonds, and as high as 10%, for portfolios with the majority of assets in equities. As far as our views on portfolio structure are concerned, we believe that much more of one’s capital should be dedicated to precious metals. What WGC writes about is the allocation for an investor who doesn’t really believe in sector’s bull market and wants to invest in gold/silver to reap gains from diversification. Those who had only 2% in gold in 2008 and rest in stocks are not even close to matching the returns of those who used more than half of their capital for gold and silver.
Another interesting study was recently published about India’s passion for gold. Apparently this love of gold is placing a heavy burden on the subcontinent’s economy. Indians adore gold and it plays an important part in their culture, especially between October and January when the festival season turns into the wedding season. A report titled “India’s Fatal Attraction,” by Australian research firm, Macquarie, states that Indian households own about $950 billion worth of gold, an astounding 50% of the country's GDP in dollar terms, and about 11 per cent of the world’s stock. The report states that this is widening the country’s deficit, weakening the rupee and keeping money that could flow into the economy locked up in jewelry boxes.
India imports 92 per cent of its gold, making it the third largest of its merchandise imports behind crude oil and capital goods. The Indian economy is facing some difficulties. The rupee has depreciated over 18 per cent since August, making it the worst-performing of all Asian currencies. At the same time, India remains alone among its Asian peers in having a budget deficit. The Bombay Stock Exchange benchmark Sensex has also fallen more than 16% since the start of 2011. Last week India’s finance minister confirmed a slowdown saying that economic growth will be moderate to about 7.5 per cent in the current fiscal year, lower than the earlier projection of 9 per cent. Undoubtedly, western countries would drool to have such growth numbers. Complaining about 7.5 per cent growth is a bit like whining that you couldn’t afford the indoor jacuzzi and helicopter landing pad on your luxury yacht. But for a country that was once forecast to enjoy closer to double-digit growth, it’s a letdown.
But despite gold prices rising 64 per cent in rupee terms between January 2010 and September 2011, gold consumption in India has remained relatively robust, up 5 per cent year-on-year up to September 2011, according to Macquarie. The rise in gold prices by 500 per cent in the last ten years has increased the wealth of many households, the report says. The report noted that besides jewelry, Indians also have been buying bars, coins and other investment-type gold in 2011 with a 90% increase in such investments. But because Indians tend not to sell their gold, preferring to pass it down as inheritance, the roughly 8 per cent of Indian savings held in gold remains locked away from the wider economy.
Analysts have said the cumulative GDP value lost by stashing $800 billion worth of savings from Indian household over the years in gold, which is not a productive asset, is huge. However, India's continued growth (even if it is “only” 7.5 percent, will have a significant impact on income and savings and is set to increase gold purchasing by almost 3% per year over the next decade. Gold will continue to be adored and desired in India.
On another matter, it’s no longer just the silver-haired crowd that likes to invest in gold. A Marketwatch report says that the yellow metal has become popular among investors in their 20s and 30s’. Gold Bullion International, a seller of physical gold in New York, says that although about half of their clients are baby boomers and more established gold investors, the younger set seems to be catching on with the 25-to-35 year-old age bracket the firm’s fastest growing segment of buyers. Over the past two months, about half of the hundreds of new accounts opened at his firm were from people in their 20s and 30s. We’ve previously written on numerous occasions (and in the Top or Not? report) that gold and silver will become very popular among the young investors in the final stage of the bull market. The above doesn’t mean that we are there yet, as this phenomenon is only starting to become visible.
Unlike Europeans and Asians, Americans don’t have a long tradition of owning gold. Keep in mind that in 1933 the U.S. government under Frankly D. Roosevelt made it illegal to own gold and ordered citizens to deliver their gold for a price of $20.76 per ounce (equivalent to about $350 today). A year later, the price was changed to $35 per ounce where it remained until August 15, 1971 when President Richard Nixon abandoned the gold standard. The limitations on gold ownership by U.S. citizens were only repealed in 1974. So, for U.S. investors, without a long held tradition of gold ownership such as in India and Europe, there’s a sense of better late than never.
For those who have not yet purchased gold, let’s see if it’s better late than never by turning to the technical portion of the Premium Update. Let's begin this week's technical part with the analysis of the USD Index. We will start with the long-term chart (charts courtesy by http://stockcharts.com.)
USD – Euro Indices
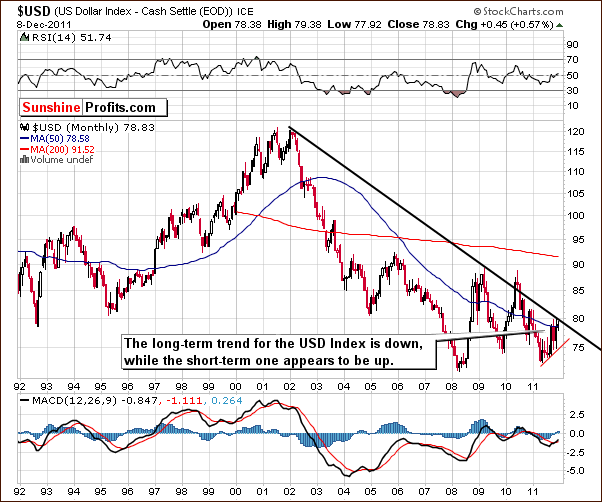
The above chart is quite similar to the one we presented last week. Very little has changed as the index saw higher price levels early in the week then declined. Thursday a small move to the upside was seen, but the index is still clearly below the long-term resistance line. The primary trend here remains down and any short-term move to the upside is likely to be small and short-lived.
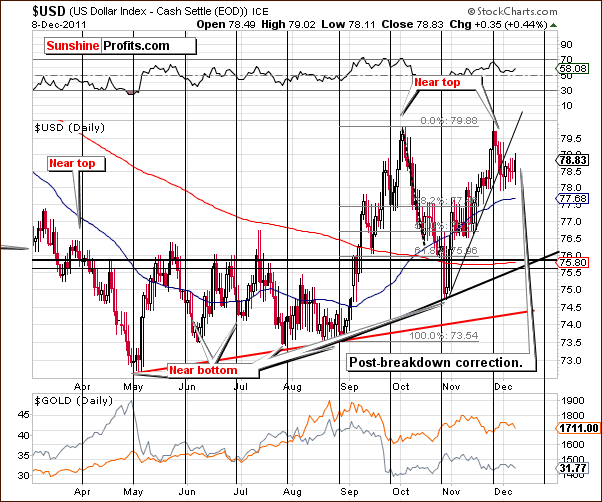
In this week’s short-term USD Index chart, we see that the recent rally clearly appears to be nothing more than a form of consolidation following the breakdown below the rising short-term support line. It is therefore likely to be followed by yet another decline, as no significant support line is in play at this time. The 50-day moving average will be encountered with a small move to the downside but this level has not really held as support or resistance in recent months.
If the index declines and does break down below the 50-day moving average, the rising, short-term support line created by previous bottoms would be the next resistance level to be encountered. This support line will come into play if the index declines by a bit more than 3% (from Thursday’s close). Such a move actually appears to be a realistic possibility at this time.
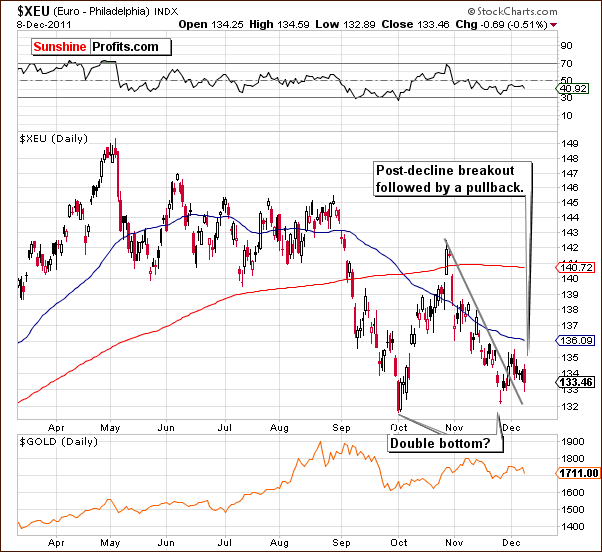
In this week’s short-term Euro Index chart, we see a confirmation of the points made with respect to the USD Index. Of course, the opposite situation applies here, as we are seeing a period of consolidation on the heels of a breakout above the declining resistance line. This pullback is quite normal, and with no additional resistance levels in play, the situation appears quite favorable for a period of rally to begin from here.
Whereas a double top has recently been seen in the USD Index chart, the Euro Index appears to have formed a double bottom over the past couple of months. Such trading patterns have been fairly common in many markets recently, including the precious metals. The significance of this development in the currency markets is that it could be an indication that the bottom is in for the Euro Index and that the top is in for the USD Index. If this holds true, it is likely to be a bullish sign for the precious metals sector.
Summing up, there is basically no change in the outlook for the currency markets this week. The sentiment remains bearish for the USD Index and bullish for the euro based on recent trading patterns and analysis of historical trends.
General Stock Market
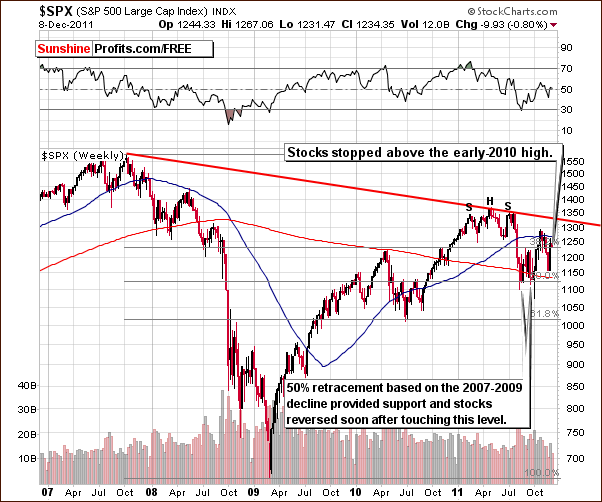
In the long-term S&P 500 Index chart, the index moved lower this week. Although daily moves have been quite volatile, the actual decline for the week has only amounted to about 0.8%. The current index level is still above the early 2010 highs which also coincide with the 38.2% Fibonacci retracement level. This retracement is based on the decline which began in late 2007 and lasted through early 2009. At this point, since the index is still above important support levels, the short-term outlook remains bullish.
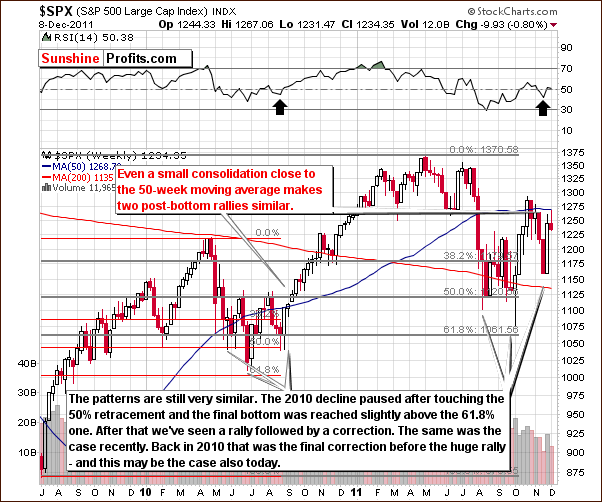
In the medium-term S&P 500 Index chart, we see a different and in our opinion even more interesting development. The current period of consolidation saw early-week moves to the upside and declines on Thursday. The index is now close to the 50-week moving average and this is a situation which was also seen near the middle of 2010. The trading patterns seen at that time were also quite similar to the price action of the past few months.
The implications here are bullish for stocks in general. Last year, when a period of consolidation was followed by a breakout above the 50-week moving average, a significant rally materialized. This rally saw the S&P 500 Index level rise from around 1125 to the 1340 level or so, a 19% increase in less than six months! A similar move could be seen once again in the coming months.
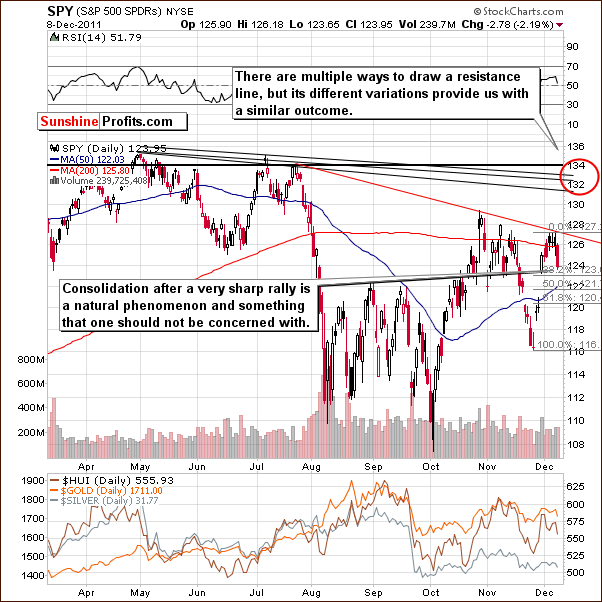
In the short-term SPY ETF, an initial target level close to the previous 2011 highs is still valid. This target ellipse is about 7% above Thursday’s closing level and is obtained by extrapolating several resistance lines created from previous local tops seen earlier this year.
The recent consolidation period has not been too big relative to the previous rally. Whereas the recent rally spanned a $17 range in this ETF price, the subsequent decline has only amounted to about $3. Price levels are still visibly above the 38.2% Fibonacci retracement level, and for this reason, the short-term outlook continues to be bullish here.
Summing up, once again, as we stated in last week’s Premium Update, numerous signals from analysis of charts this week indicate that the outlook is bullish for stocks. It appears that a significant rally is probable (60% or so) in the weeks ahead.
Correlation Matrix
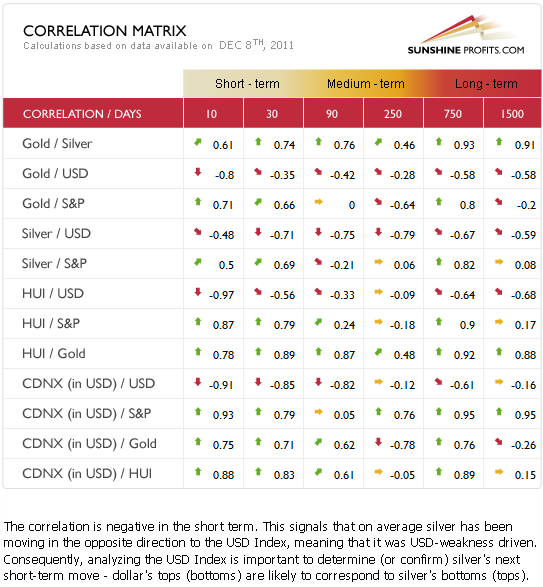
The Correlation Matrix is a tool which we have developed to analyze the influence in the weeks ahead of the currency markets and the general stock market upon the precious metals sector. In this week’s matrix, we see somewhat of a return to normalcy. Precious metals and the USD Index are negatively correlated in the short term and the metals have a positive relationship with the general stock market.
Although not always the case (that’s why we monitor it), this is the expected relationship between these markets. As the value of a dollar in relation to other currencies declines, precious metals prices, which are generally dollar based, would move higher. This is because more dollars (which are worth less each) are needed to equal the value of an ounce of gold or silver. This same principle hold for stocks priced in US dollars as well.
So with the outlook currently bearish (lower values ahead) for the dollar and stocks likely in an uptrend, the implications appear to be clearly bullish for the precious metals sector overall in the coming weeks.
Gold
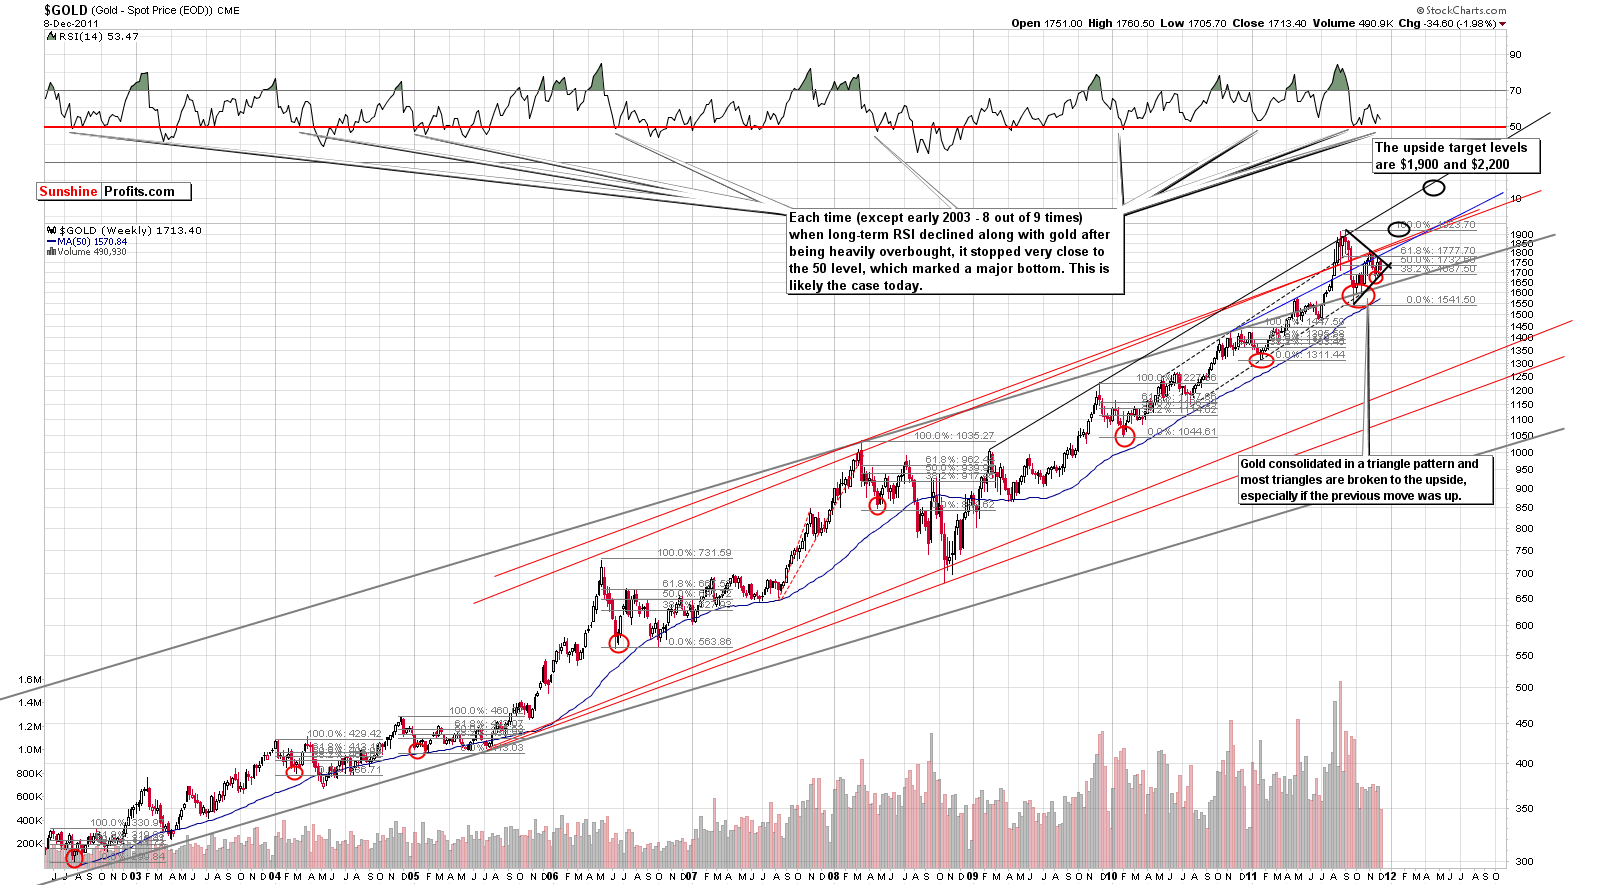
This week, we begin our gold section with a look at the very long-term chart (please click the above chart to enlarge). Gold has recently been in a triangle trading pattern which began in the middle of 2011 and appears to be ending now. An important note here is that triangle patterns are usually broken to the upside, especially if the preceding price action was also an uptrend. Since gold was rallying last spring, it is likely that the next move seen here will be to the upside. Once a breakout is seen above the short-term, declining resistance line which is currently in play, the target level for gold’s next move appears to be $1,900.
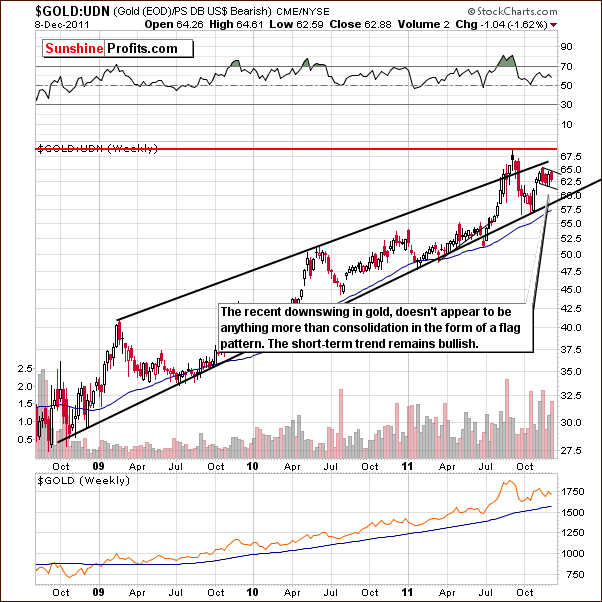
In this week’s long-term chart of gold from a non-USD perspective, very little has changed from last week. The powerful upswing which we saw at that time was followed by a slight decline. This has very little significance. The consolidating flag pattern formation seen presently indicates that a continuation of the previous trend is likely which would, of course, indicate a continuation of the rally. It appears that gold’s price from a non-USD perspective could surpass previous highs, although a period of consolidation in the trading range of the previous highs (above or below them) would be expected first. Indications are that significantly higher prices are quite probable in the weeks ahead.
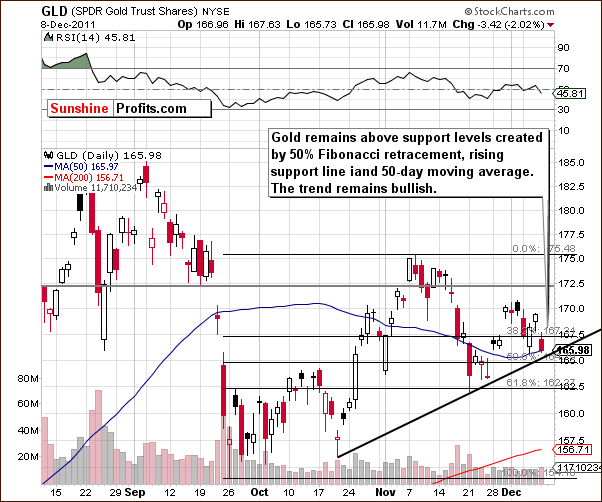
In this week’s short-term GLD ETF chart, the situation is not quite as clear, especially if we look at Thursday’s price action. The day began with a period of rally (before the markets opened) and then prices turned around and declined sharply. Since gold’s price is still above support levels, however, it is unlikely that further declines will be seen at this time. The trend therefore remains bullish.
Summing up, the outlook for gold overall continues to be bullish. Price action and declines seen on Thursday do not change our bullish sentiment and a $1,900 target level still appears valid for the coming rally.
Silver
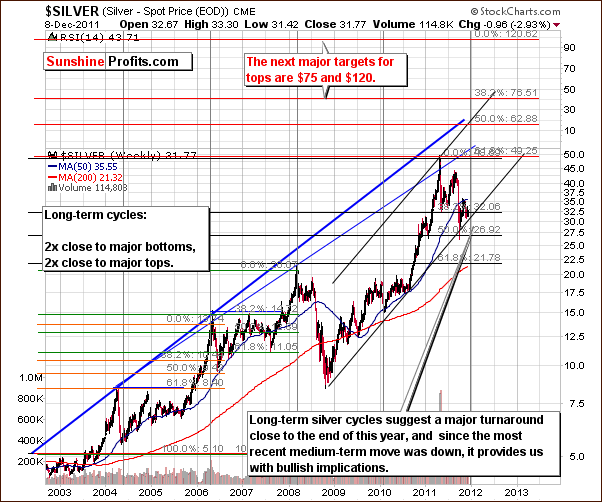
We begin our silver section with a look at the very long-term chart. Obviously Thursday’s decline really can’t be seen in this chart and we decided to feature this chart precisely to draw your attention to this fact. Note how insignificant the daily price action is in the whole scheme of things and in terms of the rally that we may see in a few days or weeks.
This chart is also useful in illustrating silver’s cyclical turning points. Note that the next vertical gray line is seen to be in play right now. With recent prices having been in decline and a turnaround likely, the outlook from here is bullish. Higher price levels appear just ahead for the white metal.
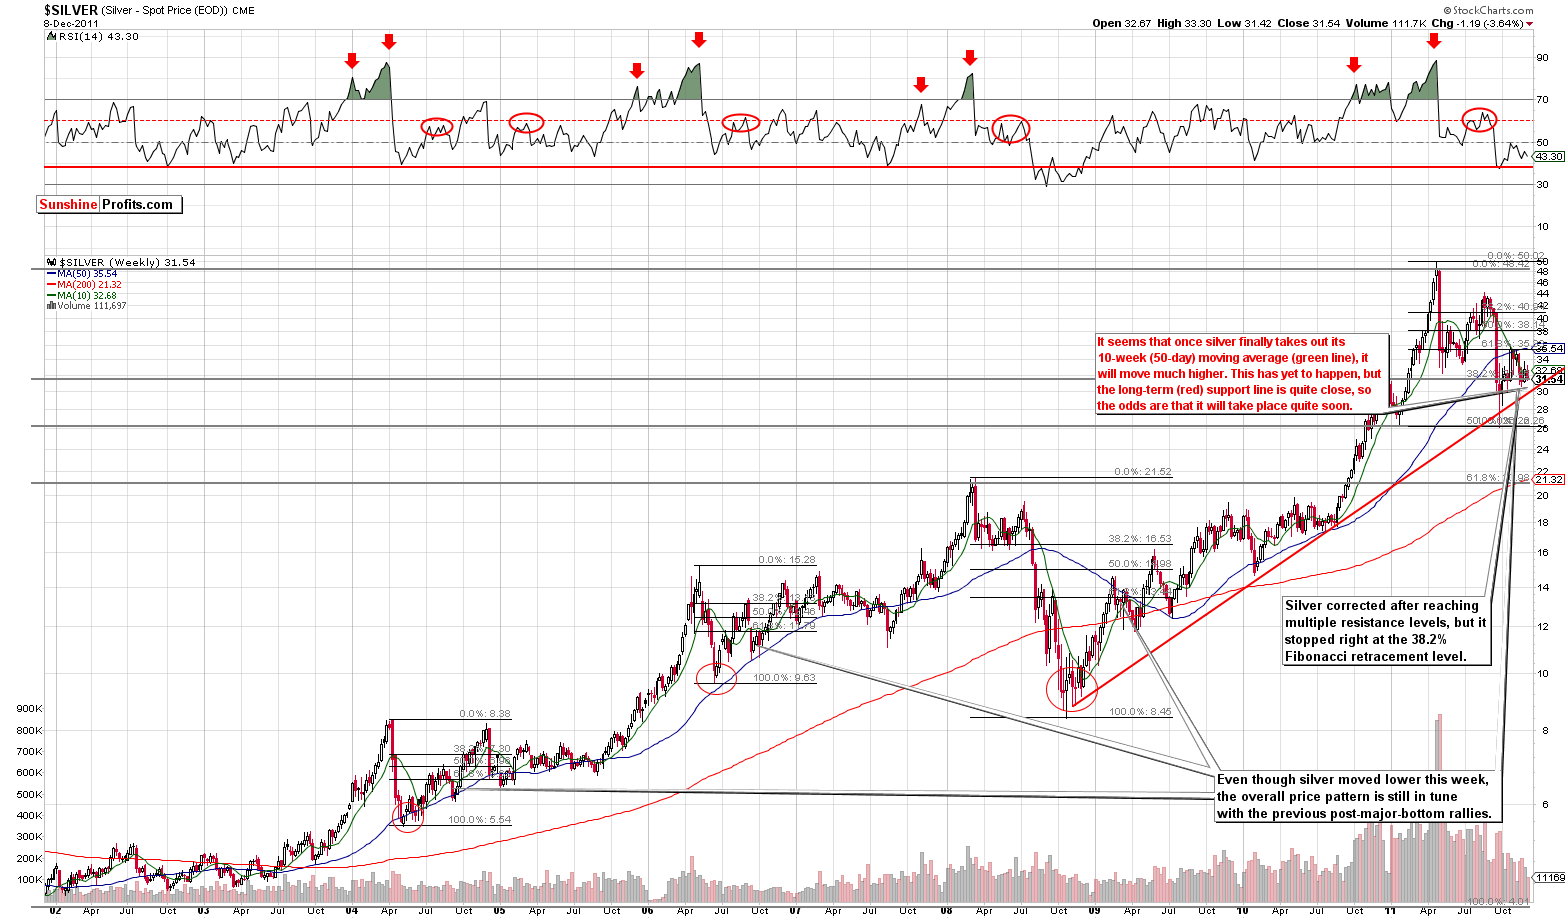
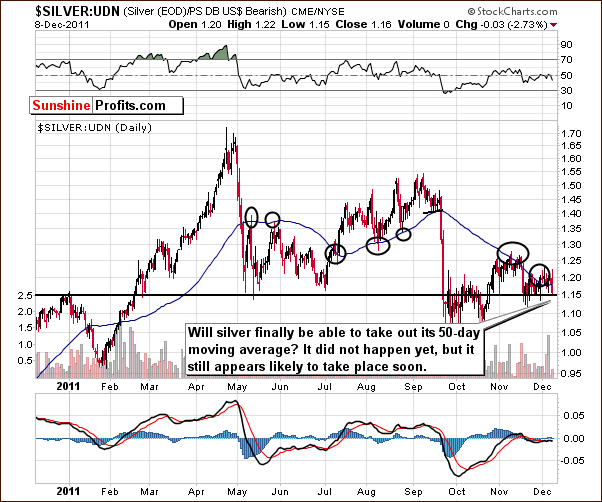
In this very long term chart for silver (please click the above chart to enlarge), not much has changed in the past week. Silver is still consolidating below the 10-week or 50-day moving average. Once this level is taken out, it seems that much higher prices are likely.
Silver is probably close to the end of its consolidation period, and with a long-term support line in play, it is quite likely that a rally will be seen soon. The recent period of sideways trading has caused little excitement for those who follow silver. However, if we look back to last year, there was a similar period where silver’s price moved very little over several months (April-July 2010) only to then begin a rally in which its price nearly doubled. The point is that the recent lack of excitement in the silver market does not in any way make a sharp rally from here less likely.
We now look at silver from a non-USD perspective in this week’s short-term chart. We see a number of our earlier points being confirmed here. With silver at a strong support line, it is likely that the period of consolidation is ending. Once the 50-day moving average is taken out, which will likely be soon, a rally here appears quite probable. Last July, a breakout above this resistance line opened the door for a move from the 1.30 level almost immediately to 1.44 and eventually close to the 1.55 level before the rally ended. History could once again repeat itself.
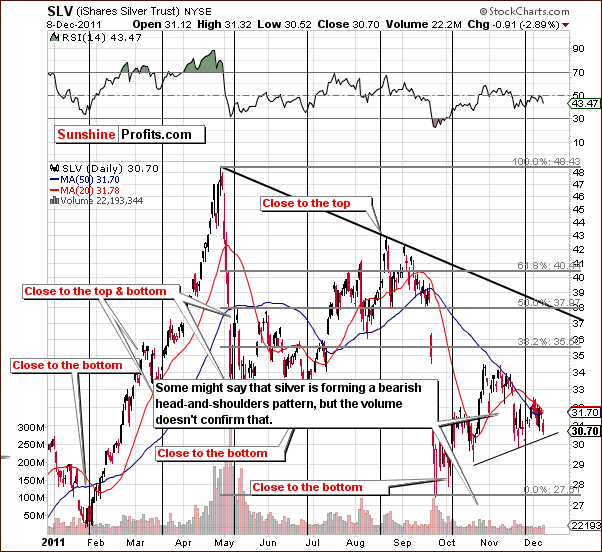
In the short-term SLV ETF chart, we see that price levels are presently above a short–term support line, but there appears to be a possible bearish head-and-shoulders pattern forming. Daily volume levels however, do not confirm a bearish sentiment as they have been quite low on moves to the upside as well as on price declines. The bearish pattern should therefore not be considered as a likely development. Since the signs do not point to further declines and a support level is in place, higher price levels seem more likely at this time.
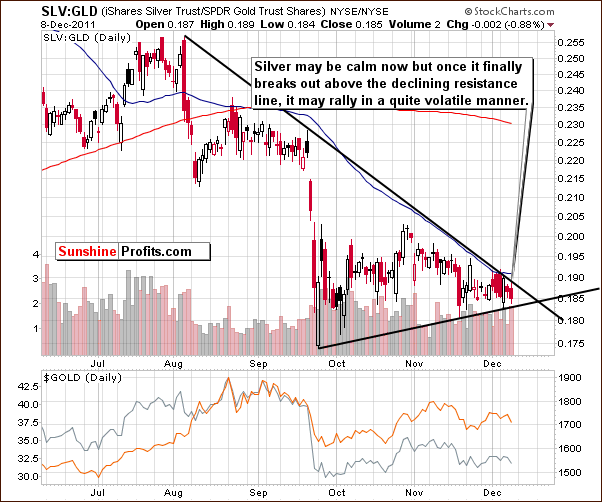
In the silver to gold ratio chart, we see that silver appears to be in a position where a breakout or breakdown could, in fact, be imminent. It seems probable that this ratio will move higher based on factors discussed previously in this update. Furthermore, with silver typically moving quite sharply (when it finally moves), it appears that its next move can take silver much higher after the breakout – in terms of the ratio and spot price.
Summing up, the outlook for silver continues to be bullish in spite of Thursday’s price action. It still appears that the $40 level is a valid target for the weeks ahead.
Gold and Silver Mining Stocks
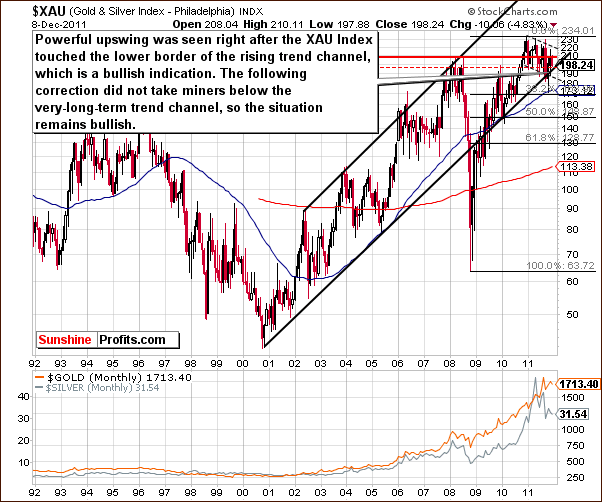
In this week’s very-long term XAU gold and silver miners’ index chart, we see that the index has corrected after a very sharp rally but has not moved below the rising long-term trend channel. Since this level was touched but not broken, the long-term outlook remains bullish for the miners at this time.
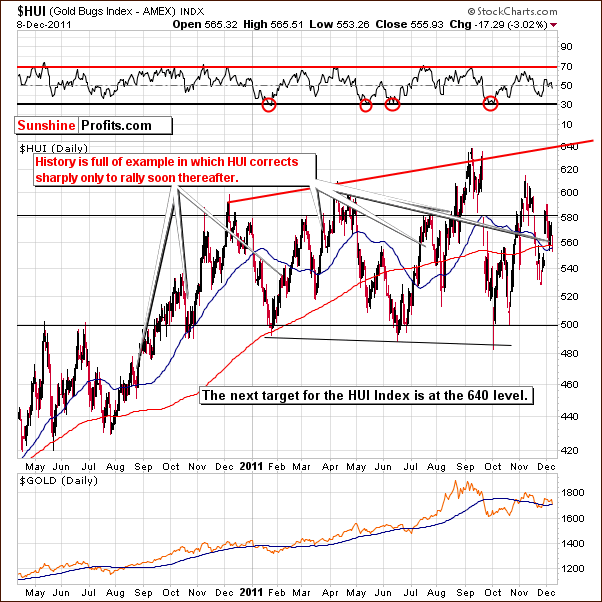
In this week’s long-term HUI Index chart, we see a sharp decline, but it was far less dramatic than the rally which preceded it. Examples of such corrections are quite common in gold stocks and are often followed by subsequent rallies. Investors should not worry about catching each and every move in this sector (it’s impossible). Since it appears that a rally from here is likely, betting on higher prices at this time seems like a good idea.
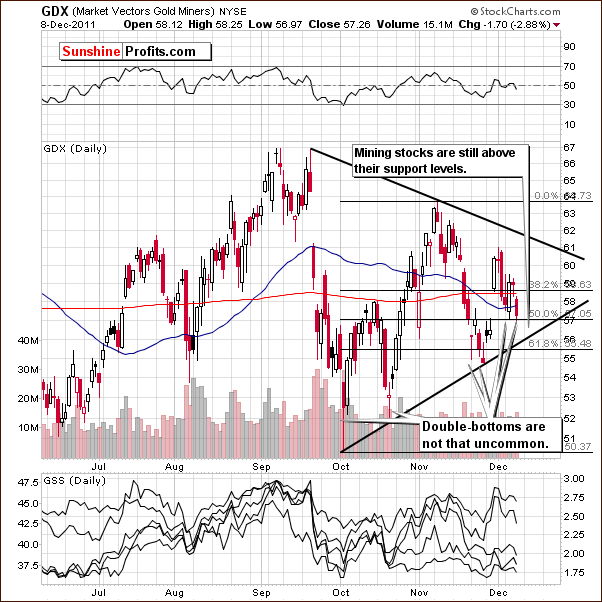
In this week’s short-term GDX ETF chart, once again we see a triangle pattern where the GDX ETF is trading below the declining resistance line and above the rising support line. Price levels are visibly above the 50% Fibonacci retracement level and the rising short-term support line. Both are key levels. The trend remains up here, a point consistent with all the precious metals charts in this week’s Premium Update.
Summing up, the outlook for mining stocks continues to be bullish at this time. This is consistent with the sentiment for the underlying metals as well.
Gold Juniors – Update
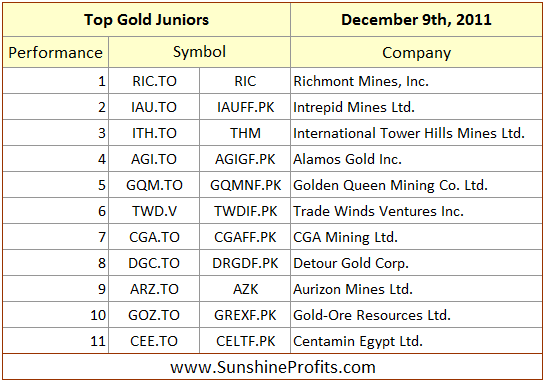
Based on gold’s recent price action and the significant probability that gold will move above $1,900 and verify it as support we have decided to remove Orvana Minerals Corp. (ORV.TO) from our ranking. These two events are related because of Orvana management’s decision to hedge part of their production. They made a “collar” deal with Credit Suisse, in which Orvana gets at least $1,550 per oz of gold, but not more than $1,855. So, if gold goes below $1,550, Orvana gains thanks to this strategy and Credit Suisse loses. With gold above $1,855, Orvana loses and Credit Suisse gains. Between those two price levels, the parties are largely unaffected by the deal.
We believe that in the coming months and years prices above $1,855 are much more likely (more than five times more likely) than prices below $1,550, so in our view Credit Suisse made a good deal, and Orvana did not. Orvana effectively decreased its exposure to the price of gold, which we don’t like, as it means that with higher gold prices (which we expect to see) this company is likely to underperform other companies that did not hedge their production. Therefore, we believe that if you own shares of Orvana Minerals Corp., it would be best to sell them and use the proceeds to purchase other companies from the above ranking.
Letters from Subscribers
Q: How I can hedge my bullion exposure in India? Should I sell or buy rupee against USD for that purpose? I don’t want to lose money when USD depreciates against INR. Is this a good idea to do that?
A: In general, hedging against the dollar's depreciation vs. the rupee means that you want something that will provide you with compensation should that take place.
So, you're worried about USD's moving down, so you should short USD because in this case you will gain from this move lower. We are talking about a move in terms of rupee, so the other leg needs to be in terms of this currency. So, you will go long rupee.
Therefore, for contracts quoted as USD:INR, you will need to short them in order to hedge your position. In other words, you "sell USD in rupees."
Here's how it would work: if the price of gold doesn't change but USD moves lower against rupee, the value of your gold assets in terms of rupee will decline (an ounce of gold will still be worth, say, $1,750 USD but $1,750 will be worth less in terms of rupee). However when you sold USD in rupee / shorted a USD:INR contract, you gained from dollar’s move lower from this contract. If the value of the contract corresponded to the value of your gold holdings, your overall position would be almost unaffected by dollar's move lower.
Whether this scheme is a good idea or not is a different matter. From the long-term point of view, gold is likely to rally in terms of all currencies, so you might want to buy more gold rather than spend money on fees associated with hedging. However, if you want to speculate on short-term moves and you analyze gold from the USD perspective, then yes, hedging in order to trade gold from the USD perspective (the one that you analyze it in) appears to be a good idea.
Q: If past success is predictive of Mr. Radomski’s future accuracy, the benefit is going to be easily worth the subscription. I am very grateful to you for providing this analysis, including the free previews. Is he a CMT? I want to study Mr. Radomski's methods and interpretations of data in greater detail.
Elliott Wave International and Jim Bell (www.bellstrategic-investments.com) have a very bearish outlook on the Dow and the S&P. Mr. Radomski uses Fibonacci numbers so maybe he is aware of these ideas?
A: Thank you for your kind words, it means a lot to me. I’m not a Chartered Market Technician, but I’m on my way to become a Chartered Financial Analyst (I’ve successfully passed 2 of 3 exams and I’ll soon start preparing for the third exam in June 2012). Please remember, though, not to take anyone's (including your editor's) price predictions as a sure bet. This leads to taking excessively large positions (investing too much or using too much money for trading), which can result in losses over time.
If you've already gone through the Key Principles section, we encourage you to review the Research section on our website - in particular, we'd like you to turn your attention to the Universal Investor essay, which deals with position sizing. We won't mince words - it's not the most entertaining, but it's quite important.
Elliott Wave Theory
Recently a subscriber asked if we could comment on article he found based on the Elliot Wave Theory, a topic we covered in the January 21st Premium Update. We were asked to comment on an essay featuring this technique, and before we managed to do so, it proved to fail once again. There might be markets where it works really well for FUTURE PRICES (it's very easy to draw these 12345abc patterns on past prices and make it appear as if it works), but we still don't consider it really useful for the precious metals market. Here is what we wrote then (and also more than 2 years ago):
Elliott Wave Theory is a part of technical analysis, and as such it is more of an art than a science. Therefore, it is impossible to prove that it is either good or bad for any market. I have personally not found it particularly useful. When gold broke through the $400 level I remember many Elliott Wave analysts writing about imminent correction to the $200 area, which never happened. I understand that these wave patterns often do occur, but I have found them easy to spot and reliable only in hindsight. Of course EW analysts have more experience in reading these waves and I don't claim to be an expert in that field.
Summary
The situation in the USD Index remains bearish in spite of the rise in the index level on Thursday. This move appears to have been nothing more than part of a short-term consolidation period.
In the general stock market, the opposite is true. Thursday’s decline was likely just a small consolidation after recent moves to the upside. It seems most probable that additional higher prices for stocks will be seen in the weeks ahead.
With the negative correlation between the dollar and precious metals and the positive correlation between the metals and stocks, there are bullish implications for precious metals and mining stocks. Furthermore, the markets within the precious metals sector have recently been trading above key support levels and are likely to move higher soon. Strong resistance lines are not in place and this combination of factors could take gold to $1,900, silver to $40 and the HUI Index to 640. These appear to be reasonable initial target levels and even higher levels could be reached after a pause in the rally for some consolidation.
Before ending today’s update, we would like to share with you what one of our subscribers sent us. It did make us smile, so we're pasting it here as well. In case you already own precious metals and you were wondering if there's anything else that one can do about the ubiquitous grim news about the economy - take a look.
...here are five and a half minutes of Sunshine. Maybe you have not seen this song video before. It will make you smile - - - I'm certain.
The Jive Aces, "Bring Me Sunshine"
http://www.youtube.com/watch?v=oXvJ8UquYoo
This completes this week’s Premium Update. Our next Premium Update is scheduled for Wednesday, December 14, 2011 (two days early).
Thank you for using the Premium Service. Have a great weekend and profitable week!
Przemyslaw Radomski

