
There is palpable fear in the world and the urgency could be felt in the new strategy unveiled Wednesday morning by the world’s major central banks to bolster the financial system by increasing liquidity in the financial markets. In response, stock markets surged with joy with the S&P up 4.3 per cent. The move dragged down the dollar, bolstered the euro and pushed gold prices 2 per cent higher to finish November with a 1.9 per cent rise.
In effect, the Fed will be handing money to other global central banks at a lower rate than in the past and those central banks, in turn, will be able to lend the dollars to banks in their own countries. The hope behind this move is that it will prevent Europe’s financial woes from undermining the stability of the global banking system.
The Federal Reserve, European Central Bank and central banks in Canada, Britain, Switzerland and Japan said in a joint announcement that they will lower the interest rate paid on “swaps,” used to funnel dollars to the banking systems of countries where there is need. The Fed will lend dollars to the other central banks, the European Central Bank, for example, in exchange for euros. The ECB will pay interest, and in turn will lend out the dollars to banks in the eurozone that have obligations in dollars but are temporarily unable to borrow dollars to meet them. Normally banks can borrow the dollars they need from other banks, but in crisis mode, banks tend to hoard their cash and are fearful to loan it out.
“The purpose of these actions is to ease strains in financial markets and thereby mitigate the effects of such strains on the supply of credit to households and businesses and so help foster economic activity,” the banks said in a statement.
Earlier on Wednesday, China had its own declaration that it is dropping its reserve requirement ratio for banks by 0.5% for the first time in nearly three years. The move reduces the amounts that banks must keep in reserve and frees up funds for lending, in effect easing monetary policy, a signal from China that it wants its economy to grow and it will accept more commodity imports. Both the coordinated central bank move and the Chinese move are bullish fundamental factors for stocks and commodity markets, including precious metals.
It may take some time for people to figure this out, but the problem is not liquidity. The problem in Europe is sovereign debt. If we are over our heads with debt because we have spent more than we make, giving us a line of credit will not get us out of the hole. One wonders if any amount of funding support and bailouts will be enough to restore confidence as long as there are lingering doubts about the solvency of Italy, Spain and some of the other eurozone economies.
Last week, the crisis reached a worrying new stage, with the flop of the German bond auction and the alarming rise in short-term rates in Spain and Italy. This is a massive erosion of trust, a veritable creeping crisis of credibility, as it spread to France, Belgium, the Netherlands and Austria. Many took Italy’s disastrous bond auction last Friday as a signal that time is running out. Italy sold 6-month bills at a rate of 6.504%, a 14-year high and nearly double the 3.535% rate it received from a similar auction last month.
Early in the week the Organization for Economic Cooperation and Development said the euro crisis remained “a key risk to the world economy.” The Paris-based research group sharply cut its forecasts for wealthy Western countries and cautioned that growth in Europe could come to a standstill. It warned that the problems that started in Greece almost two years ago would start to infect even rich European countries.
Some international companies are already preparing contingency plans both financial and legal for a possible eurozone breakup, according to the Financial Times.
The general opinion of dozens of business executives interviewed by the Financial Times this month is that although a eurozone break-up would be both undesirable and fiendishly difficult to plan for, to cross one’s fingers and hope for the best is emphatically no longer an option.
Apocalyptic visions considered in boardrooms across Europe range from bank failures and the collapse of credit to the destruction of the EU’s single market, mass social unrest and a recession or worse. Even the most benign of that range of outcomes would have repercussions well beyond the eurozone – making the issue one of consequence to businesses and government officials worldwide.
Analysts at UBS Investment Research have written of a worst-case-scenario recession that could shrink the continent’s weaker economies by half, and Germany’s by 20 percent or more.
An editorial this week in the Washington Post notes the irony in the fact that the future of the world could hinge on Germany’s decisions, something which the great power politics tried so hard to prevent in the 20th century.
Yet, here we are, a decade into the 21st century, and all eyes are on Berlin as the world searches for signs that the Germans will use their economic might to rescue Europe’s currency and, with it, the world economy.
German tax payers are understandably reluctant s to bail out insolvent countries even though Germany profited handsomely from the spending spree by the citizens of countries like Greece.
On November 23 we sent you a message saying that the short-term outlook for the precious metals market is bullish and that if you had been waiting for a good buying opportunity, now would be a good time. Gold is about $70 higher since then. To see if there are more sunshine profits coming out way let's begin this week's technical part with the analysis of the USD Index. We will start with the very long-term chart (charts courtesy by http://stockcharts.com.)
USD Index
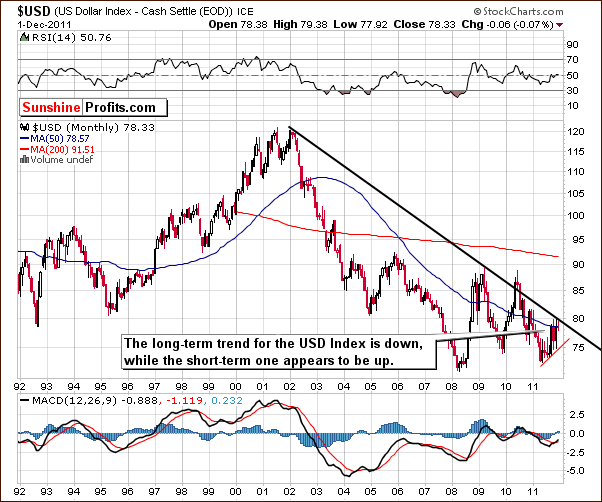
In the very long-term USD Index chart, the situation has changed little from our November 18 Premium Updatewhere we wrote that “an important resistance line just below the 80-level not that far from Wednesday's close. Even if the rally continues from here, it is not likely to go much higher.”
The same holds true today from this very long-term perspective of the dollar. At this time, it seems more likely that the short-term support line will be broken rather than the long-term resistance line being surpassed. Overall the picture is bearish from this chart.
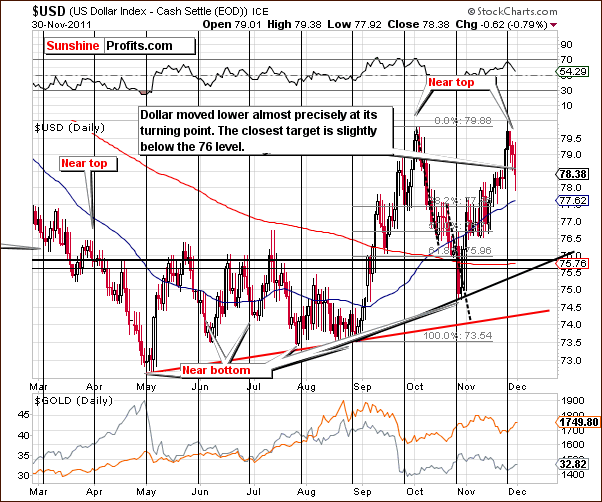
In this week's short-term USD Index chart, we see that the index moved lower precisely at the cyclical turning point and is now likely in a downtrend. This has driven precious metals prices higher. The first meaningful support line is close to the 76 level and the next around 74.50. Previously when the USD Index was in this trading range, precious metals prices were much lower. For this reason, further declines in the USD Index from here could send precious metals prices significantly past their November highs.
Summing up, the short-term outlook for the USD Index appears to be bearish at this time. The index reversed direction recently and is moving lower. Support lines are about 3% and 5% below Thursday's closing index level.
General Stock Market
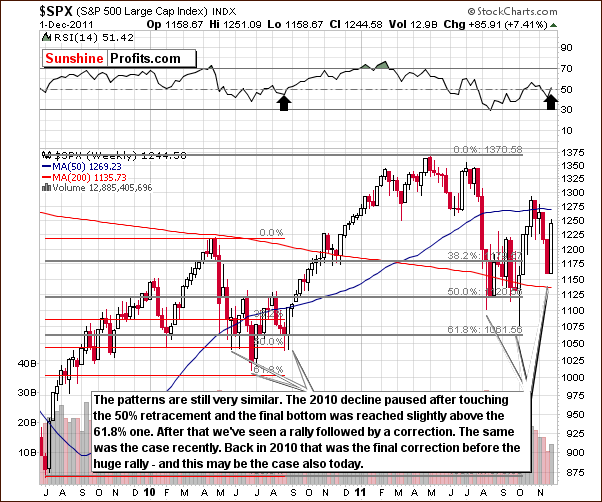
In the long-term S&P 500 Index chart, we see quite a different picture. The situation is very bullish and similar to what was seen in the middle of 2010. Two local bottoms at that time were followed by a rally and we now see a similar pattern developing.
We mentioned the possibility of a correction in our October 21 Premium Update: “Back in 2010 we've seen another move lower before prices rallied. We cannot rule out a similar pattern also this time. Even if this materializes, it will not invalidate the bullish case...” This is precisely what seems to have taken place though probably invalidated by this week's sharp rally.
The trend now is to the upside and this is confirmed by both: analysis of trading patterns and RSI levels. There is a strong analogy with stocks' mid-2010 price action and if this continues, the S&P could move above 2011 highs and possibly to new all-time nominal highs. In either case, stock prices appear to be poised to move to the upside.
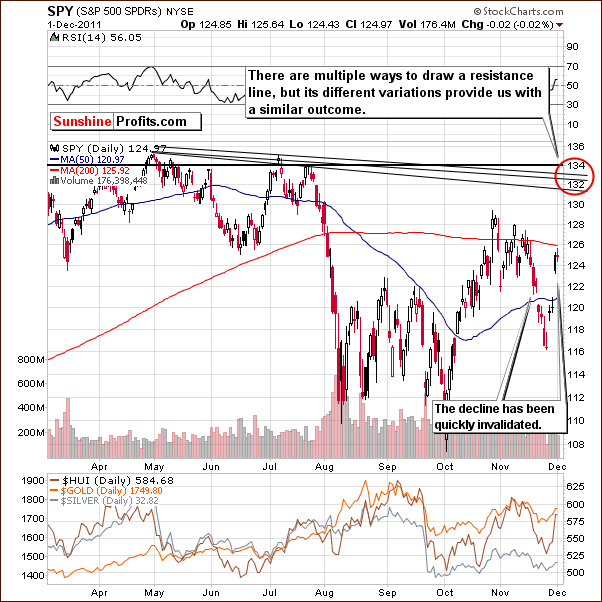
In the short-term SPY ETF, the next target level appears close to the 2011 high and even though this may not be the final top for this rally. It could in fact be an intermediate top with a period of consolidation possible once reached.
Summing up, numerous signals from analysis of charts this week indicate that the outlook is bullish for stocks. It appears that a significant rally is probable (60% or so) in the weeks ahead.
Correlation Matrix
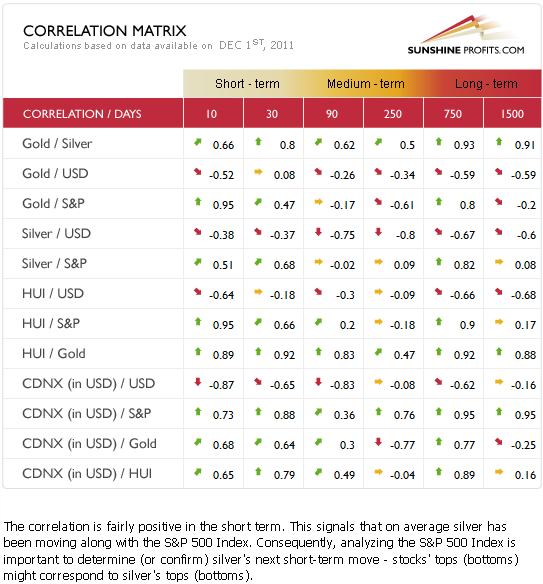
In this week's Correlation Matrix - a tool which allows us to see the impact of the currency and stock markets upon the precious metals - the implications overall are positive for precious metals. Stocks are positively correlated in the short term with the precious metals and the bullish outlook for stocks is therefore positive news for gold, silver and gold and silver mining stocks.
The USD Index has slightly more negative values than in our last update and the relationship with metals is in reality more negative than it appears. The reason for so weak correlation coefficients is the fact that precious metals simply barely responded to the negative influence of the dollar during its previous rally.
Gold
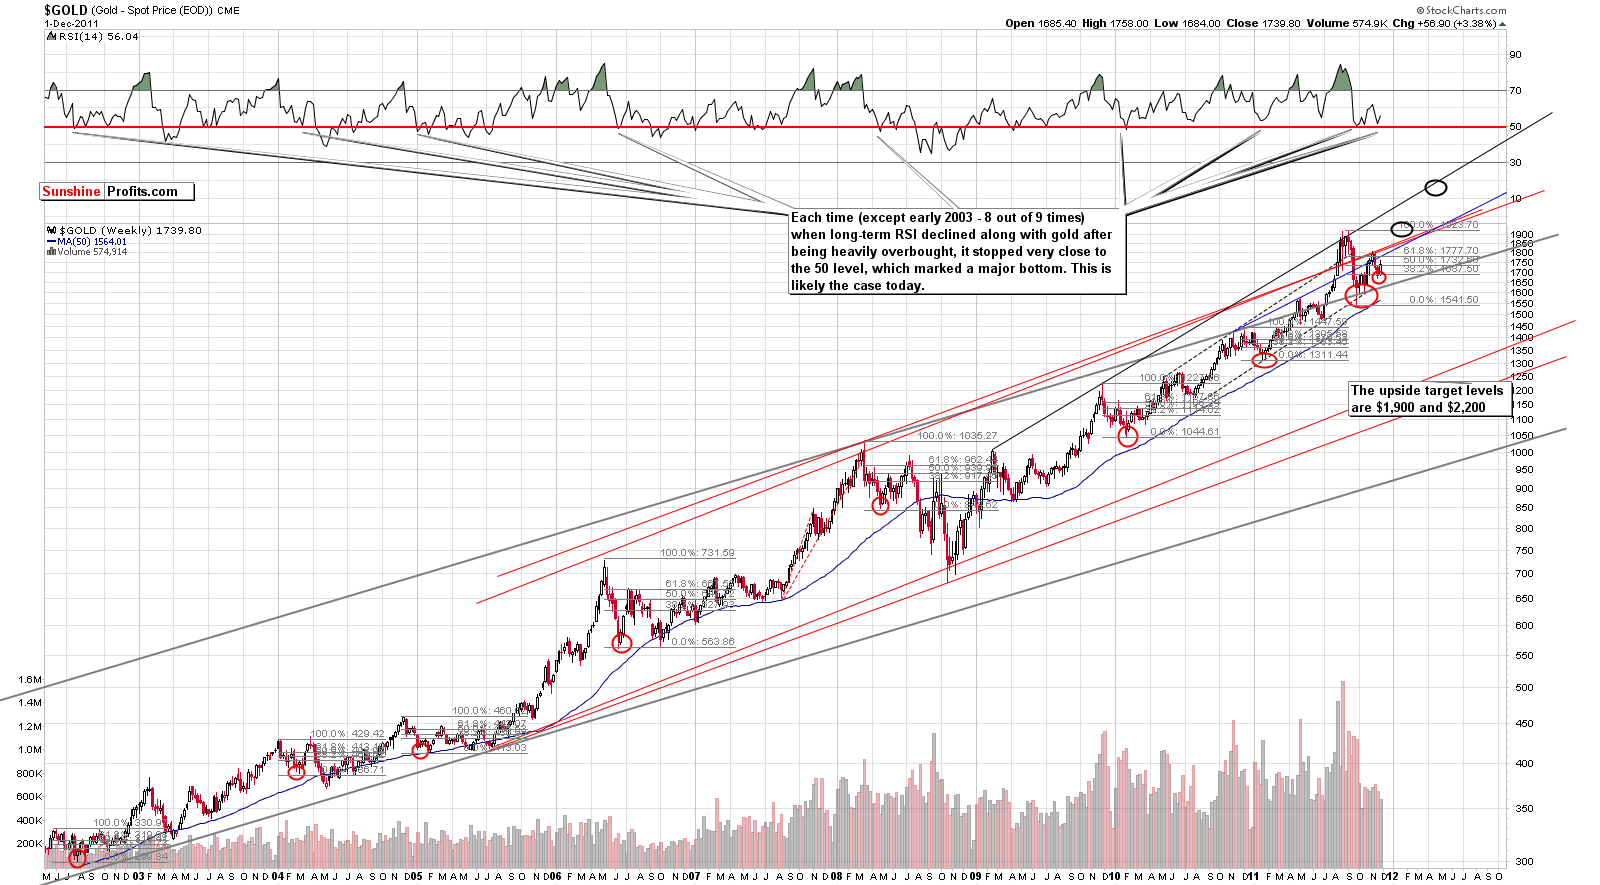
This week we begin our gold section with a look at the long-term chart (please click on the above chart to enlarge it). RSI levels have bottomed close to the 50 level and are now on the way back up. In 8 of the 9 previous times this level was reached, it coincided with an important bottom for gold, and a significant rally followed. The long-term implications here are bullish based on this.
Two upside target levels appear to be valid at this time. One is at the $1,900 level and could be reached late this year or early in 2012. The second target level could be described as a rough estimate or best guess at this time. It is at the $2,200 level and could be reached sometime around May of next year.
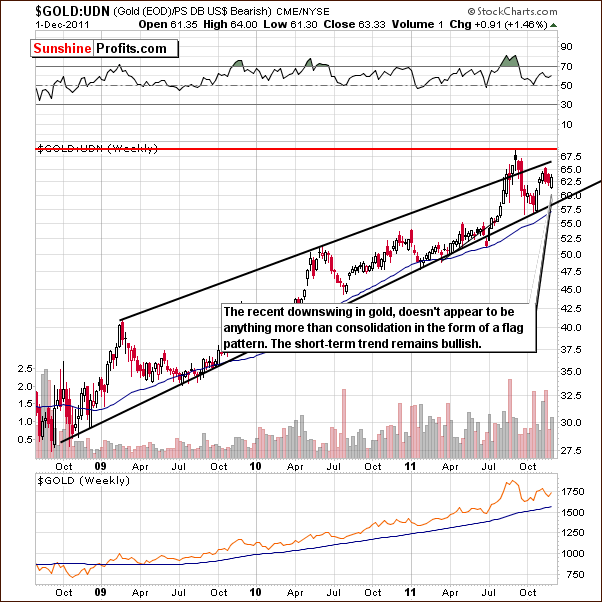
In this week's long-term chart of gold from a non-USD perspective, we see that prices have rallied sharply over the past few weeks and recently corrected in a sort of flag pattern. The rally appears ready to continue with a likely target level in the range of the previous high. This level could be surpassed, but it's likely that first a pause will be seen when this trading range is reached.
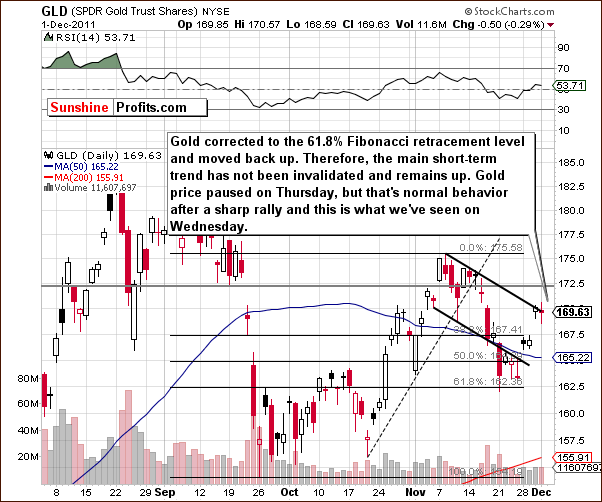
In this week's short-term GLD ETF chart, we see that gold has corrected about 61.8% of its September to November rally. This appears to be a classic consolidation within an uptrend. Consolidations are necessary to cool emotions and to build a base to for a bigger move to the upside. Thursday's pause after Wednesday's huge rally is not a bearish sign but rather quite normal after a sharp upswing. Being on the long side here still appears to be appropriate.
Summing up, the situation remains bullish for gold in the short, medium and long term. A $1,900 target level could be reached within the next four to six weeks with $2,200 possible a few months later.
Silver
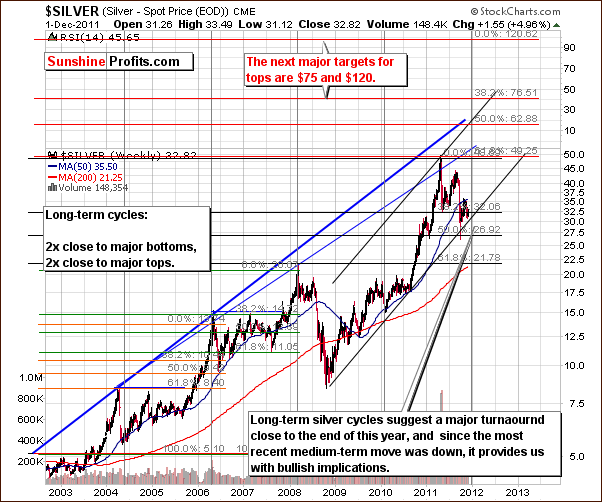
We begin our silver section with a look at the very long-term chart. The five vertical grey lines represent cyclical turning points roughly 2 years apart and they correspond to major tops or bottoms. The tops were seen in 2006 and 2008 with bottoms reached in 2004 and 2010. The cyclical turning point in play now is more likely to coincide with another bottom. This means that a major rally could be just ahead.
Long-term target levels for silver based on the phi number (1.618) are at $75 and $120. These are long-term target levels, however. Please examine how reliable were the previous tops' estimates based on analogous approach.
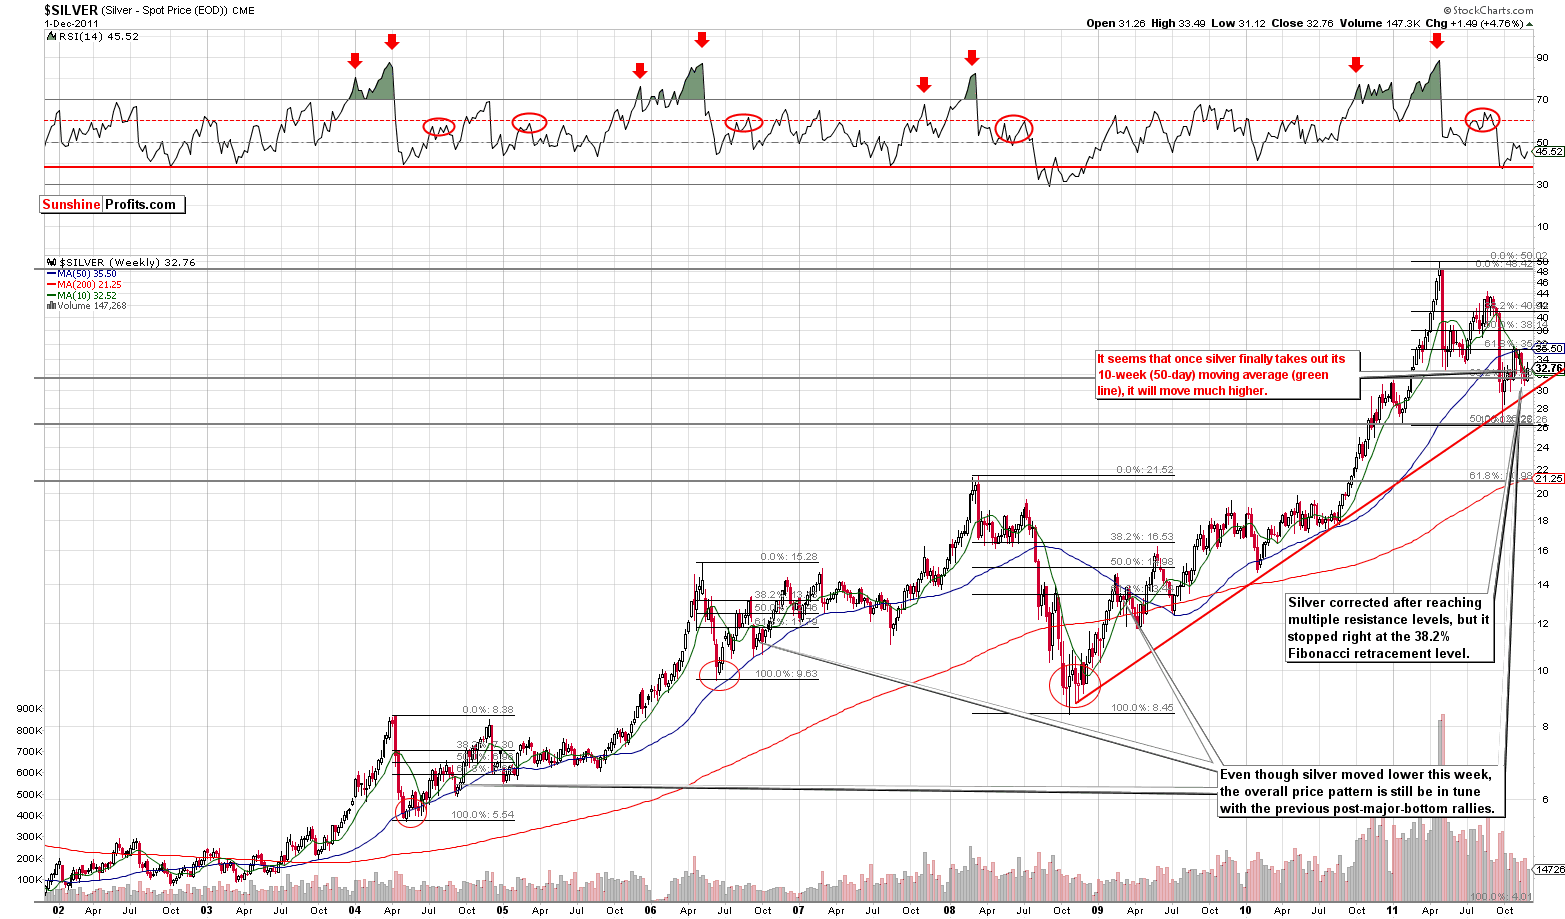
In this week's long-term chart for silver (please click the above chart to enlarge), we can see a struggle to move above the 50-day (10-week) moving average. This level has previously provided both support and resistance, and once it is taken out and the breakout verified, a considerable move to the upside is likely.
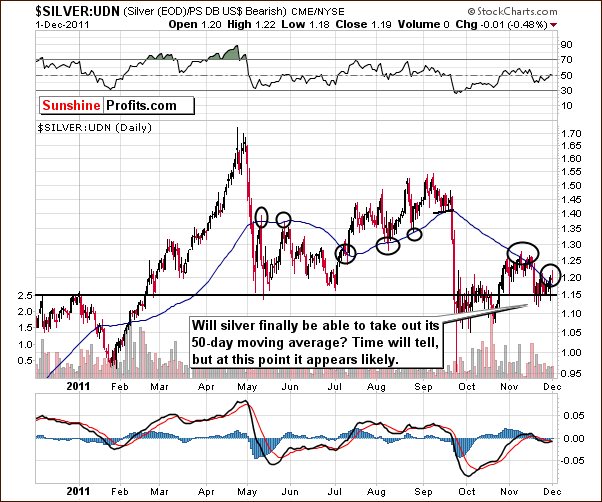
We now look at silver from a non-USD perspective. The 50-day moving average is once again in play here and has provided both support and resistance in the past. The index level is now slightly above this resistance line but we would prefer the move to be a bit more visible before concluding that the breakout is verified. It seems likely that significantly higher prices will follow such a confirmation.
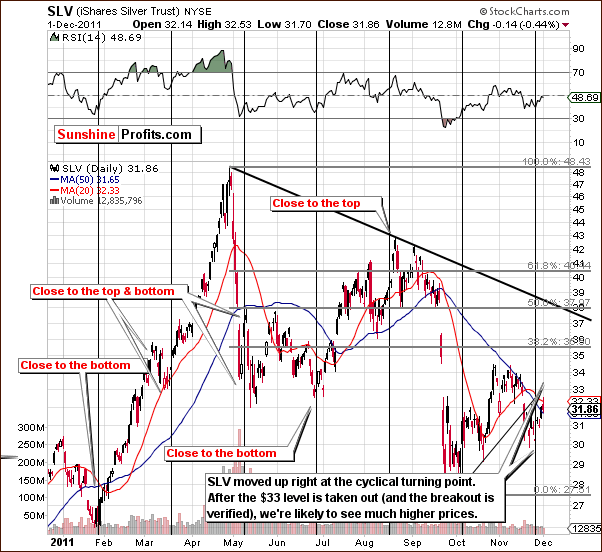
In the short-term SLV ETF chart, we can see that silver rallied sharply right at the recent cyclical turning point. The 50-day moving average is once again in play here, and a verified move above it will make a significant move to the upside quite probable. Target levels at this time appear to be at the $38, which corresponds to around $40 for spot silver.
Summing up, the outlook for silver is quite bullish, very similar to what we saw for gold. At this time, analysis of the long-term cycles for the white metal strongly supports a bullish scenario.
Gold and Silver Mining Stocks
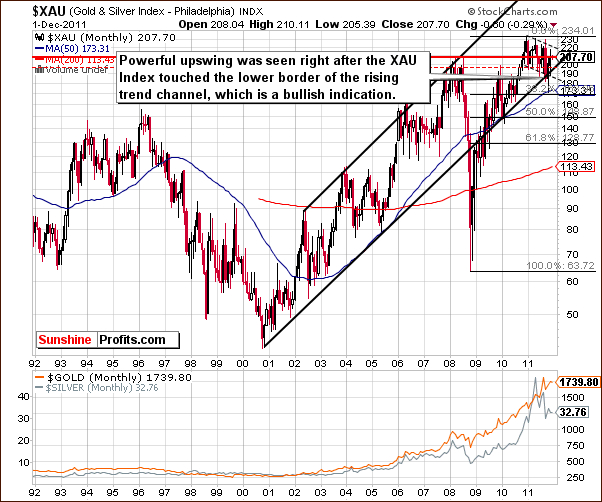
In this week's very-long term XAU gold and silver miners' index chart, we see that much of what we stated in our November 18 Premium Update has been seen:
We see that the XAU index is once again at the lower border of its rising trend channel. This level has been broken temporarily in the past, but prices soon reversed and the breakdown was invalidated. Therefore, the lower border of the trading channel is still an important support line.
The subsequent move to the upside did not surpass previous highs, but today, it seems that taking the current, long-term uptrend into account, higher price levels are quite likely from here.
The bounce here was powerful and is a suggestion that the main trend is still to the upside for mining stocks even though their 2011 performance has been a big consolidation.
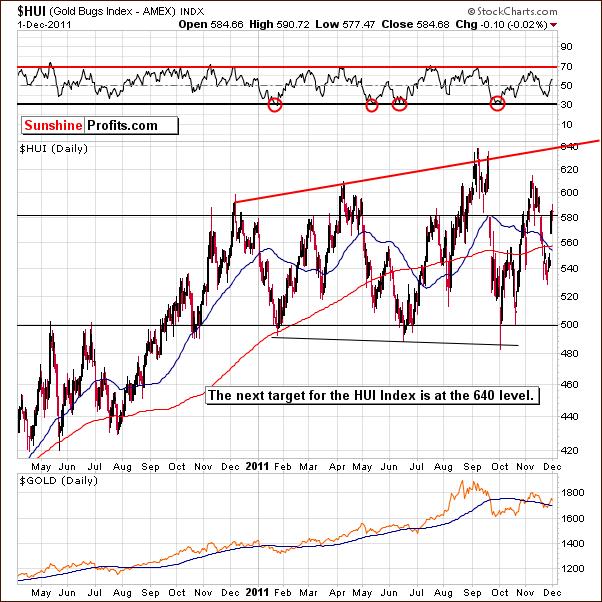
In this week’s long-term HUI Index chart, we can arrive at a target level close to 640 be extrapolating from previous tops. This shows us that the current rally still has the potential of further moves to the upside. Long positions in gold stocks still appear to be justified. Here's what we said two weeks ago about this particular index:
Based on our experience, the sure-bet move in the HUI index to the 500 level will likely not happen. If everyone has already discounted the move to the 500 level, they have already sold, which might have contributed to the recent correction. The decline toward 500 in the HUI Index simply seems too obvious, especially the levels reached by another proxy for the mining stocks – the XAU Index.
The bullish implications still hold true today.
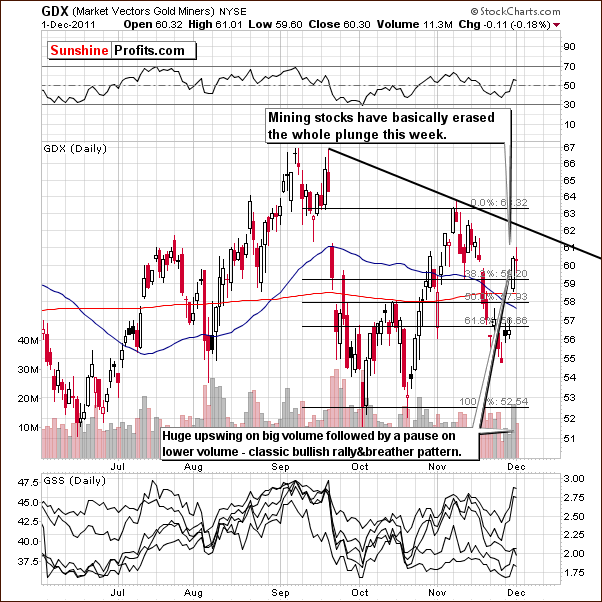
In this week’s short-term GDX ETF chart, a proxy for the precious metals mining stocks, the short-term resistance line is now just above where prices close on Thursday. It seems unlikely that this level will hold the rally in check for more than a few days.
The recent volume levels confirm a bullish outlook here as high volume has accompanied moves to the upside and pauses in the rally have had low daily volume levels. The main trend appears to be up and Thursday's price action seems to be merely a slight break in the rally.
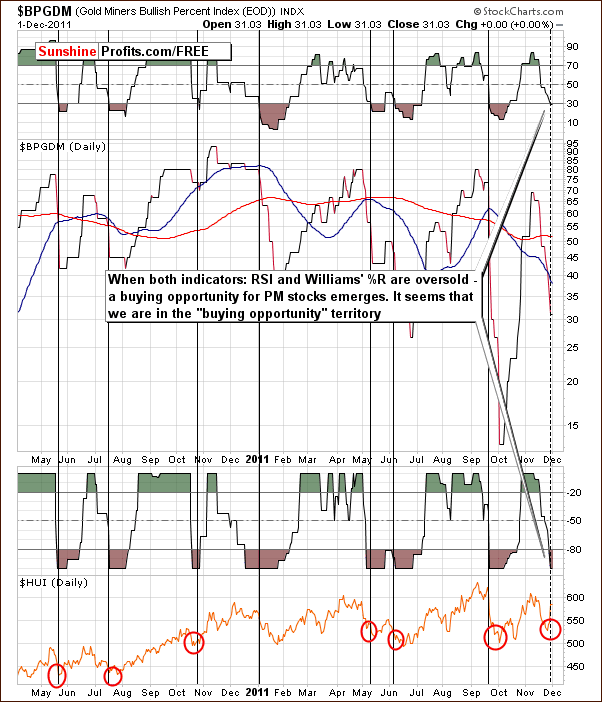
We now turn to the Gold Miners Bullish Percent Index chart, which is a tool we discovered several years ago to be quite interesting and reliable. We have included this chart in our Premium Update several times a year and have found that it's best to look at it through two indicators. When the RSI level and the Williams' %R both in oversold territory, it seems that a buying opportunity is presenting itself. Such is the case at this time and this confirms points made previously in this week's Premium Update.
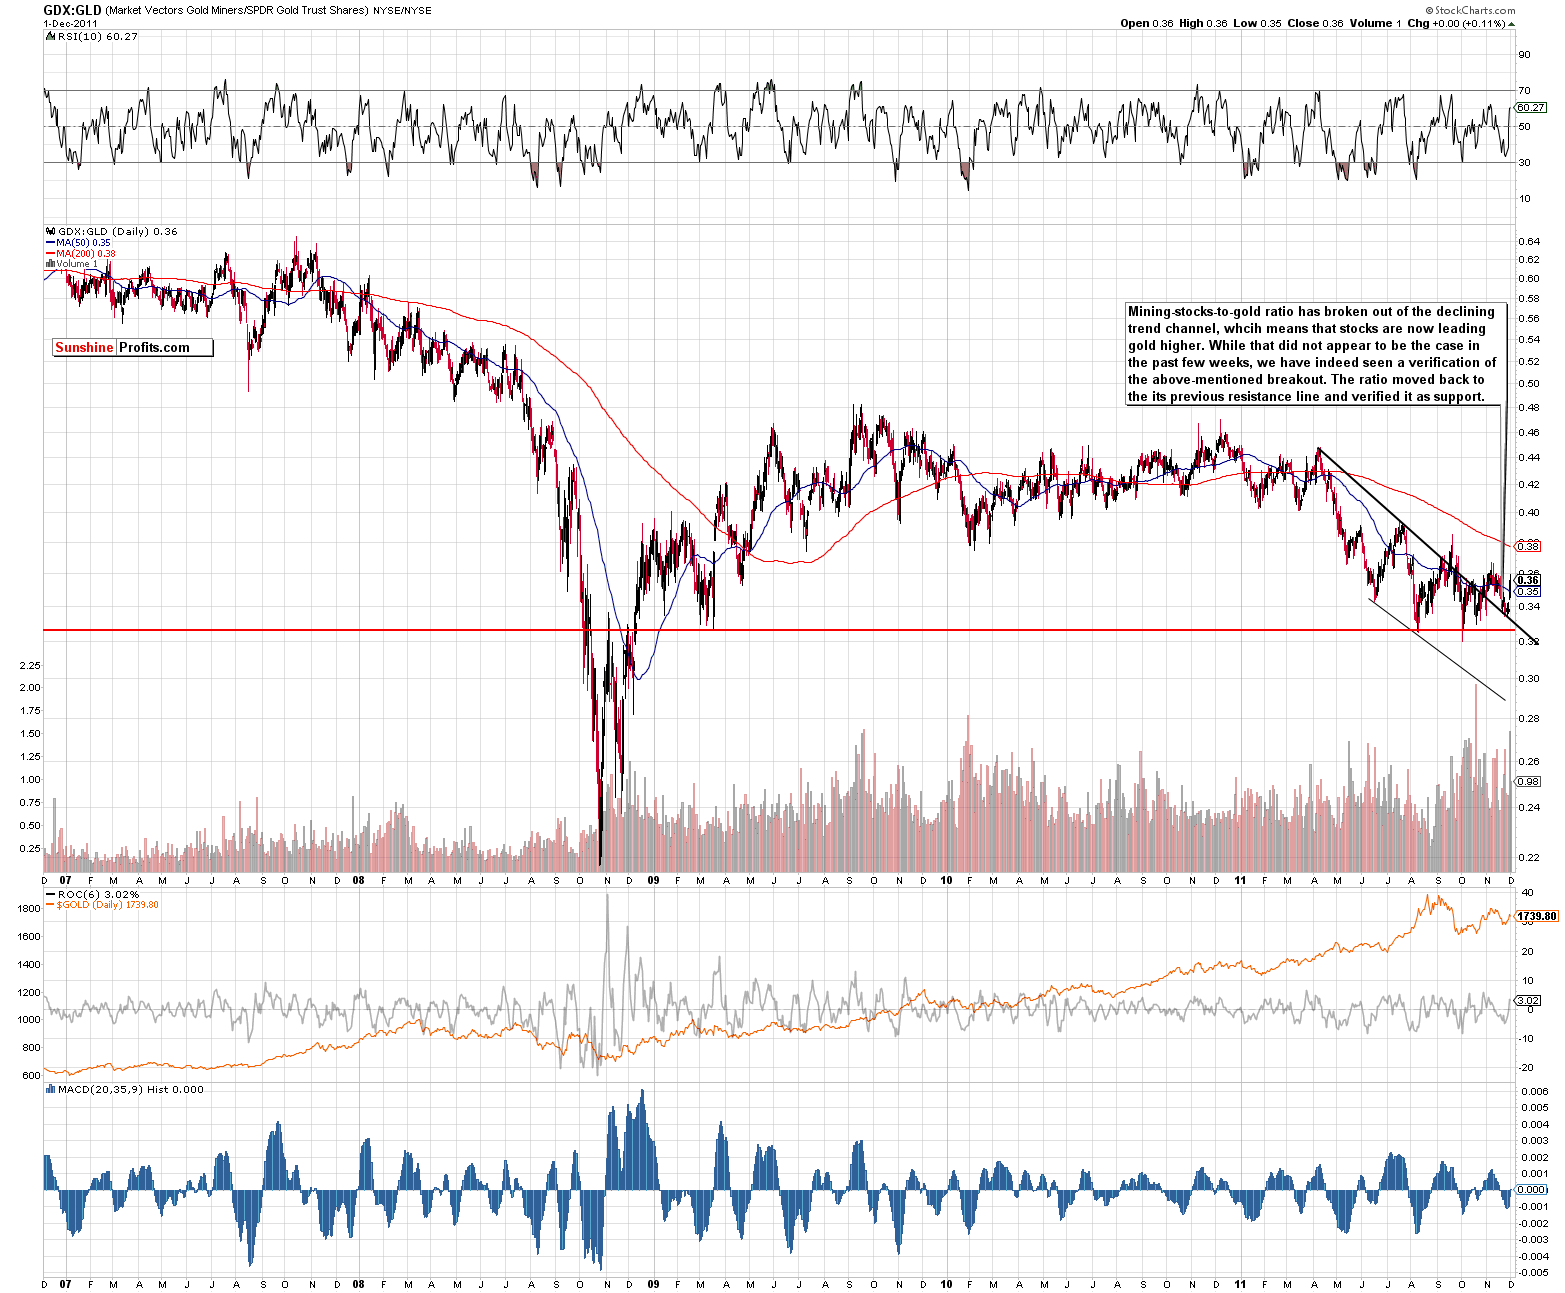
Once again this week, we have included the GDX:GLD ratio chart (please click on the chart to enlarge it), which shows how the miners have performed relative to gold. This week we see that the breakout in the ratio has not only been seen, but it has also been verified. The ratio moved down to the support line and then reversed to the upside which indicates the beginning of a rally and at this point, it seems that the miners may begin to catch up with gold and silver on a medium-term basis. This bullish indication confirms that the rally indeed has legs.
Summing up, the outlook for mining stocks appears bullish from here much as is the case for gold and silver. The initial target for the HUI gold stock index is the 640 level for the weeks ahead.
Junior Mining Stocks
As stated in the Key Principles section, the list of top juniors will be updated approximately every 4 weeks, so this is the Update that should contain the revised version of the lists.
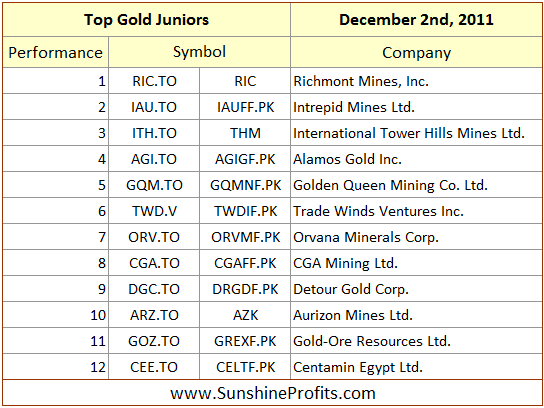
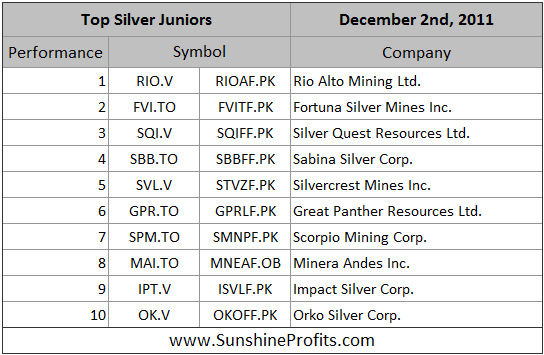
This month there are no changes as far as our gold and silver junior selection is concerned, which means that if you have constructed your portfolio with last month's rankings, you don't need to make any changes in your junior holdings.
Please note that we've recently written that we favor junior mining companies to big senior producers. The current bullish case for the general stock market makes us continue to believe that this is a good way to approach the mining sector. As you may see in the last 4 rows in this week's Correlation Matrix, there is a very strong correlation between juniors and main stock indices – consequently, what's bullish for stocks, is also bullish for juniors.
Letters from Subscribers
Q: Congratulations - you certainly made the right call with regard to PMs! I have a few questions on your Indicators.
1) SP GOLD BOTTOM INDICATOR:
Currently rising towards lower dotted line, but hasn't broken through it
2) SP GOLD BOTTOM INDICATOR HUI:
Hasn't broken upper or lower lines since July/August
3) SP GOLD STOCK EXTREME #2 INDICATOR:
Poised above dashed line but hasn't broken through it
Also, where can your most recent stock selections can be found - which Premium update?
A: SP GOLD BOTTOM INDICATOR - until this indicator moves above the dotted line, it doesn't have any meaningful implications for the precious metals market. Naturally, when it's very close to this line the odds are that it will be broken soon, and that we will have a short-term buying opportunity. Generally, this takes place in the first part or middle of a rally and is a sign of strong momentum that is likely to carry gold even higher.
Please note that this indicator is used in a slightly different way (i.e. the dotted line is much lower) on the long-term perspective. When the long-term buy signal is given, a major (!) bottom is likely at hand.
SP GOLD STOCK BOTTOM INDICATOR - that's right, this indicator didn't flash any signals recently. If this situation persists we will consider fine-tuning it.
SP GOLD STOCK EXTREME #2 INDICATOR (and the same goes for the first extreme indicator) - this situation is similar to the SP GOLD BOTTOM INDICATOR - until this indicator moves above or below the dotted line, it doesn't have any meaningful implications for the precious metals market. However, in this case, even if this indicator moves closer to one of the dotted lines, it doesn't really make it more probable that this line will be broken. As you can see, the signals are flashed when there's a sharp move in the indicator. No matter the position it starts at, the swing is usually so big that it takes the indicator above or below one of the dotted lines. Unfortunately, based on the characteristic of the underlying psychological mechanism, we cannot change this indicator to make it more "predictable in advance". Those of you who are keen on physics may compare this to the Heisenberg uncertainty principle – in analogy we cannot have both superb efficiency and superb predictability at the same time.
As far as our stock selection is concerned, we cover junior mining stocks in the first update of each month (like today) and as far as senior producers are concerned, we provide interactive stock rankings that adjust the list according to your preferences. Please visit our Leverage Calculators in the Tools section for more details.
Q: All of your analysis depends upon the dollar weakening. You haven't made much of a case for that happening. 'Cycles' and history are nice, but there is no historical precedent for a euro collapse. So far, the euro has moved lower and lower, and there is nothing on the horizon to change that. As long as the situation in the euro zone deteriorates, the dollar has support. And more liquidity problems equal more gold selling.
Yes, it may be a good time to go long. The problem is, you said it was a good time to go long (and all the indicators agreed, remember?) back around 1790. And yet, here we are, and in my view testing 1600 is a distinct possibility right now.
Sometimes riding the elevator down is necessary to catch it on the way up - agreed. But we are in uncharted territory here, and you are really bucking the trend - the market has already said "the dollar, not gold, is the short term safe haven." The short term could be a hell of a long time, and the ride down could be a lot further. You should really make a case for a dollar decline - beyond charts and indicators.
A: The USD Index was indeed one of the important factors behind our analysis, but there's much more to the gold & silver markets than just the situation in the currency markets.
However, the point that we would like to make here is that there is a huge difference between fundamental factors (euro crisis) and technical factors (like above mentioned cyclical tendencies). The former decide what is likely to happen eventually, not necessarily right away. Like the destruction of the euro - will it happen eventually? Probably. Will it happen this year? Probably not. Next year? Maybe, but not likely. And so on.
Even if the fundamental factors suggest that the euro is poised to move lower, this move may materialize in 3 years or so. And it could even take the form of a 2-year rally that is followed by a 1-year plunge that takes out the previous gains and then moves even lower. Fundamentals are not something that will help you enter and exit the market at the most favorable moments – technicals (and related approaches) are.
On a side note, in Premium Updates, we separate our fundamental analysis and the discussion of the current events from the technical part, precisely because we don't want to fall into the trap of using fundamentals as timing signals.
Summary
The situation in the USD Index is quite bearish at this time and will likely lead to higher prices across the precious metals sector. Stocks on the other hand have a very bullish outlook at this time and are in a self-similar pattern based on 2010 price action. It seems that a significant rally is likely to be seen from here.
The signals from the charts this week have been bullish and our indicators are very much in tune with this sentiment. Based on past reliability of these tools, it is probable that the rallies discussed will be seen quite soon.
The outlook is bullish for gold, silver and gold and silver mining stocks for the long, medium and short term. Target levels for gold are $1,900 for the short term and $2,200 for the medium term. Silver's price target is $40 with higher levels likely in the coming year. The HUI Gold Stock Index could move up 10% to the 640 level in the coming weeks. At this point, the odds appear to be about 75% that these short-term rallies will indeed be seen. Long positions appear to be well justified throughout the precious metals sector at this time.
Our next Premium Update is scheduled for Friday, December 9, 2011.
This completes this week's Premium Update.
Thank you for using the Premium Service. Have a great weekend and profitable week!
Przemyslaw Radomski

