
Analysts for Goldman Sachs this week predicted that low interest rates will keep gold prices climbing for the rest of this year and into 2012 and raised their price forecasts for the precious metal to $1,930 per ounce from $1,860. So far this year, the price of gold is up about 26 percent.
Among other things, gold has been a beneficiary of the imploding euro. It's simple physics, or economics, in this case. Money has to go somewhere. Bonds of the smaller countries have been hit, stock markets have made little progress all year, European bank have suffered losses over Greek debt, so there isn't much choice left for investors. Some European money has crossed the Alps into Switzerland, always the continental safe haven of choice in turbulent times. But the Swiss have taken steps this summer to cap their currency to keep it from rising too quickly and destroying the attractiveness of their exports. German bonds have also been a beneficiary and the yield on the 10-year German bond has fallen to 1.7%, compared to 2008 when it was 4.5%. Germany is the stable, productive, responsible adult on the continent. But even Germany's debt-to-GDP ratios don't dazzle.
We have come to the logical and inevitable conclusion that as the euro crisis continues to unfold, one of the few viable investments and safe havens will be gold. The future of the euro zone hangs in the balance as the financial crisis that began in Greece now has engulfed Italy. There are even those who say after this dangerous escalation that the window of opportunity to save the euro is rapidly closing. Italy's government debt at the end of 2010 was almost 120% of GDP, which was second only to Greece, at 145%. The yield on Italian 10-year government bonds rose for a short while to as much as 7.4% last week amid fears about the country's ability to set its house in order. A level above 6% is considered to be unsustainable. Keep in mind that rates around 7% triggered bailouts for Ireland, Portugal and Greece. Even French bonds have recently become tainted by risk and the spread between German and French bonds has soared to a record 1.90%as people sell the French and buy the German. And this is France we're talking about, a pillar of economic strength in Europe that has not had a sovereign default in 200 years.
There are three possible scenarios for the euro zone that we can see and all will be bullish for gold.
If the European Central Bank will begin start buying euro-zone bonds on a massive scale, printing money to the tune of trillions of euros to do so, the massive amounts of money flooding the market will inevitably push the price of gold up.
If, on the other hand, the euro zone falls apart, one does not need much imagination to foresee the chaos that will ensue. Using the word “chaos” will be an understatement. Each country will have to introduce new currencies along with stringent capital controls to stop money from fleeing the country. Banks will collapse. We're talking mayhem.
This is the kind of pandemonium that would be a boon for gold. For awhile, gold could become the only credible currency left standing.
A third possibility is that the current mess with a flavor-of-the-week euro zone crisis will drag on for a few more years. This week Mario Monti was selected to form a new Italian government. Monti, who is known in the Italian press as “Super Mario,” will have to face heroic challenges as he tries to steer his country from the brink of economic disaster.
Whatever the most recent crisis, and they seem to appear at an alarming rate of about one a week, gold should also flourish in that environment as investors lose patience and confidence in fiat currencies.
What's the most likely outcome in our view? First the third possibility, then a mix of third and first one, which will ultimately lead to the second scenario – however it seems that it will take years for this stage to be reached.
On a last note before we get to the technical portion of this Update. As you know, 45 days after the end of each quarter, the top hedge fund managers are forced to release data on their long positions to the Securities and Exchange Commission. They probably do it with great reluctance, but it does give us a keyhole through which we can peek into their investing philosophy and we, of course, are interested in their attitudes towards precious metals.
According to those filings, Hedge Fund Tycoon John Paulson made some key cuts in his holdings in the third-quarter, including slashing stakes in the SPDR Gold ETF (GLD) for the first time in more than two years. But this is no cause for alarm. According to a Dow Jones Newswire report, the hedge fund manager shifted money into gold futures contracts that didn't show up in the filings. Paulson held 20.3 million shares in the exchange-traded fund backed by gold as of Sept. 30, compared with 31.5 million at the end of June, according to Securities and Exchange Commission filings. The firm remained the largest holder of GLD.
Daniel Loeb, the CEO at hedge fund Third Point, who manages more than $2.4 billion in assets, bought Barrick Gold (ABX) this quarter.
Soros Fund Management LLC increased its stake in GLD to 48,350 shares from 42,800 and added options. Soros had sold most of his GLD holdings of 4.72 million shares in the previous quarter. Paul Touradji had 45,000 shares of GLD and Paul Tudor Jones had 200,000 shares, compared with none on June 30, the filings.
Even those of us who don't hold hundreds of thousands of shares of GLD are interested to know how gold and other precious metals will do in the short term. Therefore we will begin our technical analysis with the Euro Index (charts courtesy of http://stockcharts.com.)
Euro & USD Indices – Currency Markets
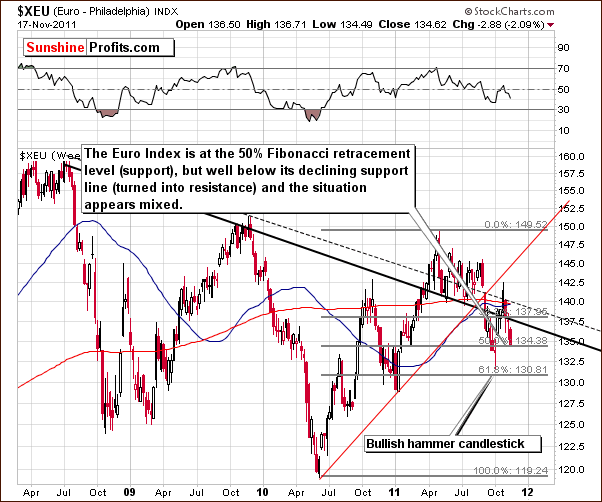
Once again we begin our analysis section with a look at the long-term Euro Index chart. This week we saw the Euro Index move much lower, but it did stop at the 50% Fibonacci retracement level meaning that it corrected one-half of its 2010-2011 rally. The index level is still significantly above previous lows, but these levels could still be reached though such a move does not appear imminent. Overall, the situation with respect to the euro is a bit blurry now, and no conclusive implications are apparent for the precious metals sector.
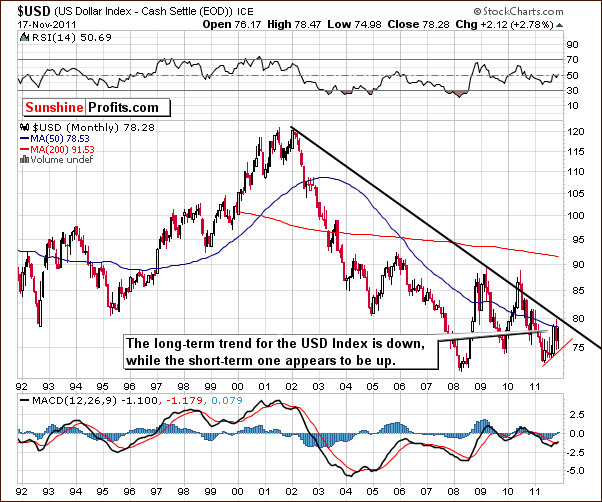
In the very long-term USD Index chart, the short-term trend continue to be up and the long-term down. The situation has changed little from last week's Premium Updatein which we wrote that an important resistance line [is] just below the 80-level not that far from Wednesday's close. Even if the rally continues from here, it is not likely to go much higher. The same holds true today from this very long-term perspective of the dollar.
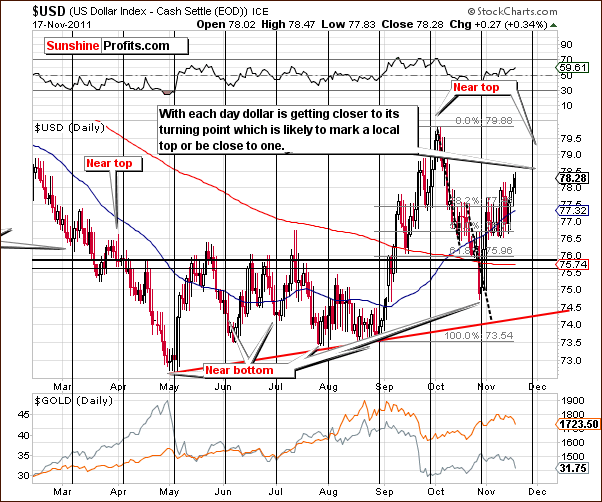
In this week's short-term USD Index chart, we see that the uptrend in the USD Index has continued this week. Based on the very long-term chart, we see that the resistance line is quite close to the current index level with a move to 78.47 intraday trading on Thursday. The resistance is close to 79 and is likely to be where the index tops. This could be seen very soon. A cyclical turning point is at hand as well which makes this an important point in time. The current rally could reverse very soon, and declines may be seen for some time here. The immediate term is unclear to some extent but the next few weeks will likely be bearish for the dollar.
Summing up, the situation in the Euro Index is quite unclear at this time. The immediate moves for the dollar are not clear today either, but it appears very probable that the short-term move (weeks) for the dollar will be to the downside. The index is presently close to a resistance level and close to a cyclical turning point in an uptrend which points to a local top to soon be followed by a period of decline.
General Stock Market
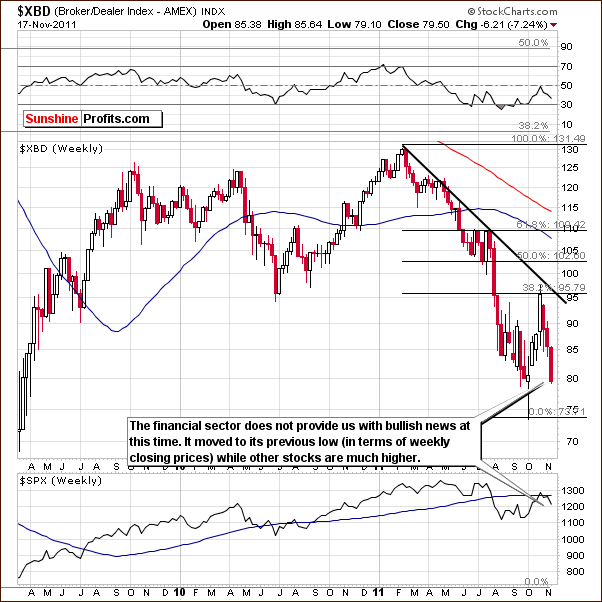
In this week's Broker Dealer Index chart, there are no bullish signs for the general stock market. The index moved to previous lows based on weekly closing prices even as some other stocks moved higher. There is a possibility that the financials have reached a bottom here, but that is not the key point in our analysis of this chart.
The financials have been underperforming other stocks and this is generally a rather bearish indicator. At this time, however, this may be attributable to the weak banking sector in the US and Europe. As we stated in last week’s Premium Update:
There are some fundamental factors however, that must be considered at this time. The banking sector has been hit hard by the situation in Greece. Decreased profits or increased losses have been seen in many financial institutions. The downturn in the financials therefore may not be due to investor sentiment at all.
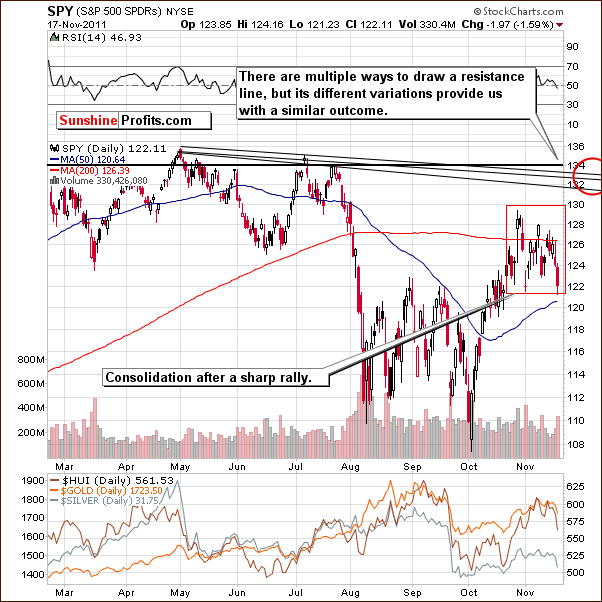
In the short-term SPY ETF, we see that in spite of the weakness seen in the financials, there are not necessarily bearish signs here. One important suggestion to the contrary is the flag pattern which has recently developed after a sharp rally. A flag pattern period is normally followed by a trend similar to the period which preceded it, in this case, a sharp rally. The ellipse in our chart shows where stock prices may go initially after the consolidation period outlined by a red square is completed. It is possible that stocks could then see all-time highs.
Summing up, the outlook for stocks is more bullish at this time than not.
Correlation Matrix
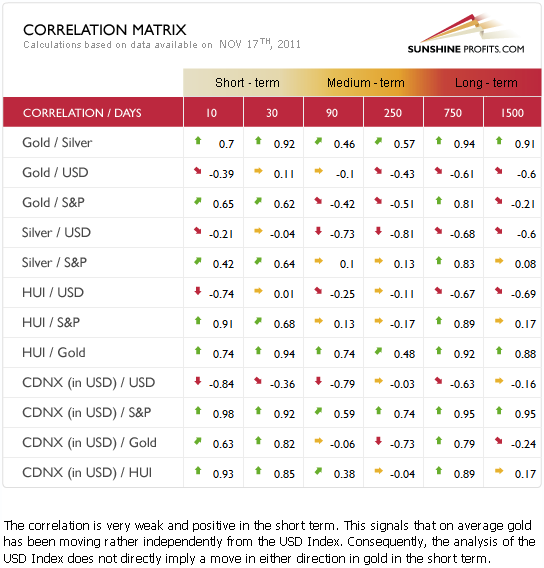
In this week's Correlation Matrix, a tool which allows us to see the impact of the currency markets upon the precious metals, we see a very weak correlation between the USD index and precious metals. Short-term moves of the dollar may therefore not correspond to moves in precious metals prices.
Last week, we discussed the precious metals' ability to hold up well even as the dollar strengthened. This week, however, lower prices were the norm in the precious metals sector even though the dollar's rally lost some of its steam. The short-term coefficients are weak here and the implications from the USD Index are therefore blurry at this time. Still, it's more likely than not that a decline in the USD Index is going to be bullish news for precious metals since they are, by default, priced in US dollars.
The correlation between the general stock market and precious metals is positive and significant, though not very strong at this time. It is likely that if stocks continue to rally, gold, silver, and the mining stocks will likely see higher prices as well.
Gold
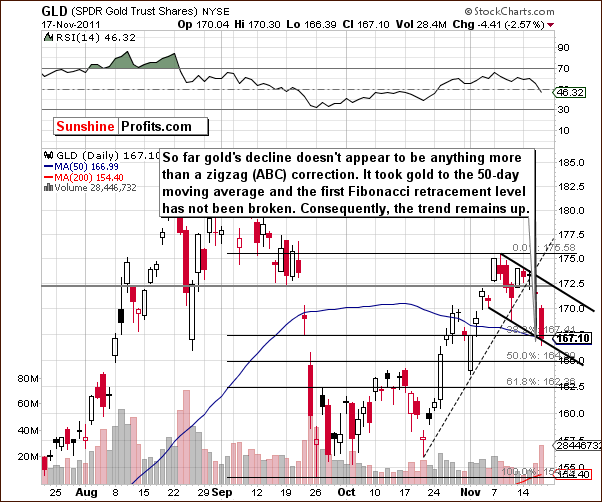
This week we begin our gold section with a look at the very short-term chart since it is the most interesting of the gold charts this week. Thursday's decline was significant and likely prompted many investors to question whether this was the beginning of a bigger move down or simply a correction.
To answer this question, we first look to see if the decline took the GLD ETF below the Fibonacci retracement level. The answer is no, for the decline stopped very close to this first line of support. Secondly, we ask if the shape of the decline is in tune with normal corrections or does it more resemble the beginning of a past serious decline? The trading pattern seen in the past few days does resemble the zigzag, flag type pattern which is a continuation pattern, not one which normally leads to continued declines. It seems, therefore, that although we may see a few days of slightly lower prices ahead, the outlook still appears bullish for the following weeks.
Another factor of note here is the trading pattern seen over the past couple of months. It appears that the recent move close to the 38.2% Fibonacci retracement level may actually be the handle of a very bullish cup-and-handle pattern. Unless much lower price levels are seen next (confirmed move below $164), the short-term trend here appears to be to the upside with higher price levels likely.
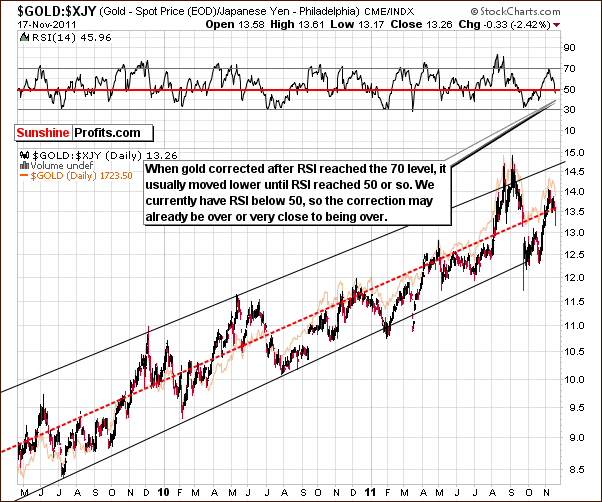
Looking at gold from perspective of the Japanese yen, there does not seem to be any invalidation of the points made in our short-term analysis section. We have been watching the RSI levels here and have written about the 70 level indicating that a consolidation may be near. It was not interpreted as a screaming sell signal nor did it indicate a final top at the time. The RSI has now moved below the 50 level and this has coincided with the end of corrections or at least pauses in declines recently. The recent price action here is therefore not of great concern with respect to the current uptrend, and it seems more likely that higher prices will be seen in the coming weeks.
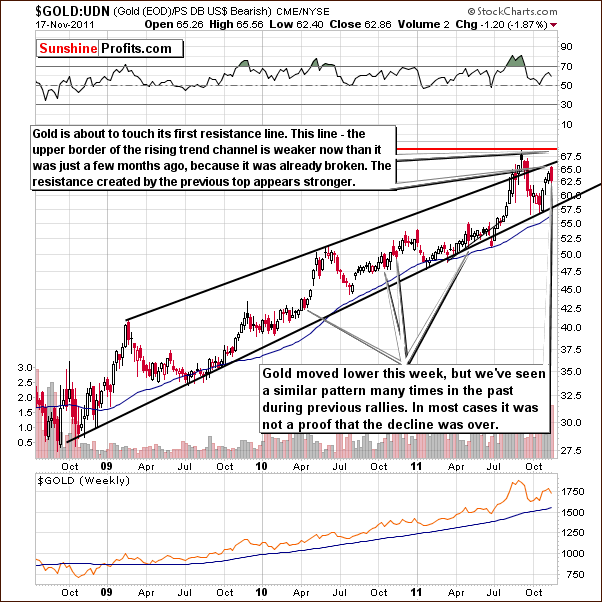
In this week's long-term chart of gold from a non-USD perspective, the decline seen this week only represents a small portion of the recent rally and has brought the index level back to about where it was a week ago. Declines of this type are commonly seen and normally do not indicate that the final top is in. The rally appears likely to continue, and this chart provides no invalidation of points made earlier for the short term. The outlook remains bullish.
Summing up, the declines this week have been quite volatile on an intra-day basis, but when the situation is viewed from several perspectives, this move is seen to be very much in tune with previous corrections which followed major bottoms in the past. Long positions for both the long- (investment) and short-term (trading) still appear to be justified at this time.
Please note that the situation may become bearish if we see a confirmed move below $164 level in the GLD ETF ($1,680 for spot gold), but this doesn't appear to be the most likely outcome at this time.
Silver
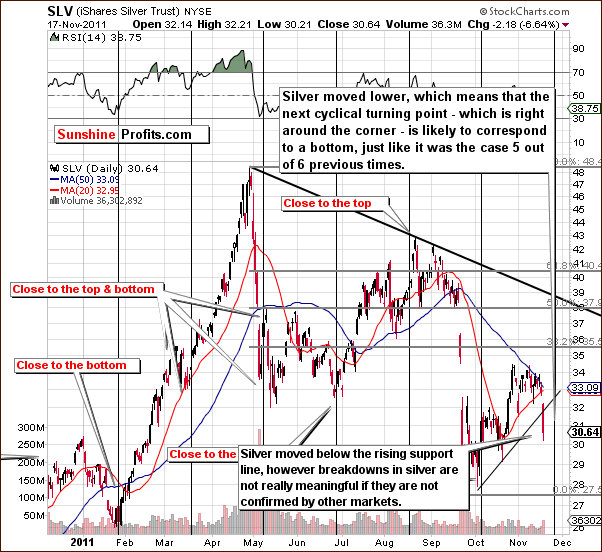
We begin our silver section with the short-term SLV ETF chart this week. Here we see that the white metal moved below its rising support line, but since silver is known to be quite volatile, this move is not a major concern to us at this time. We acknowledge that the recent technical signals from silver have not been confirmed by other markets and are therefore not taken to be too meaningful. Silver is much smaller market than gold is, and it's more easily manipulated, so one should be particularly careful when applying technical analysis to the white metal. In this case, the bearish outcome of this chart is not confirmed by gold, so, the recent breakdown should not be regarded as an overly bearish development.
An important point to note here is that silver is fast approaching its cyclical turning point, possibly just several days away. With the intermediate-term trend to the downside, we will likely see a local bottom. Had the recent trend been to the upside, a local top would be expected instead and lower prices would likely follow. So due to the recent declines, the situation now is actually better for the following weeks, since a local bottom will probably be followed soon thereafter by a move to the upside.
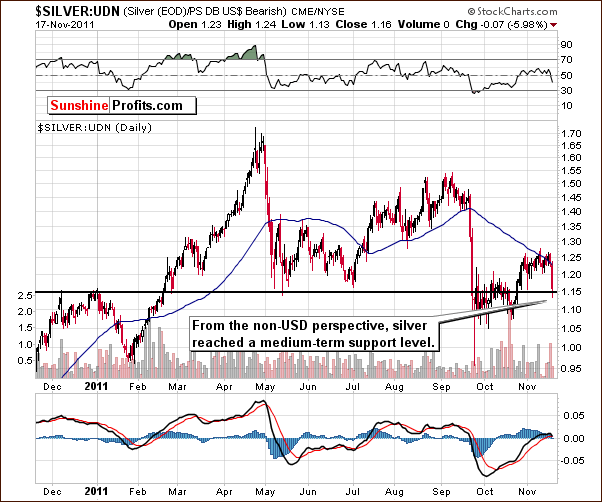
We now look at silver from a non-USD perspective and once again see a bullish view of the market. There was no breakdown, as price levels here have reached the strong support level created by previous tops and bottoms. Consequently, the bullish outlook discussed in earlier sections is confirmed here as well.
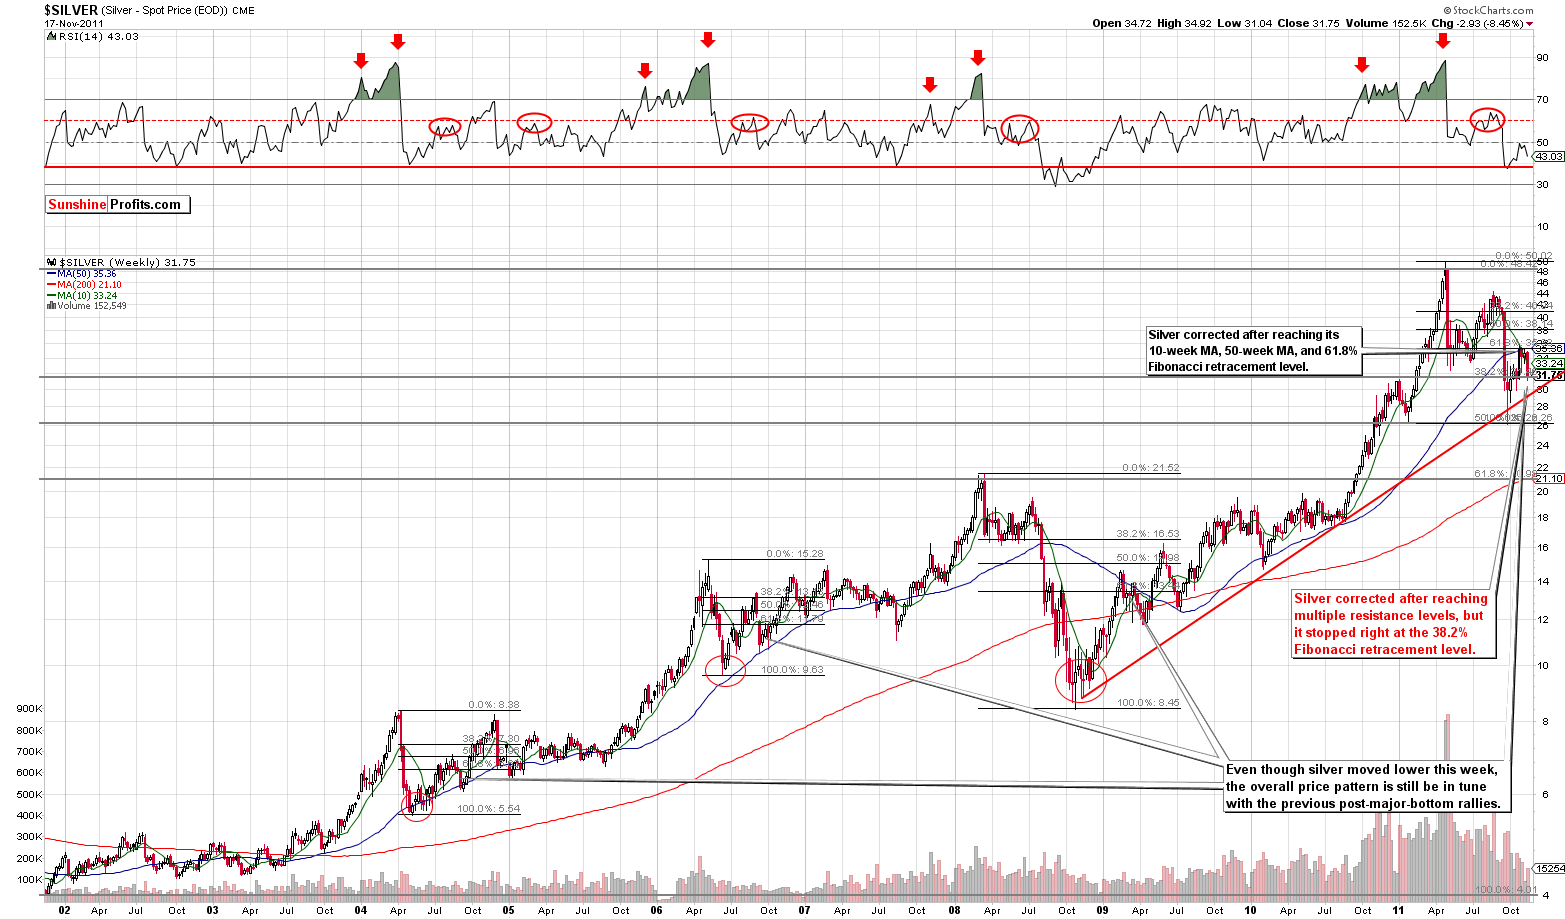
In this week's long-term chart for silver (please click the above chart to enlarge), it is clear to see how silver declined after reaching several key resistance levels which recently coincided. It is important to note that the correction seen was not below the 38.2% Fibonacci retracement level based on the whole 2002-11 upswing. This is one of the things that suggest that the trend is still to the upside. With a very long-term support line being reached and a cyclical turning point close at hand, a very bullish combination of factors is clearly in place.
Summing up, the situation in silver appears to be bullish for the coming weeks even though at first glance, the recent price declines may lead investors to have some doubts. The main point is that from analysis of several perspectives, the signs from multiple sources indicate that an upswing in prices is quite probable in the weeks ahead.
Gold and Silver Mining Stocks
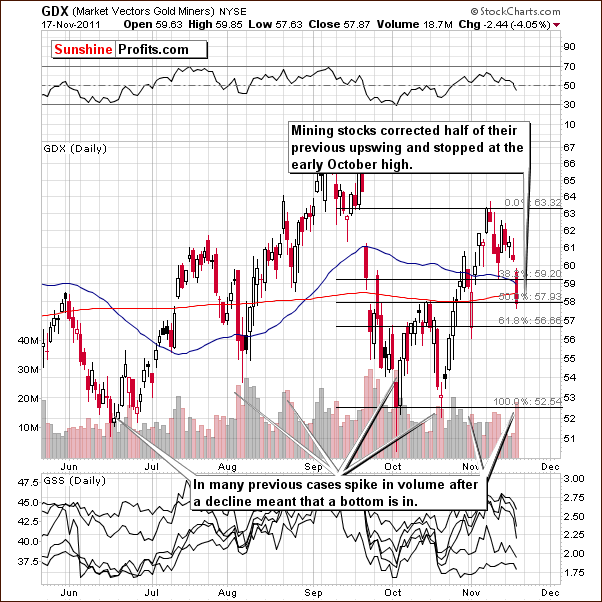
In this week's short-term GDX ETF chart, a proxy for the precious metals mining stocks, the miners have corrected one-half of their October-November upswing. It seems likely that this move may be sufficient to cool down the short-term emotionality which has impacted the market recently. In short, prices may very well be ready to rise once again as the situation is presently closer to oversold than overbought.
One suggestion pointing to a bottom already being in is the recent single spike in volume. This is a factor which has accompanied bottoms many times in the past and while there is no guarantee that price levels won't move a bit lower, say to the early November lows, the short-term picture here appears to be bullish.
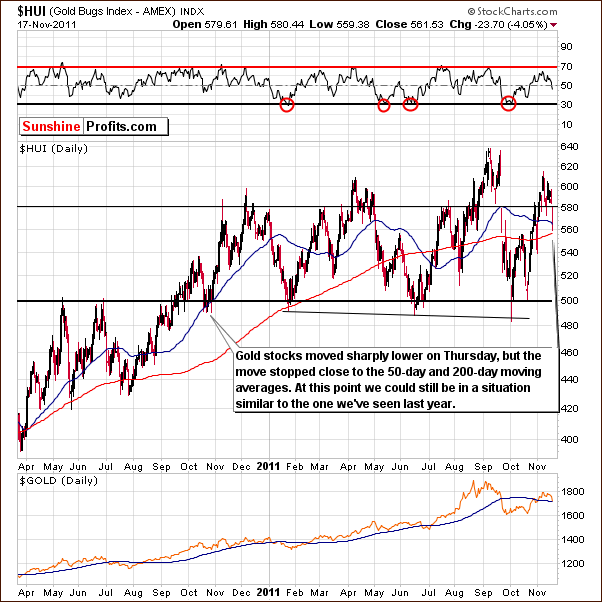
In this week's long-term HUI Index chart, we first wish to note something which is of smaller importance. Gold stocks are presently close to their 50-day and 200-day moving averages, and both have provided support and resistance in the past. It seems that the decline in mining stock prices could stop here.
The main point to be made here concerns the trading pattern. It is quite obvious that the index has moved up close to the 600 level, moved lower towards 500, returned back towards 600, and completed this journey on three occasions in the past twelve months – or more if we take into account also the smaller moves. It seems ever so likely that the next move will now be back towards the 500 level. This is likely quite clear to anyone who views this chart. Internet essays abound on this very topic, stating that a move to 500 is all but certain.
According to our observations, however, if the pattern is too obvious, if something seems to be near certain, it usually does not happen. The opposite is often seen. This can be seen in the head-and-shoulders pattern which began earlier this year (Feb-Jun) as well as the one seen recently (Jul-Oct). In both cases, the pattern was clearly underway and was quickly invalidated before being completed.
Based on our experience, the sure-bet move in the HUI index to the 500 level will likely not happen. If everyone has already discounted the move to the 500 level, they have already sold, which might have contributed to the recent correction. The decline toward 500 in the HUI Index simply seems too obvious, especially the levels reached by another proxy for the mining stocks – the XAU Index.
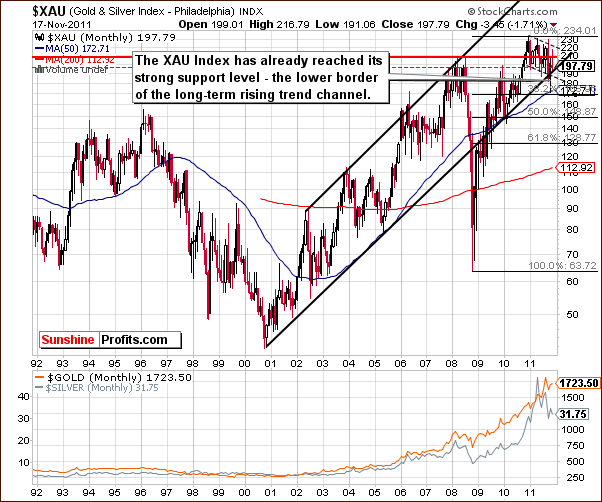
In this week's very long-term XAU gold and silver miners' index chart, we see a further confirmation of what we stated in our previous analysis. It appears that the bottom here should already be in. W we see that the XAU index is once again at the lower border of its rising trend channel. This level has been broken temporarily in the past, but prices soon reversed and the breakdown was invalidated. Therefore, the lower border of the trading channel is still an important support line.
The subsequent move to the upside did not surpass previous highs, but today, it seems that taking the current, long-term uptrend into account, higher price levels are quite likely from here.
Summing up, combining the analysis of all three charts for the gold and silver mining stocks, there is a consistent, bullish outlook for the precious metals mining stocks for the following week. As always, the situation may change and become bearish, but this simply does not appear to be the most likely outcome.
Sunshine Profits Indicators
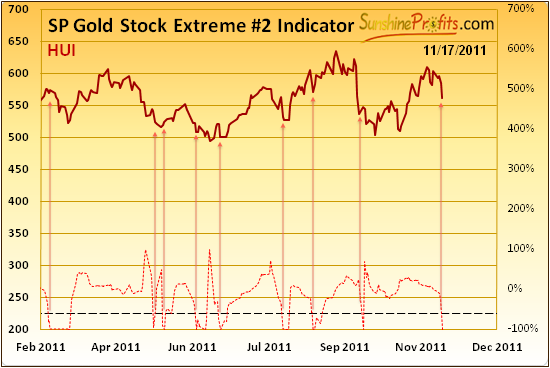
In the SP Gold Stock Extreme #2 Indicator chart, we see a move below the dotted line which normally indicates that we are at a local bottom or quite close to it. Previously, in 7 of the 8 times this has been seen in 2011, the local bottom was seen if not immediately, then still very soon. This is the only indicator which says “Buy” right now, however, which means that additional few days of trading sideways or slightly lower prices are not out of the question.
We will watch our other indicators (especially the SP Gold Stock Extreme Indicator because of the 100% efficiency in one of the signals that it used to flash since 2008) which are not yet giving a buy sign, and if the situation changes, we will notify you accordingly.
Letters from Subscribers
Q: Do you see any impact from this?
[The essay is about the CME's failure to immediately provide funds to those that were directly hurt by the MF Global bankruptcy. The bottom line is that the CME is not to be trusted and that its self-regulation is ineffective.]
A: As far as impact from this is concerned - we see a positive impact on the precious metals market in the long run and no additional direct impact in the short term. The declining faith in the financial system will encourage more people to protect their holdings by buying physical (!) precious metals (no pool accounts).
As an additional comment, we can say that our approach would have protected you from vast losses even if you were a client of MF Global. That's because we believe that the long term part of your capital should take physical form only - you should be sure that anyone's bankruptcy will not mean that you're going to lose your metals. When you hold the metals in your hand and put them in your safe, you can be sure that someone's bankruptcy will not affect your bars and coins. You will find more information about our approach in the Key Principles section of our website.
Q: I have been reading on the Internet about the large increase in short positions of JPM and others, and an imminent takedown of precious metals in light of options expiry on November 22nd. What is your view on this? Also, can you suggest a reading on past seasonality regarding options expiry?
A: We believe that the effect of the derivatives expiration should be examined along with the seasonal tendencies in the metals. In other words, we believe that the best approach is to find out the average influence the options have on gold when they expire, and combine this influence with the seasonal factor.
Let's take a look at the seasonal tendencies to see the likely path for gold based on how it has performed each November during this bull market, and then apply the "derivatives' expiration factor". In this case we'll apply the options' expiration effect. Please take a look at the chart below for details.
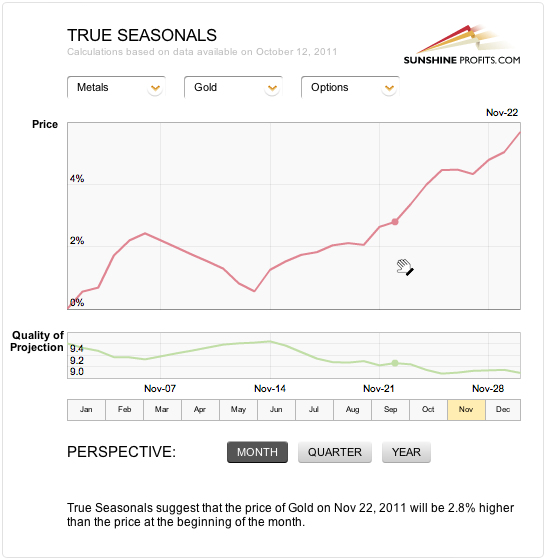
In short, gold's consolidation in the first part of November is in tune with the true seasonal pattern (seasonals + expirations of derivatives' effect). Based on this pattern we can expect the end of the month to provide us with higher prices, not lower ones.
Q: It is a pleasure to read your newsletter but it would also be good to see your results, the stops you have and the risks you take.
1. Should subscribers purchase and sell only when market alerts are sent out?
2. Can you declare your own positions to subscribers?
3. Can you run a real portfolio(s) starting with $100,000 every year in gold, gold stocks, silver, platinum, etc?
A: 1. Subscribers can take any positions any time, and we're perfectly fine with that. However, we will notify you when we believe that opening a speculative long/short position in the precious metals sector is a good idea, and we will let you know when we believe it's a good idea to close it. We will also let you know when we believe it's a good idea to exit long-term investments and when to repurchase them again.
We will do that in our Premium Updates and Market Alerts. Again, if you're a day trader, you will most likely prefer to enter and exit positions much more often than we do, but you may still benefit from our analysis by taking some positions based on our analysis.
2. We do not declare our positions because we don't want anyone to follow us blindly. While this may not make much sense at first sight, it does when you consider that we may be far more (or less) risk tolerant then most subscribers. When someone takes on more risk than they are capable, they will surely close their positions based on emotional factors (when price moves too low temporarily) and will most likely eventually lose money.
For example, if we told you to buy a very small (1% of speculative capital) amount of very-short-term options (that expire in 2 weeks or so), it is very likely than those who are new to the whole “investment thing” would use 20% of their capital or even more thinking "these guys were right 5 times in a row, they have to be right again!" Taking positions that are too large is something that is guaranteed (!http://www.sunshineprofits.com/research/universal-investor-speculation-and-investment) to lose money, and that's the last thing that we want you to do.
What we aim to do is to be your "consultants," where you pull the final strings after taking into account our analysis and your own risk preferences. We believe that this is not only the best way to improve one's investment skills, but is also the most ethical way to for us to help you make the greatest profits in the long run.
Plus, please note that we will not take nor close a position before notifying you about change in our views, so you can rest assured that, we will notify you as soon as we get convinced about a given outcome.
However, we will reconsider providing you with a few model portfolios once our new website is up and running.
3. That's a good idea, thanks. We'll most likely implement something like that on our new website.
Q: Today we saw the price of platinum fall. Was this a buying opportunity or is it best to wait?
A: There was and still is a buying opportunity in platinum in our view. The answer is: both. This opportunity and the moves that we expect to see are of a long-term nature, meaning that it's still not too late to get into this market.
Q: It has been suggested that the leveraged aspects of DGP/AGQ funds make them suitable only for cycle trading, i.e. very short terms of a week or less. What are your thoughts on this? And congratulations for hitting the nail on the head over the past couple weeks throughout a very tumultuous situation.
A: Thank you for your kind words - we appreciate that.
As far as DGP and AGQ (2x leverage long ETNs) are concerned, yes, they are much more suitable for short term trades than long term ones. We do not recommend using them as a proxy for long-term investments (instead of physical precious metals) because of counterparty default risk: ETNs are not backed up by physical metal.
Q: Your bullish projection on silver was encouraging, but I’m concerned that last week, silver's 50-day moving average (DMA) crossed below its 200-DMA. I understand this is referred to as a "death cross," and is considered a bearish development. Should I be concerned?
A: Not really. Let's see how silver has performed since 2002 after previous "death crosses." There were only a few cases where it was seen:
· End of Q3 2002 - right before a major bottom (lower prices were never seen after that bottom),
· End of Q1 2003 - right before a major bottom (lower prices were never seen after that bottom),
· End of Q2 2004 - right after a major bottom (lower prices were never seen after that bottom),
· Q3 2005 - right before a major bottom (lower prices were never seen after that bottom),
· Q3 2007 - followed by a sharp decline that resulted in a major bottom and a rally that was a few times bigger than the decline,
· Q3 2008 - in the middle of the 2008 plunge.
Summing up, we have 4 bullish outcomes, 1 mixed outcome, and 1 bearish outcome. Overall, it seems that the "death cross" had positive implications for the silver market.
Summary
The situation in the euro is quite blurry at this time. The USD Index, on the other hand, has a limited upside and will likely see a period of decline soon after any additional rally takes place. The currency markets have not had a huge impact upon precious metals recently, but a downturn for the dollar will still quite likely be bullish news for gold, silver, and the precious metals mining stocks.
The general stock market has been consolidating for a month and this appears to be coming to an end. An additional rally will likely follow and it could be quite significant, possibly to all-time high levels. The gold and silver mining stocks could very well follow the general stock market higher. The implications for precious metals are bullish for the following weeks, even though the situation for a few more days is a bit unclear.
Gold has seen a bullish cup-and-handle pattern take shape and this could lead to higher prices for the yellow metal if the pattern completes. Silver is close to its cyclical turning point in a very-short-term downtrend and will likely reverse direction and move higher soon.
The XAU Index has reached its long-term support line and the price pattern in the HUI Index chart appears too obvious to play out like most expect. The SP Gold Stock Extreme #2 Indicator is giving a “buy” signal which points to a local bottom for gold, silver and mining stocks close to the current price level. Long positions for the short- (trading) and long-term (investments) still appear to be justified at this time.
In terms of probabilities, we estimate the odds of precious metals sector moving immediately higher from here at 60% and the probability for a gold price being higher than it is right now in 3 weeks from now at 70%. If we see a clear signal from the SP Gold Stock Extreme indicator (it moves above its upper dashed line), both probabilities will increase to 75%.
Many important markets will be closed for Thanksgiving and the day after (or the trading will end sooner) and thus the trading week will be quite short. We will therefore not publish our regular Premium Update next week but will issue a short summary on Wednesday as well as utilize our Market Alert capability if needed.
This completes this week's Premium Update.
Thank you for using the Premium Service. Have a great weekend and profitable week!
Przemyslaw Radomski

