
This week’s events are like theater, with shades of a Greek tragedy. In a play the audience knows that if there is a gun in the first act, it will be fired in the third. Now we’re in the second act and so far, the plot is predictable. The script was written back in 2008 when the subprime crisis hit.
This week one of the actors, a wily 75-year-old politician who, in an opera-like plot survived allegations of sex and corruption, finally had to get off the stage. Italian Premier Silvio Berlusconi pledged to step down after the Italian Parliament will approve austerity measures meant to stave off the nightmare scene of a bailout. Italy’s borrowing costs rose further towards unsustainable levels on Wednesday passing the key 7% level brushing up against levels that, once crossed by Greece, Portugal and Ireland, led to a quick erosion of confidence that triggered international bailouts. Italy has amassed more than $2.6 trillion in debt and its bonds are among the most widely held in the world. Any hint in this theatrical plot that they might not be worth their promised value could shatter investor confidence.
Analysts are concerned that if interest rates on Italian debt keep rising, the country may no longer be able to afford to borrow on the open markets and instead would have to turn to official lenders like the European Union or the International Monetary Fund. Given Italy’s size — its economy is bigger than Russia’s or India’s — it would certainly test the resources of euro-zone nations and the International Monetary Fund.
American banks are taking steps to protect themselves from the European debt crisis and there is evidence that they are cutting back on lending to European banks and companies in a feedback loop that could make economic conditions in Europe worse.
Another key actor in the drama is also exiting stage right. This week Greek Prime Minister George A. Papandreou agreed to step down once political negotiators establish a new unity government.
The play's narrator, speaking directly in a soliloquy to the audience, is Christine Lagarde, the International Monetary Fund managing director. This week she warned of the risk of a “lost decade” for the global economy unless nations act together to counter threats to growth.
“In our increasingly interconnected world, no country or region can do it alone,” Ms Lagarde said in a speech. “There are dark clouds gathering in the global economy.” Her comments came a day after leading policymakers and financiers said the eurozone crisis was in danger of creating a global instability by sucking liquidity out of financial markets worldwide.
That was all the predictable stuff that happened this week. But every good playwright needs a twist in the plot to heighten the drama and keep the audience at the edge of their seats. You need a dangerous situation.
Enter Iran.
This week United Nations weapons inspectors presented new evidence that makes a “credible” case that “Iran has carried out activities relevant to the development of a nuclear device,” and that the project may still be under way. The news was the banner headline on the top half of the Israeli Ha'aretz newspaper. The findings have already triggered a debate among the Western allies and Israel about whether increased diplomatic pressure, sanctions, sabotage or military action could stop Iran's program.
All these events put together do not make for a stable environment for the global economy and the heightened uncertainty can only be a bullish factor for the star of our show, the precious metals market.
Meanwhile, according to a new survey, Wall Street bonuses are set to shrink by an average of 20% to 30% from last year, with even steeper declines for bond traders. The Occupy Wall Street crowd must be celebrating. Along with cuts in bonuses, many financial firms are eliminating jobs.
In case you are almost feeling sorry for the Wall Street crowd, don't be. The average managing director will still take home about $900,000, down from about $1.2 million in 2010.
One of our favorite authors, Nassim Nicholas Taleb, a professor of risk engineering at New York University Polytechnic Institute and author of “The Black Swan: The Impact of the Highly Improbable,” wrote about this topic this week in The New York Times.
He states off the bat that he has a solution for the problem of bankers who take risks that threaten the general public. It's very simple--eliminate bonuses.
“I believe that “less is more” — simple heuristics are necessary for complex problems. So instead of thousands of pages of regulation, we should enforce a basic principle: Bonuses and bailouts should never mix.”
He notes that more than three years since the global financial crisis started, financial institutions are still acting irresponsibly. The latest, MF Global, filed for bankruptcy protection last week after its chief executive, Jon S. Corzine, made risky investments in European bonds. Taleb says that it is only a matter of time before private risk-taking leads to another giant bailout like the ones the United States was forced to provide in 2008. He writes that it is time for a “fundamental reform”:
Any person who works for a company that, regardless of its current financial health, would require a taxpayer-financed bailout if it failed, should not get a bonus, ever...
The asymmetric nature of the bonus (an incentive for success without a corresponding disincentive for failure) causes hidden risks to accumulate in the financial system and become a catalyst for disaster. This violates the fundamental rules of capitalism; Adam Smith himself was wary of the effect of limiting liability, a bedrock principle of the modern corporation.
Bonuses are particularly dangerous because they invite bankers to game the system by hiding the risks of rare and hard-to-predict but consequential blow-ups, which I have called “black swan” events. The meltdown in the United States subprime mortgage market, which set off the global financial crisis, is only the latest example of such disasters.
Consider that we trust military and homeland security personnel with our lives, yet we don't give them lavish bonuses. They get promotions and the honor of a job well done if they succeed, and the severe disincentive of shame if they fail. For bankers, it is the opposite: a bonus if they make short-term profits and a bailout if they go bust.
It will take time for the plot of this play to reach the denouement. There will be plenty of twists and turns, but the star of the show- gold – should continue to shine.
To take a look at gold's performance for the upcoming short term, let's start this week's technical portion with the Euro Index (charts courtesy by http://stockcharts.com.)
Euro & USD Indices – Currency Markets
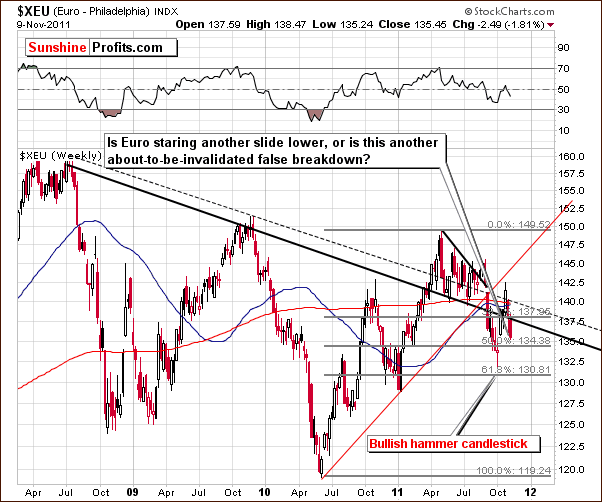
Once again we begin our analysis section with a look at the long-term Euro Index chart. This week we saw a continuation of the recent slide, as the negative news from Italy caused much uncertainty with respect to the stability of the euro. The index moved below 137-138, and this is close to where the 38.1% Fibonacci retracement level and the declining support/resistance lines coincide.
It appears that we are seeing a breakdown which may – still – be invalidated. It is unclear at this point which will win out but we will monitor this closely and report to you accordingly as the situation develops. If the Euro Index closes the week below 137, the outlook will be more bearish than not. If however, it moves above the resistance line before the end of the week, the outlook will then change to bullish.
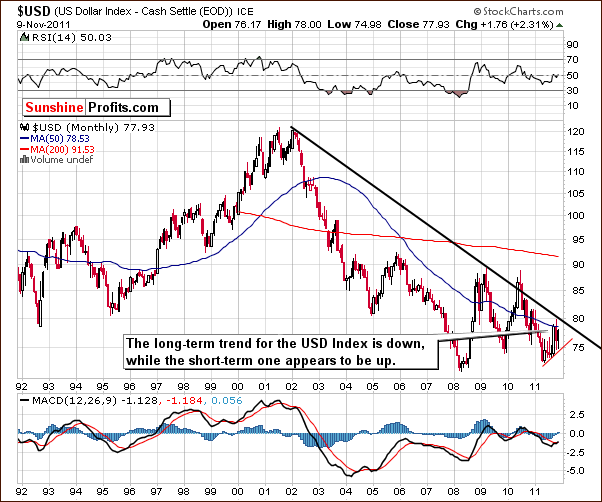
In the very long-term USD Index chart, the opposite situation is seen as compared to the euro. While the long-term trend appears to be down and the short term up, an important resistance line just below the 80-level not that far from Wednesday's close. Even if the rally continues from here, it is not likely to go much higher.
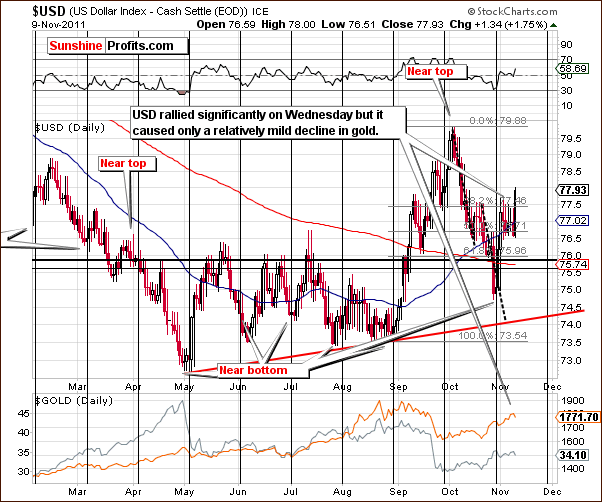
In this week’s short-term USD Index chart, it appears that a move up to 79.5 is possible. This would require another day of price action similar to what was seen on Wednesday, but the most important point here is “how did the precious metals react to Wednesday's sharp USD rally?” Gold's price declined minimally compared to the rally of the dollar, so if the USD Index moves to 79 or even 79.50, gold will likely only decline slightly.
This probably will not even invalidate its short-term uptrend. More on this topic will be discussed in later sections of this week's Premium Update. Our focus will be on the precious metals' reaction to the currency markets. It appears that the metals are showing strength and this will be a confirmation of the bullish outlook for gold, silver and mining stocks.
Summing up, the situation in the currency markets is somewhat unclear for the short term. This week's currency indices have encountered support and resistance lines and much will depend on the eventual breakouts or breakdowns to be seen in each index.
The most important part of the analysis of the currency sector is the strength of metals' reaction toward the unfavorable moves – which provides us with overall bullish implications for the following weeks.
General Stock Market
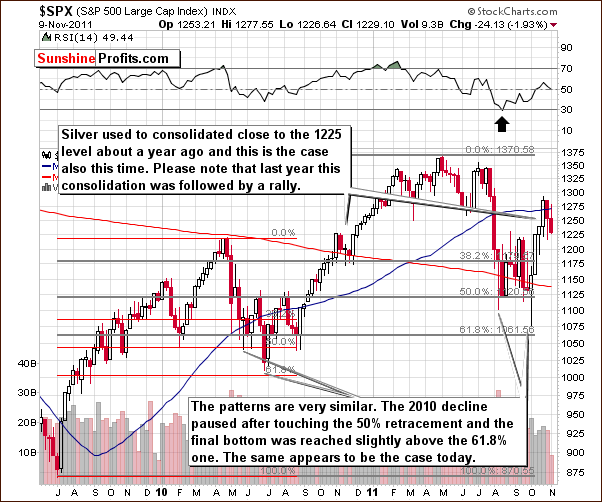
In the long-term S&P 500 Index chart, this week's decline has not brought stocks below the level of their early 2010 highs. It appears to have been nothing more than a verification of the breakout above last year's highs. Stock prices declined after reaching the level of the early 2011 local bottoms. Further declines appear to be somewhat unlikely at this time. It seems that a consolidation or some sideways trading could actually be a plus for stocks and possibly lead to a stronger rally thereafter. Since the latest move prior to the consolidation period was to the upside, the subsequent move is likely to be positive as well. After all, what looks like a quick decline from a weekly perspective, is in fact a visible consolidation from the daily point of view. Please take a look below for details.
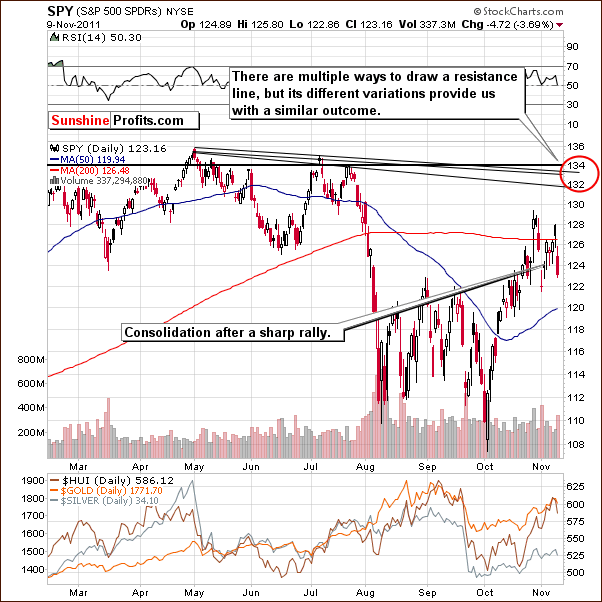
In the short-term SPY ETF, we see that the late-October – early-November trading sideways could be viewed as a small flag formation, and most of these patterns are followed by a move similar to the one that preceded it. In this case, that would mean a move much above 2011 highs, but let's take a conservative approach and assume that this rally would take stocks to the previous highs or so (marked on the chart with red ellipse).
The conservative approach appears appropriate also given the current situation in the financial sector.
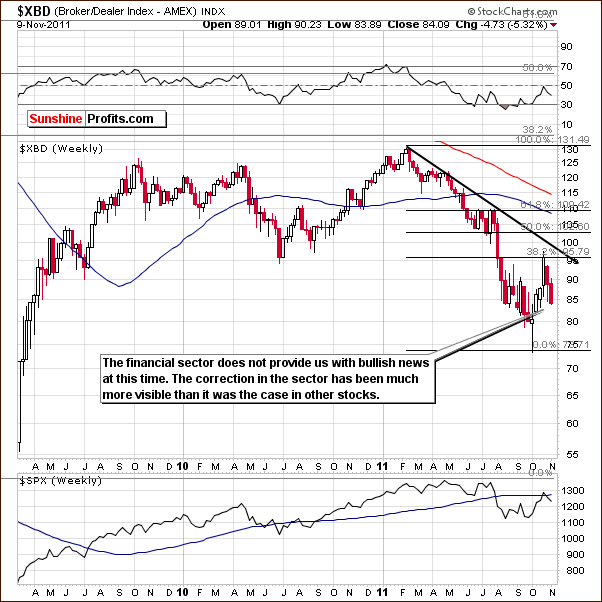
In the Broker Dealer Index (proxy for the financial sector) chart, we have some initial concerns. The declines seen here have been greater than those in the general stock market this week. Since the financials generally lead stocks, this is normally a rather bearish signal.
There are some fundamental factors however, that must be considered at this time. The banking sector has been hit hard by the situation in Greece. Decreased profits or increased losses have been seen in many financial institutions. The downturn in the financials therefore may not be due to investor sentiment at all. The situation here is slightly bearish, whereas the general stock market outlook is slightly bullish at this time.
Summing up, the situation for stocks is mixed with a slightly bullish bias. It seems that stocks may be gathering strength for a new rally and this eventual move to the upside still appears more likely than further declines. Additional small move lower is not out of the question (say to 120 in the SPY ETF), though and it would not invalidate the bullish picture.
In order to confirm the bullish case, please take a look at the popular mainstream financial website and read the headlines. Are they optimistic about the economy or the stock market? No, they are pessimistic and yet, the general stock market is not that far from its 2007 and 2011 highs. What accompanies major market tops is a lot of positive and even ecstatic news and almost all investors believe that the market will move much higher. Is that the case today? Most certainly not. The headlines are negative, there is fear among investors and many of them are waiting on the sidelines. This means that when they “join the party”, they will contribute to further increases in prices.
Is the situation in Europe really that bad in the short run? The situation in Greece appears to be under control, and the situation in Italy is not yet critical. What we have is the fear of the situation becoming critical and that's much different. The point is that once the fear subsides stocks are likely to rally.
Correlation Matrix
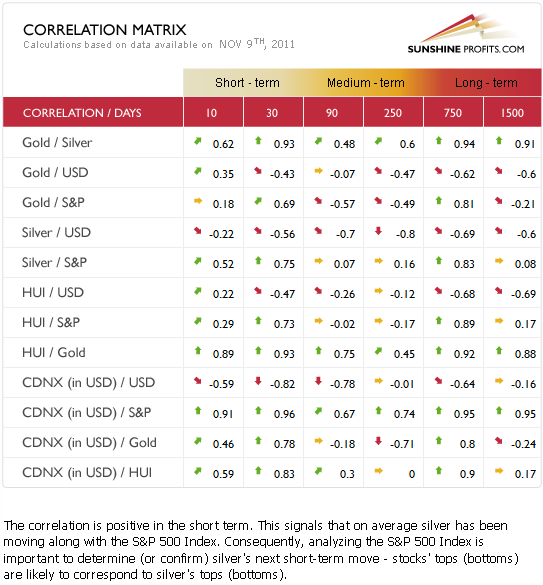
In this week's Correlation Matrix, a tool which allows us to see the impact of the currency markets upon the precious metals, we see that silver is once again highly correlated with the general stock market. This has likely hurt silver this week for when stocks declined, silver's rally could have been held back somewhat.
It seems that some investors are waiting for a clarification that stocks will rally before opening new positions in the white metal or switching from gold to silver. There are many more industrial uses for silver as compared to gold and therefore it is more closely tied to stocks. For the past year, silver has been correlated to a greater extent with the general stock market than it was the case with gold and mining stocks. Consequently, when stocks finally rally, silver may begin to catch up with the rest of the sector.
The lower coefficients between the dollar and precious metals overall is due to the strength the metals have shown this week versus the dollar and the implications are bullish for the metals sector.
Gold
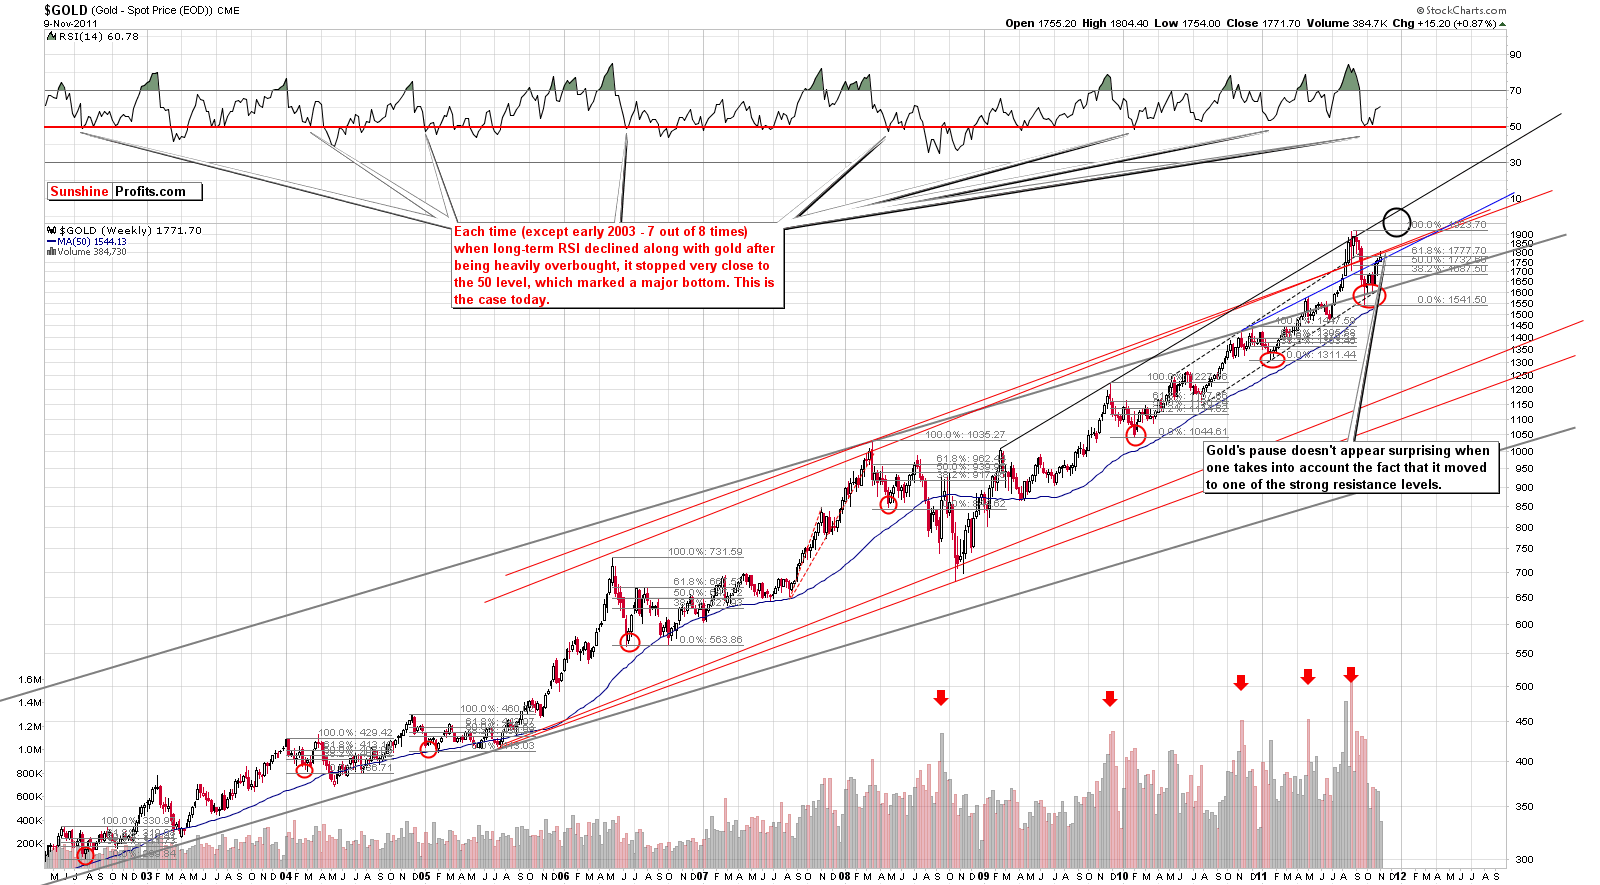
This week we begin our gold section with a look at the very long-term chart (please click the above chart to enlarge). Gold has paused somewhat in its recent huge rally, but from a long-term perspective this decline appears quite small. We look at this chart to see if Wednesday's market action is cause for concern.
Given that gold has reached the upper border of the very long-term trend channel based on the 2005-2011 rally, the 1.5% decline seen on Wednesday is not really of great concern. This appears to be quite a normal development and since this same resistance line has been broken recently, it could fail to hold gold's rally when approached once again. In short, the pause in the rally is not something to worry about right now.
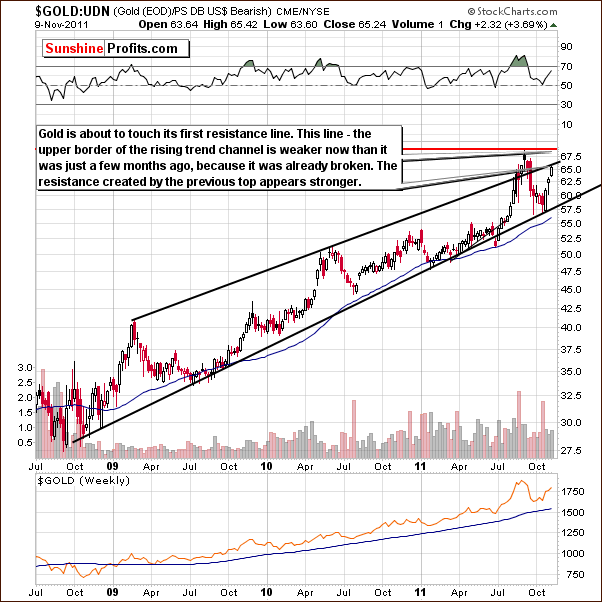
In this week's long-term chart of gold from a non-USD perspective, gold has reached the upper border of the rising trend channel, a resistance level which was broken just a few months ago. The resistance level created by previous tops is likely much stronger. The pause is visible in this chart but it is unlikely that the rally has stopped. A move to the level of previous highs seems to be a good possibility.
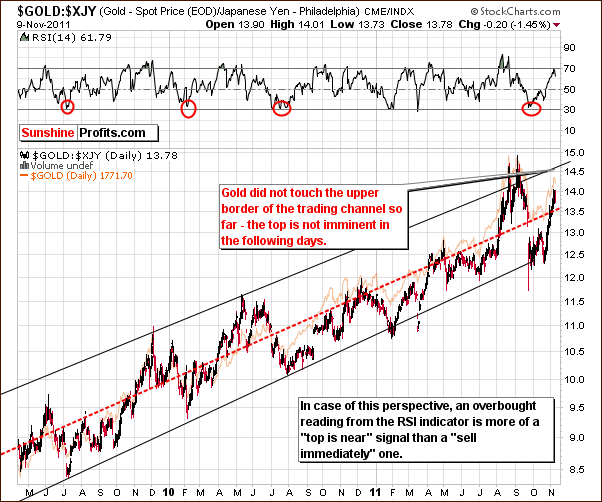
Looking at gold from perspective of the Japanese yen, the RSI level of the index is far from oversold and is not giving a “sell immediately” signal either. It seems the time to sell would likely be when the index moves up to around 14.5 – 15, the upper border of the rising trend channel. In the past, RSI levels close to 70 did not coincide with final tops for this index. Generally, an intermediate top was seen followed by a period of additional rally. This seems to be a likely scenario for the coming weeks here as well.
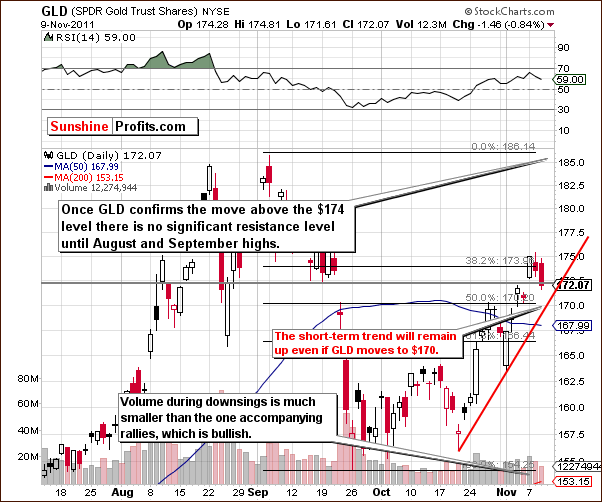
In the short-term GLD ETF chart this week, we see that the decline in gold's price has not changed the short-term trend. Prices are well above the rising support line and insignificantly below the level of the mid-September low. As we mentioned in last week’s Premium Update, “There is still an important resistance line in play, the 38.2% Fibonacci retracement level based on the whole September decline.“
The GLD is now verifying a breakout above $172 and appears to be consolidating somewhat. The move above the resistance line close to $174 was not verified, however. There does not seem to be a need to worry as it still appears that an additional rally will likely come soon. In fact, even a move lower, to $170, would not be a reason for concern.
Volume levels this week were low on declines and higher when prices rose. This confirms the bullish, short-term outlook here.
Summing up, the short-term trend for gold remains up and Wednesday's price decline was truly quite small in relation to the size of the recent rally and the daily upswings of the past week. This is a sign of strength especially when considering that the dollar was moving higher as well. It appears that the outlook for gold continues to be bullish for the short and long term.
Silver
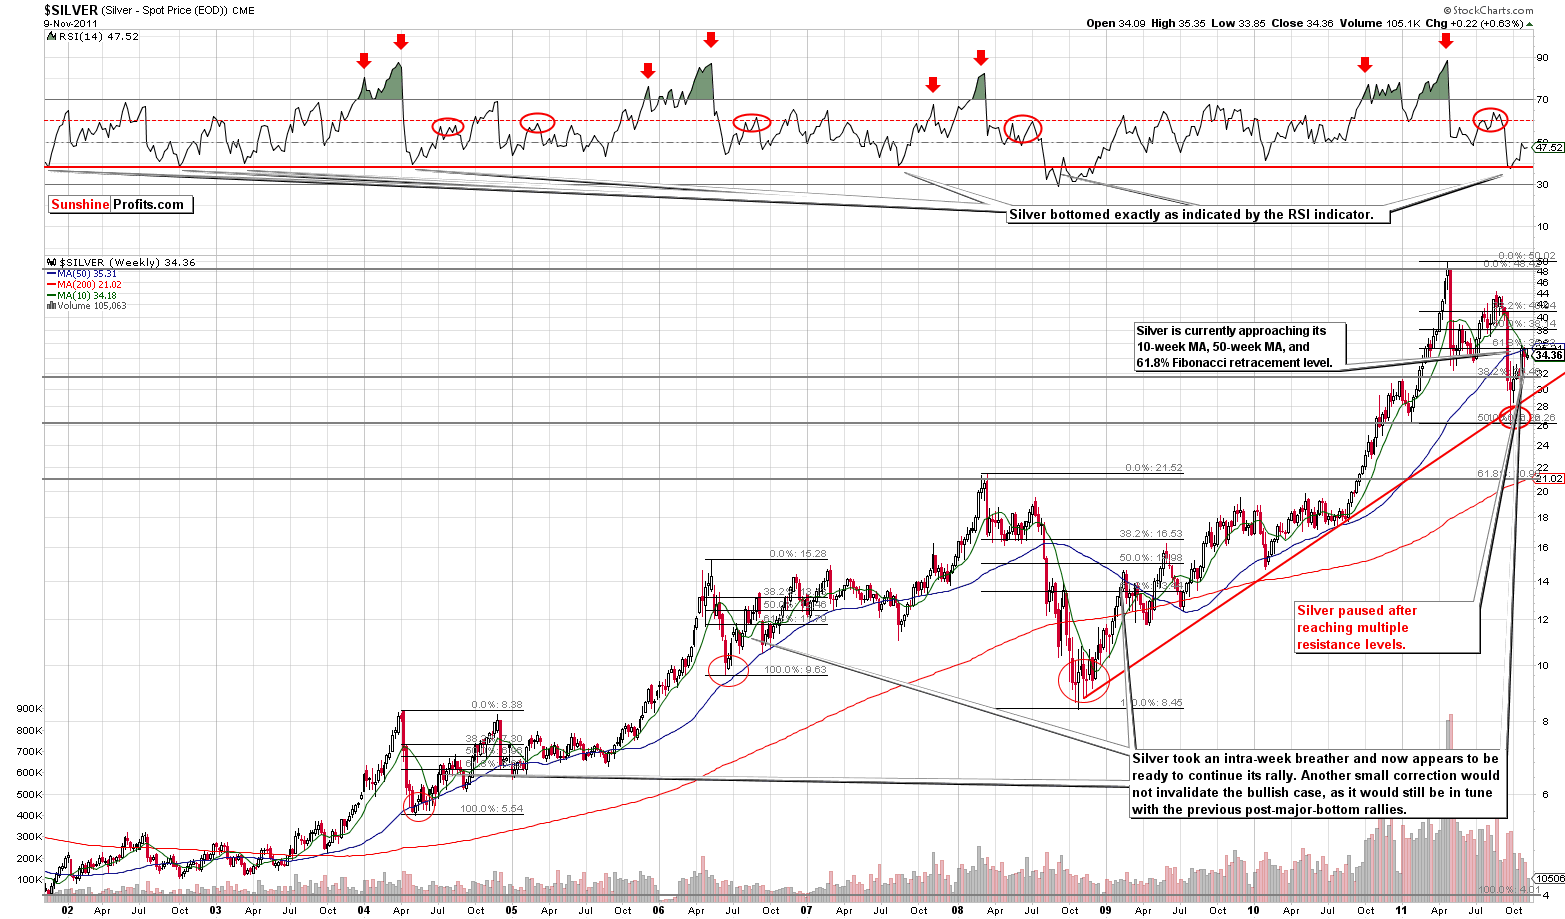
In this week's long-term chart for silver (please click the above chart to enlarge), there has basically been no change this week from the very long-term perspective. Silver's price is close to multiple resistance lines and a period of sideways trading has been seen in recent days. This is not cause for concern, however, as the white metal is known for catching up in the latter part of its rallies. Silver's rally has been smaller than gold's of late, so this may mean that neither silver nor gold are close to the end of their rallies at this time. The consolidation periods of the general stock market and the white metal have coincided recently as well.
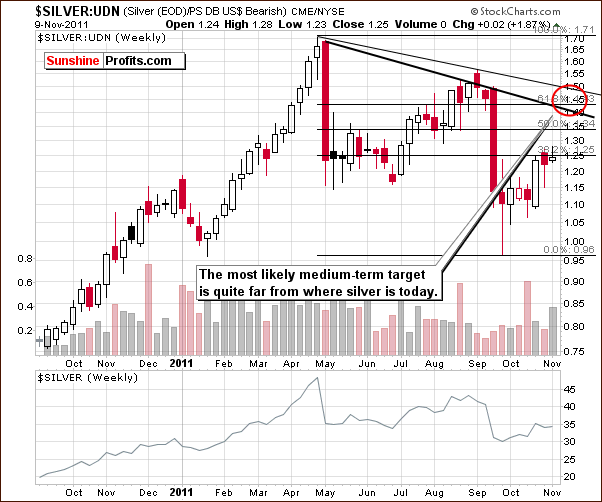
This week, we take a look at silver from a non-USD perspective. The index is far from its likely target level which is created by the 68.1% Fibonacci retracement level and the medium-term declining resistance line. The recent upswing has been fairly small so far and it appears that higher values are likely to be seen here.
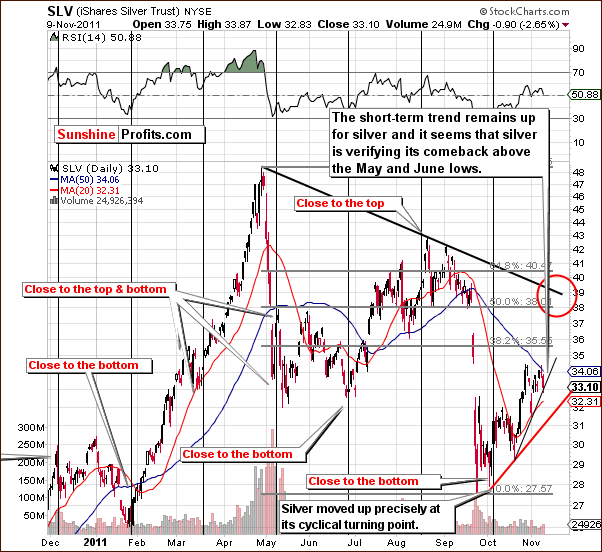
In the short-term SLV ETF chart this week, the trends for the short term and the very short term remain up. Likely target levels are in the $38 to $39 range. There is no significant change in our analysis of this chart since last week. Silver may be verifying a move above the May-June lows. It appears to be consolidating above that level and once a base is built, a further rally could very well be seen.
Summing up, the situation in silver appears to be bullish at this time even though Wednesday's decline could have scared some of the silver bulls. Silver generally performs better in the latter half of its rally and this seems to be a good possibility once again.
Gold and Silver Mining Stocks
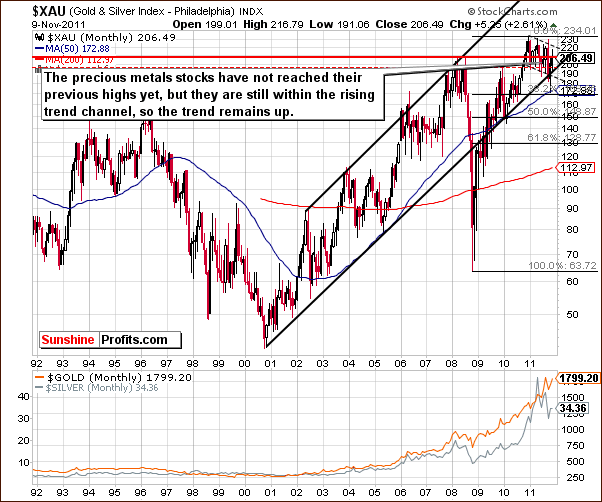
In this week's very long-term XAU gold and silver miners' index chart, we did not see an immediate move to the level of previous highs. However, the index is well above the lower border of the very long-term rising trend channel so the outlook is still bullish at this time. No other important signals are seen here this week.
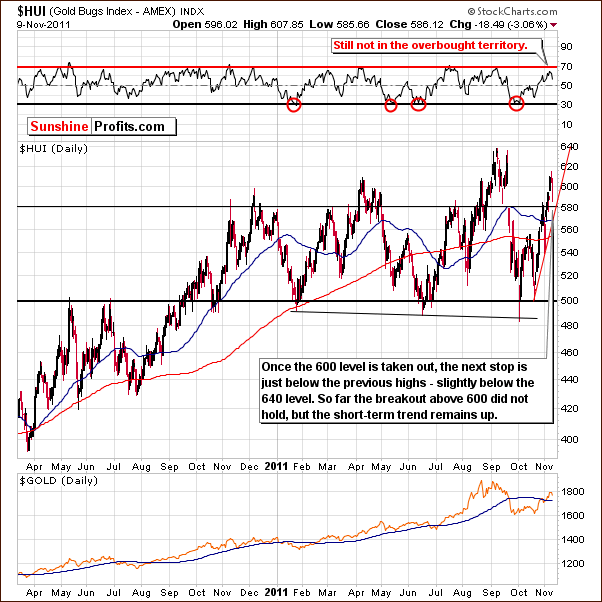
In this week's long-term HUI Index chart, the short-term trend appears to be up similarly to the situation in silver and gold. Gold stocks moved above the 580-level resistance line and are now verifying this breakout. An additional rally is quite likely once the verification is complete. The RSI level here is far from overbought and Wednesday's decline brought it closer to the middle of the trading range. At this time, the RSI appears to indicate room for an additional period of rally in the index.
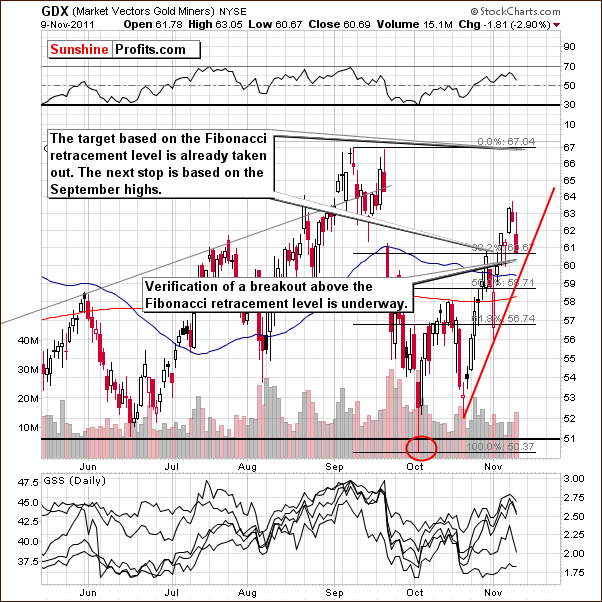
In this week's short-term GDX ETF chart, the short-term trend continues to be bullish. Wednesday's decline was stopped by the 38.2 Fibonacci retracement level based on the September to early October decline. The miners appear to be verifying above this level.
If prices hold above the rising trend channel, this will be very bullish for the short term. Strong volume was seen on Wednesday's decline but this is not a bearish sign here. In early and mid-October, as well as early November, high volume levels were seen as local bottoms were reached. The next moves were to the upside.
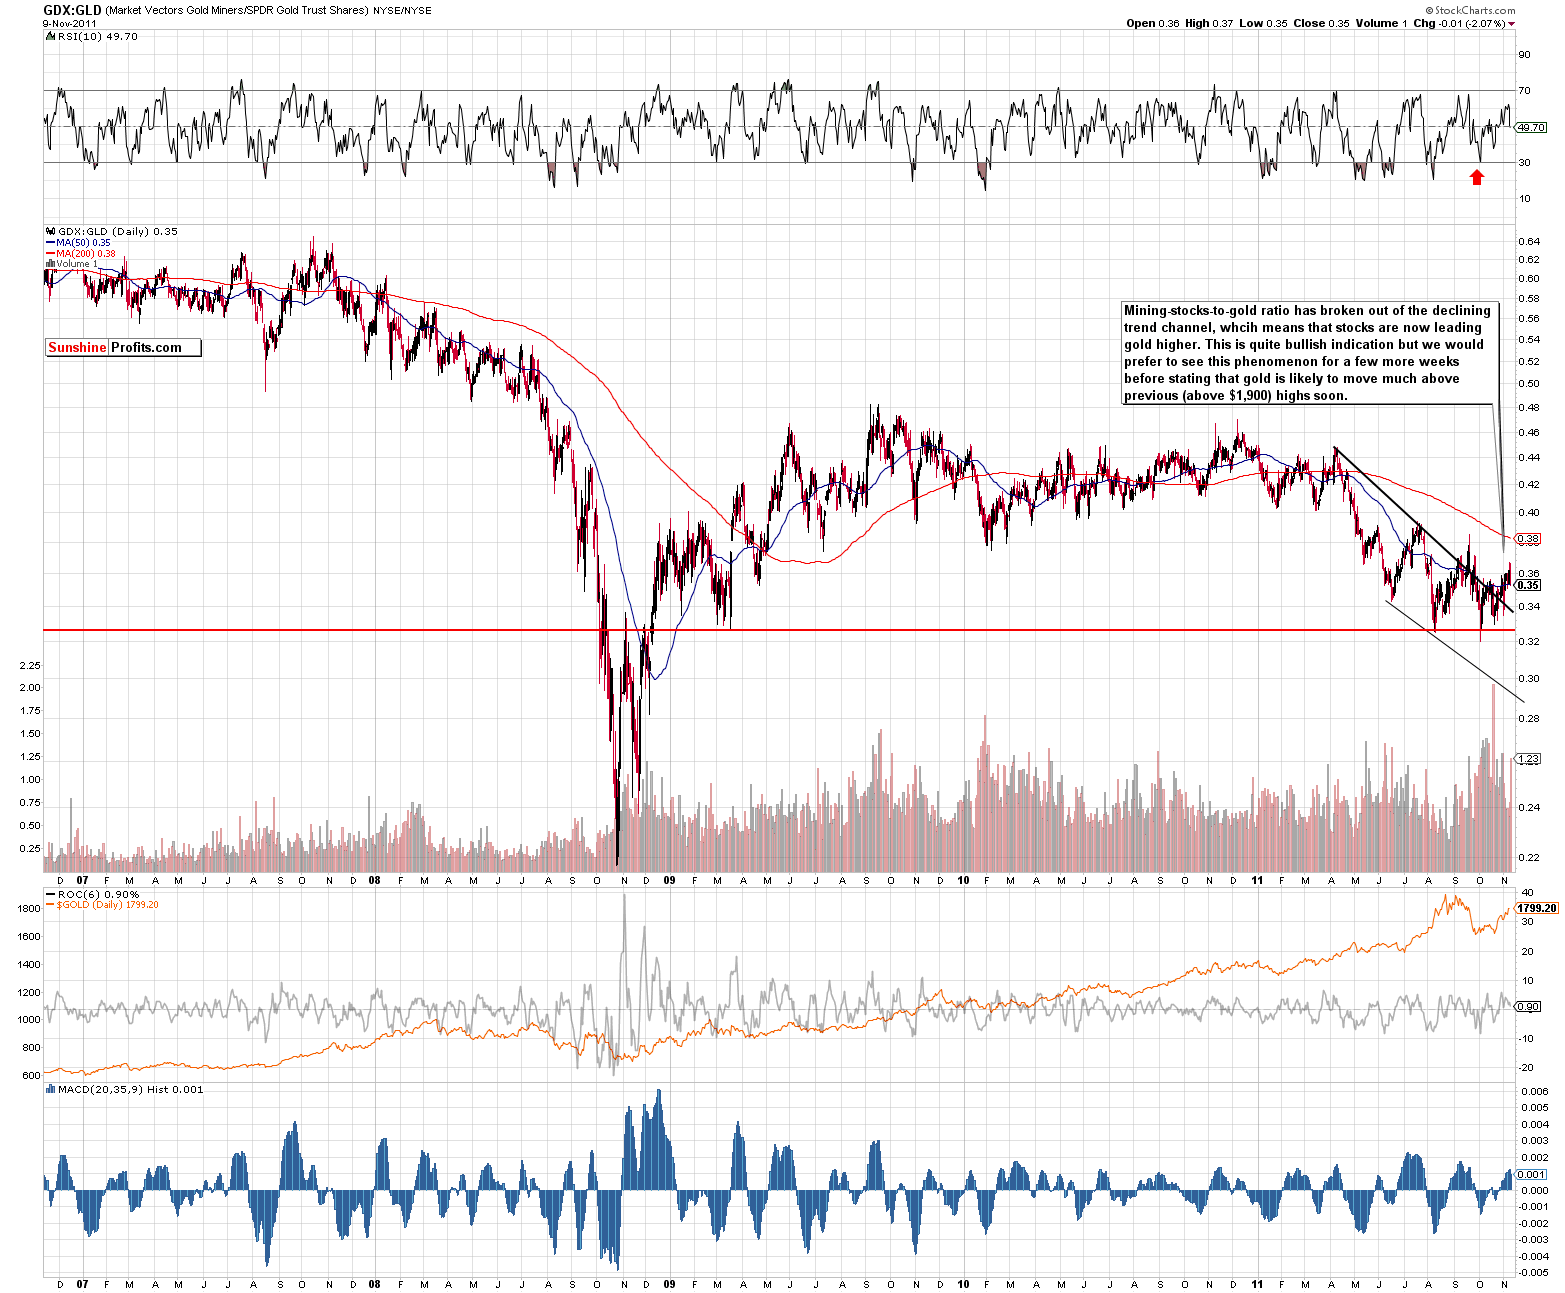
Taking a look at this week's miners to gold ratio chart (please click the above chart to enlarge), the breakout above the declining resistance line is clearly visible and appears to be intact. This means that mining stocks are now leading gold higher which is a very bullish phenomenon. The first years of the bull market saw this type of situation frequently.
If this continues to be the case, it bodes well for mining stocks and the rest of the precious metals sector. Higher prices will appear to be in the cards. Before stating that gold will move above its previous highs however, we would like to see the mining stocks continue to lead gold for a few more weeks.
Summing up, the trend for mining stocks continues to be bullish as is the case for gold and silver. Declines seen on Wednesday appear to be insignificant in terms of the bigger picture.
Platinum
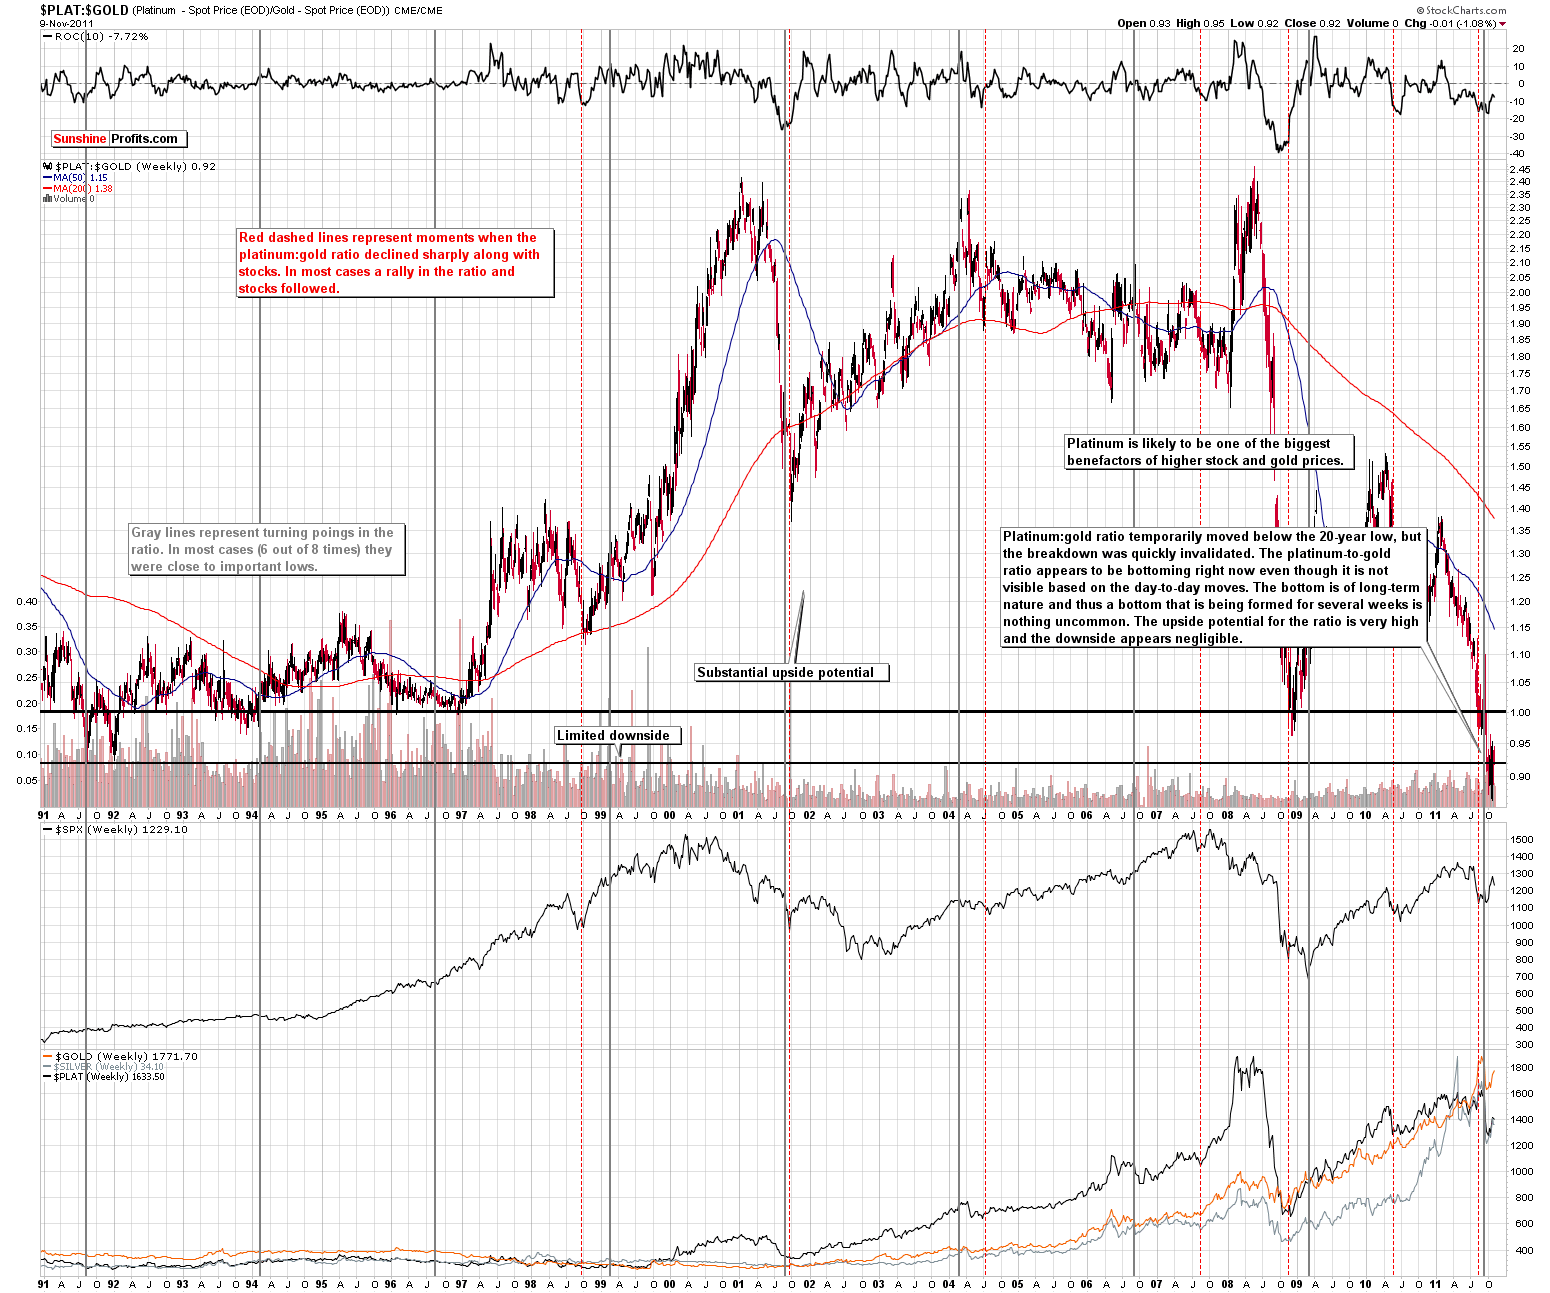
The platinum to gold ratio chart (please click the above chart to enlarge) is included in response to a question we received this week. Does the recent weakness of platinum relative to gold reflect poorly upon the health of the precious metals market and the current rally? We look at the long-term picture since we feel that it is best to follow because the 2011 decline in platinum's price is a long-term phenomenon. We are seeing a bottoming process in the platinum to gold ratio and the recent move below the 20-year low point was invalidated as the ratio moved back up. The very long-term picture points to a bottom being in place today or at least it is not suggesting otherwise.
The following move will likely be long-term in nature and could last for more than a year. It also appears that higher prices will eventually be seen. Platinum's price has been higher than gold's for more than 95% of the time over the last 20 years.
Long-term cycles are noted on the chart with vertical gray lines. Please examine to see what follows the cyclical points. The rapidness of the decline is marked with the dotted red vertical line. Both suggested a turnaround in the precious metals and general stock market a few weeks ago. The ratio has not moved higher but is still likely to do so, based on its history. The upside here is enormous compared to the limited downside and the ratio is now at the level of its very long-term low.
A look at 2008, after a sharp decline was seen, shows that gold initially moved higher at a faster rate than platinum. Overall however, platinum has outperformed gold over the long term (after the major bottom) and this will likely be seen once again. A rally in the general stock market will likely have a positive influence on platinum because of this metal's industrial uses.
Letters from Subscribers
This week we've received several letters regarding our latest message. In short, it was about the recent misunderstanding over CME maintenance margin decision.
A number of financial commentators misunderstood the recent CME statement and assumed that margins would rise. They jumped to conclusions without all the facts, creating even more confusion among precious metals investors.
Our November 7th message was intended to allay those fears and clarify the margin situation. Quoting from the message:
Before getting into detailed discussion on the margin increase impact, let's focus on one simple fact. The margins are not going to be increased, but lowered.
However, we also took the opportunity to explain the implications of a margin rise, IF one were to occur (which it did not). This was purely for the educational benefit of our subscribers. Unfortunately, some misunderstood and thought we too were expecting a margin rise:
I think you may be reading this incorrectly. Originally the CME announcement… on Sat Nov 5 was clarified as not a hike in margins but as a reduction… It is just a mix up!
In the spirit of making lemonade from lemons, we want to use this mix up for your benefit. We want to stress the importance of analyzing all available information as objectively as possible. It is important for investors to read information (from newspapers, newsletters or websites such as ours) closely so as to prevent errors, and thus avoid the wrong conclusions. Well-researched information from a variety of reliable sources can mean the difference between profit and loss.
We apologize for any confusion, and we appreciate everyone's patience on this matter. Our readers can continue to expect innovative, original analysis that takes a closer look at the markets, and is not swayed by the hype.
Summary
The currency markets have been rather unclear on a short-term basis. Even if the USD Index moves higher, the rally will probably be short-lived and have little negative impact on the precious metals sector. If the dollar declines however, gold, silver and the mining stocks will likely see strong rallies. The overall implication for the precious metals is bullish.
The situation in the general stock market is slightly more bullish than not at this time. If stocks do move higher, this rally will likely have a positive influence on silver and make the recent weak rally a thing of the past. Silver could then rally at a stronger pace than gold.
The short-term trend for gold, silver and mining stocks continues to be bullish. Betting on higher values for precious metals and the mining stocks for the short and long-term still appears to be a good idea. Keeping open short-term speculative long positions and investing in precious metals for the long term seems to be a profitable strategy at this time.
Our next Premium Update is scheduled for Friday, November 18, 2011.
This completes this week's Premium Update.
Thank you for using the Premium Service. Have a great weekend and profitable week!
Przemyslaw Radomski

