
Is Greece the canary in the coal mine? Less than a week after European leaders crossed the T’s and dotted the I’s on the debt-restructuring plan for Greece, the prime minister's ruling party called for a surprise referendum on the E.U. debt deal. Then on Thursday he called it off. Sovereign debt and fiat currencies are all paper.
All that is happening only heightens talk about gold as money. We decided to devote this week’s essay to an in-depth look at this issue.
Is gold money?
But first, let's have a definition of money, it being a subject that interests almost everyone on the planet. Like Voltaire said: “When it's a question of money everyone is of the same religion.”
Wikipedia defines money as: “Anything that is generally accepted in payment for goods and services and in repayment of debts. The main uses of money are as a medium of exchange, a unit of account, and a store of value.”
Does gold fit this definition?
No other commodity has been as universally valued over time and across as many societies as gold. There is an emotional and cultural attachment to it handed down to us through the generations. It is undoubtedly a store of value, it is a unit of account, but is it used as a medium of exchange?
Not really, other than in Utah which took steps recently toward making gold legal tender. Other states have proposed similar measures. But people today are completely unfamiliar with the use of gold as money since everyone uses paper money or bank credit money, such as checks and credit cards.
According to the Austrian economist Carl Menger, its acceptability in trade is the defining property for money and gold does not fit that criteria. According to Menger, while money undoubtedly does serve as a store of value and a unit of account, these properties are derivative, not definitional properties. The reason that a medium of exchange (money) necessarily is also a store of value is the anticipation of its exchange value in the future. The question of whether any particular good is money, can be articulated thus: Is it accepted as the final means of payment for transactions?
At present almost all the nations have their own fiat money or else they belong to a currency union such as the European Union. Some nations use the US dollar. Hardly anywhere do we see gold accepted as a means of payment. So gold must fail the definitional test of being money.
So gold is not really money anymore (not yet?), but keep in mind that it does have most of the desirable properties of money. It is durable, portable and easily divisible into bars and coins that share uniform properties. It is easily recognizable. Gold's value and purchasing power are stable over time, as its supply grows slowly and it cannot be created ad infinitum as fiat paper currency can be.
For nearly three thousand years since the first gold coins were struck in Lydia in 700 BC, Gold's primary use has been recognized as a medium of exchange. The history of gold as money in coin form spans 2630 years, from 700 BC to about 1930 AD. In comparison, the history of paper and base metal and silver coin in circulation spans only about 40 years, from 1930 to 1970. And the history of paper and base metal coin with no connection to Gold or silver, also spans a period now approaching 40 years - from 1970 until today.
So it's 2, 630 years of history for gold as money versus about 40 years for fiat currencies not tethered to gold.
Gold coins in the United States were removed from circulation by executive order in 1933. In Europe, the banks' suspension of redeemability in gold coins took place within weeks of the outbreak of World War I in the summer of 1914. England restored redeemability in 1925, but a public run on the Bank of England's gold forced the Bank to suspend payment in 1931.
It was on August 15, 1971 that U.S. President Richard Nixon "closed the gold window" and broke the last official tie between Gold and a circulating currency. This resulted in the financial system of our "modern" era - the "floating currency" system.
After 1971, several central banks sold some of their gold holdings because the only upside to holding gold is the speculative return if the gold price rises or as a store of value against banks' money creation mechanisms - somehow banks never wanted to hedge against the latter... Anyway, gold was no longer money, and holding it earned no interest.
Most economists wrote gold off when the dollar's link to gold was cut. Noble Prize Winning Economist Milton Friedman predicted that the price of gold would collapse since gold derived its value from its relationship with the dollar and without gold backing up the dollar there would be far less demand for gold. The vast supply that had been accumulated over the centuries would overwhelm the market, depressing gold price for the foreseeable future. Sometimes even a noble prize winning economist can be wrong. In fact, it was the dollar that collapsed in the 1970s, while the gold price in dollars began a bull run.
Why is gold a better store of value than most any other option? Politicians and economists assume that it is only political institutions, central banks for example, that have the final say over what is and is not money. But perhaps that is not the case. Maybe it is the market that has the final say.
The qualities that have made gold and silver legal tender over the centuries are still inherent in the yellow and silver metals. Fiat money has some of these qualities but it fails when it comes to the scarcity test: it is too easy to create more of it, lots more of it.
As more and more people lose faith in fiat money gold functions as an alternative that competes with political money. It remains a store of value because of its potential to become money once again and it is a hedge against the breakdown of the fiat system. When society and the monetary system break down, even if nothing else is accepted as a medium of exchange, gold still will be. The market will only continue to accept fiat money as long as it trundles along. If governments debase their currency beyond a point where it maintains some value over time, people will stop using government currency and switch to something else. Gold?
Thomas Jefferson put it best in 1814 when he wrote: Scenes are now to take place as will open the eyes of credulity and of insanity itself, to the dangers of a paper medium abandoned to the discretion of avarice and of swindlers.
To see how gold will perform this week let's begin this week's technical part with the analysis of the Euro Index. We will start with the long-term chart (charts courtesy by http://stockcharts.com.)
Euro & USD Indices – Currency Markets
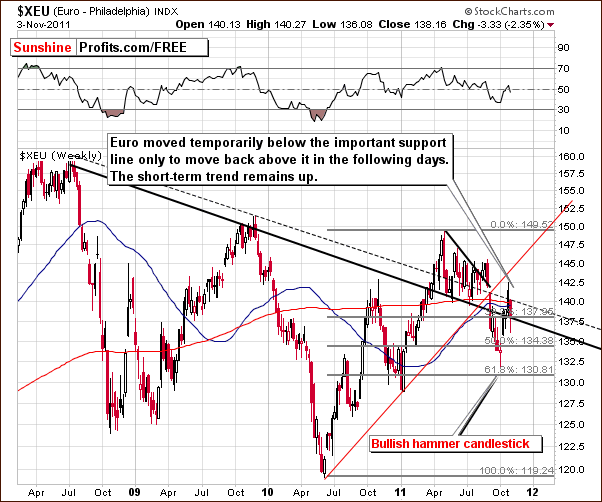
This week, we begin our analysis section with a look at the long-term Euro Index chart, which is based on weekly closing prices. We can see that the currency has moved below a key support level. This declining long-term support line coincides with the 38.2% Fibonacci retracement level based on the early 2011 rally which covered nearly a four month period. Almost immediately after this line was broken, the index reversed direction. Therefore, no breakdown was confirmed. The short-term trend here remains up.
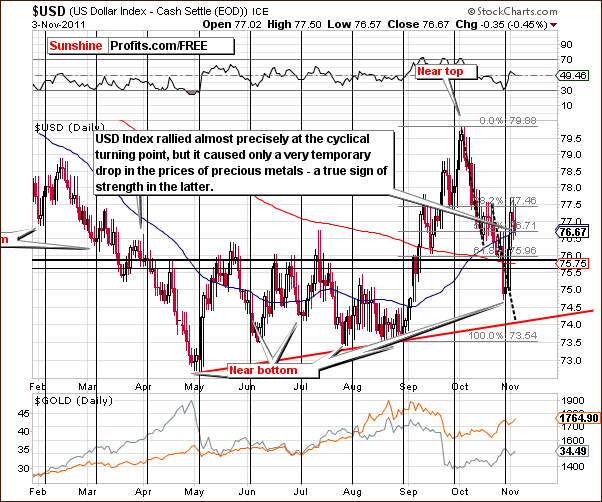
In the USD Index chart, the short-term trend will likely be to the downside even though the index has shown a significant rally this week. The recent local bottom occurred right at the cyclical turning point. The decline now underway has a likely target level close to 74. This is almost 3 index points below Thursday’s close, so it is quite a significant drop.
This is not, however, the most important point of concern for gold and silver investors. Even though the USD Index rose early this week, gold price actually moved higher despite early-week weakness. This price action is a clear sign of the strength of the precious metals market. It is the most important implication drawn from the currencies for investors this week.
Summing up, the outlook for the euro is bullish and for the dollar situation is bearish, even though contra-trend moves were seen in both indices earlier in the week. The currency markets allowed us to gauge the strength of the precious metals sector and they do indeed appear to be quite strong on a short-term basis at this time.
General Stock Market
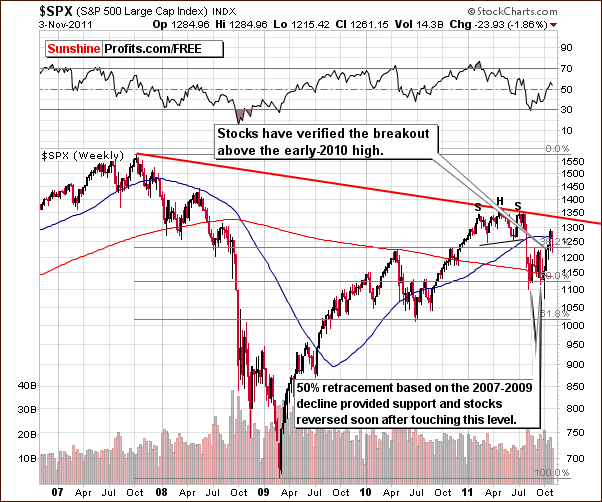
In the long-term S&P 500 Index chart, the recent decline was nothing more than a verification of the recent breakout above the 2010 highs. The short-term trend is clearly bullish and the upside target level remains at $1,340. This is consistent with our analysis in last week’s Premium Update in which we stated that “the present upside target level for the S&P 500 Index is between 1330 and 1340.“
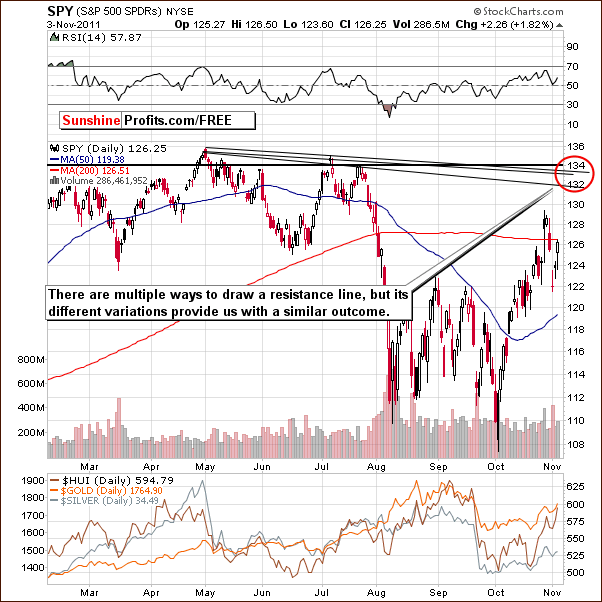
In the short-term SPY ETF, we see that several important resistance lines currently reside in the $132- $134 trading range. Multiple lines drawn by connecting previous tops are all quite similar in nature. This area of our chart is the obvious target level at this time and quite important as well.
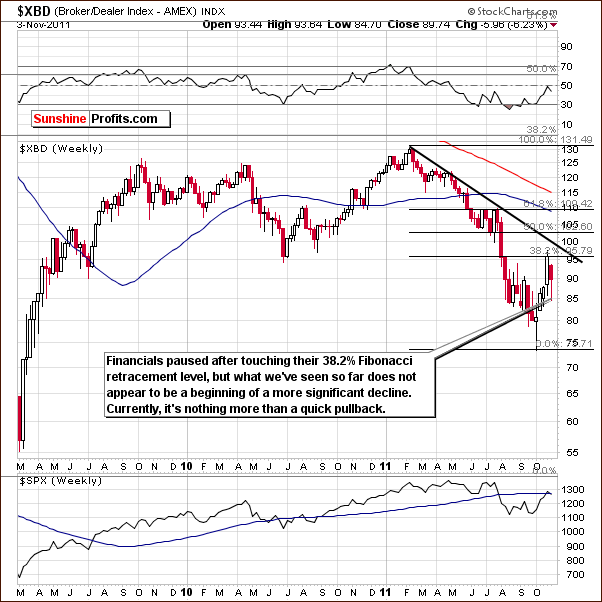
In the Broker Dealer Index (proxy for the financial sector) chart, we see that the rally has paused after reaching the 38.2% Fibonacci retracement level based on the previous decline. A consolidation at this point in time is quite natural and should not at all be regarded as bearish. In fact, no bearish implications are drawn from the financials chart this week.
Summing up, the situation for the general stock market is still bullish and the next target level for the S&P 500 appears to be around $1,340. This target level is formed by drawing a line from the head to the right shoulder of the head-and-shoulders trading pattern which developed earlier this year.
Correlation Matrix
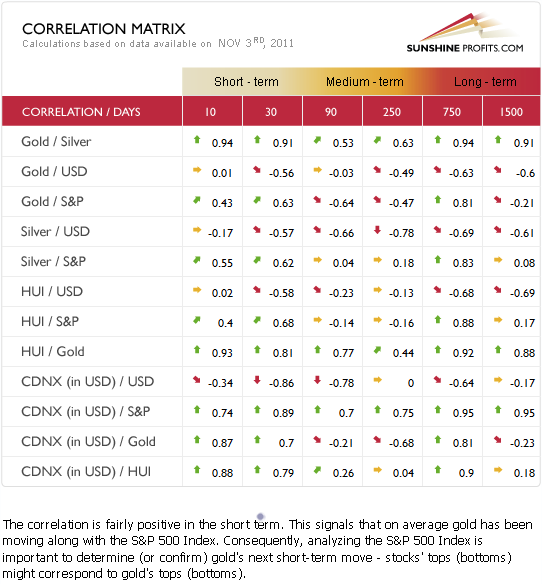
In this week’s Correlation Matrix, a tool which allows us to see the impact of the currency markets upon the precious metals, it appears that things continue to get back to normal. We touched on this last week, and the correlation between the USD Index and precious metals is now significantly negative in the short-term 30-day column.
This is the way it normally plays out (metals move in the opposite direction to the value of the USD Index), although recently, the opposite relationship existed between these markets for a time. The general stock market is now showing a positive relationship with precious metals. These two coefficient relationships and others in the matrix confirm points made earlier in this update regarding the bullish outlook for precious metals. We now continue with a look at the precious metals charts directly.
Gold
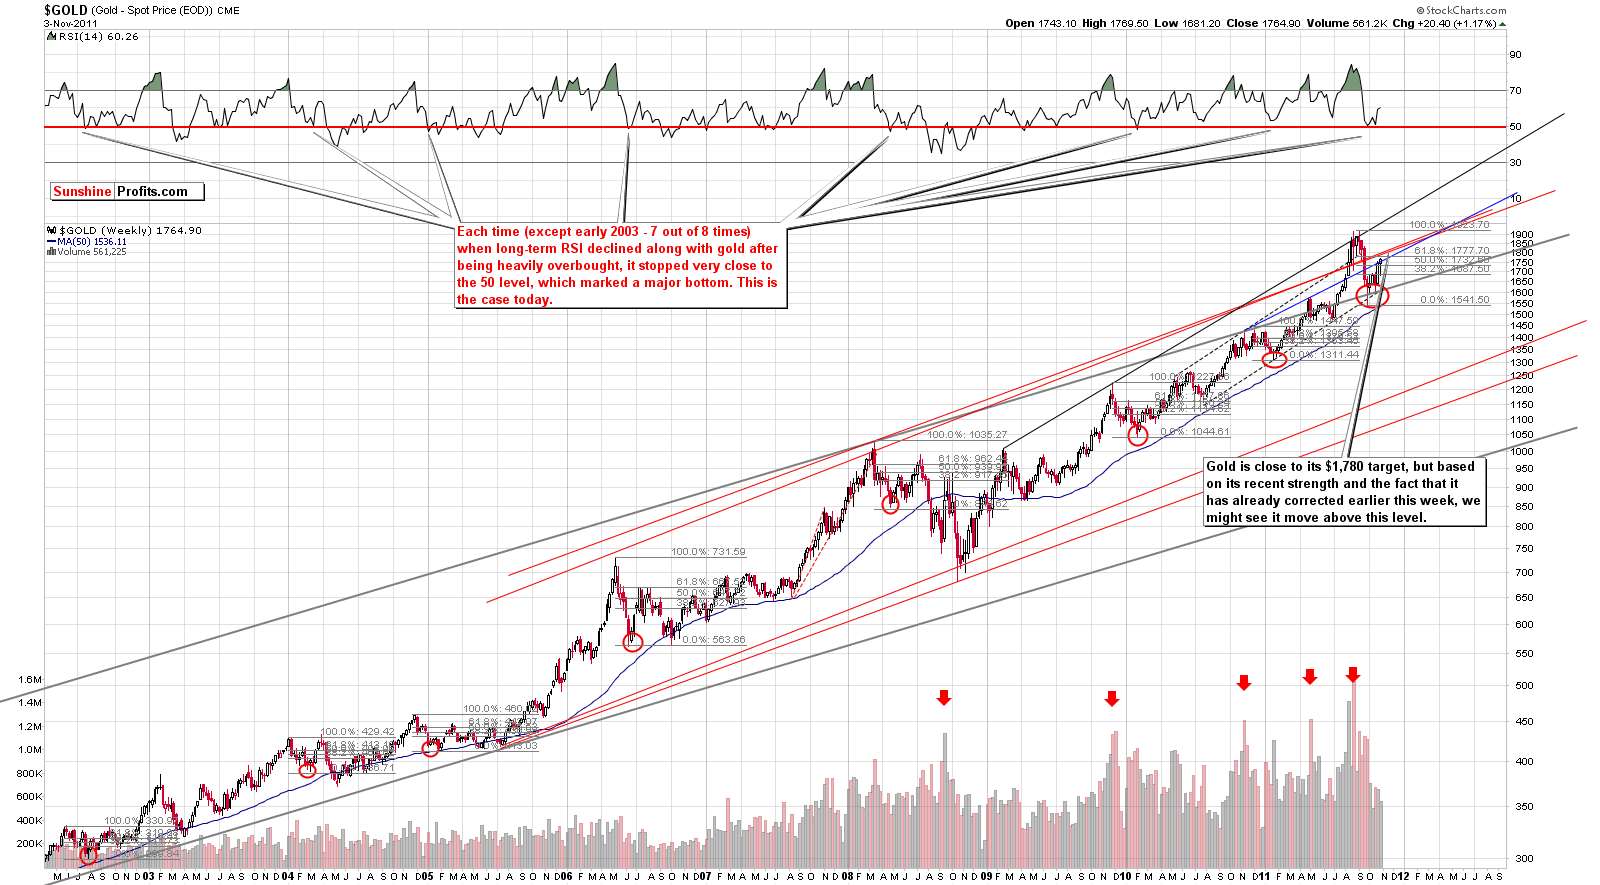
This week we begin our gold section with a look at the very long-term chart (please click the above chart to enlarge). Gold has moved closer to the $1,780 target level after bottoming a few months ago. This level coincides with the 61.8% Fibonacci retracement level based on the August-September decline in price. In other words, a rebound from the recent local bottom in the amount of 61.8% of the total previous decline would bring gold's price approximately to this level. This line could easily be surpassed if the move is similar in scope to what was seen earlier this year as well as in early-2011, 2010, 2004 and 2002.
This week, gold showed a great deal of strength, and because of this, it seems quite possible that we may not see a major top at the $1,780 level. Based on the signals from this very long-term chart and a study of prior similar price moves, gold's price could very well approach the $1,900 level or even move slightly above it.
While we usually feature gold:UDN ratio as an average of gold prices view in currencies other than the US dollar, we decided to feature them separately this week.
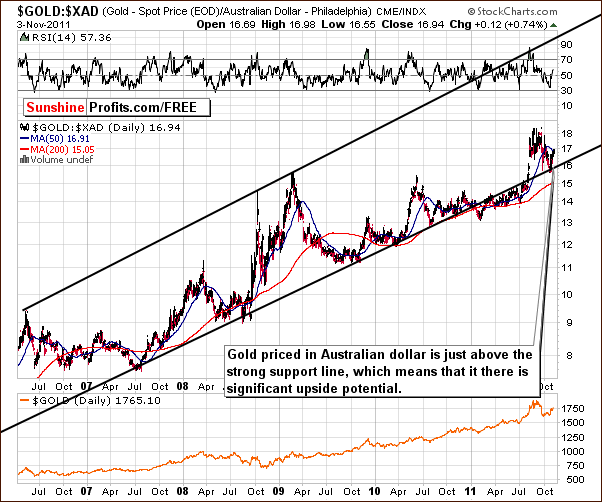
We now take a look at gold from the perspective of the Australian dollar. A local bottom was recently seen close to the very long-term support line. Since that time, the index level has moved higher and the upside potential here is indeed significant. With RSI levels around 50, the recent rally does not appear to be overheated in any way and the outlook is therefore quite bullish at this time – the trend remains up.
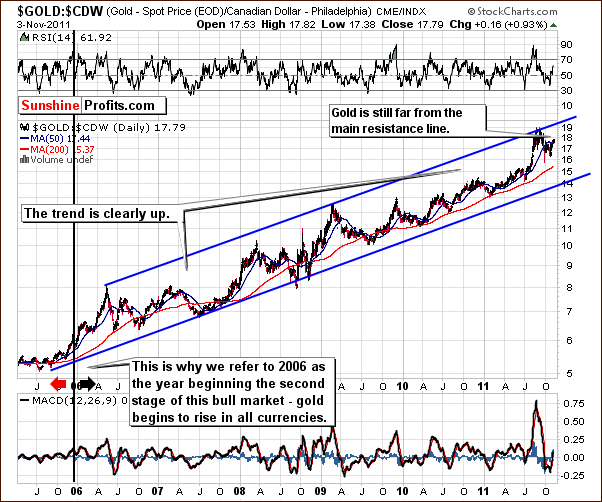
Looking at gold from the perspective of the Canadian dollar, we see that the current index level is not very close to the long-term resistance line and the likely trend from here appears to be to the upside. There is still quite a bit of room to the previous top and higher index levels are probable in the weeks ahead. The outlook here is also bullish based on these factors. The trend remains up.
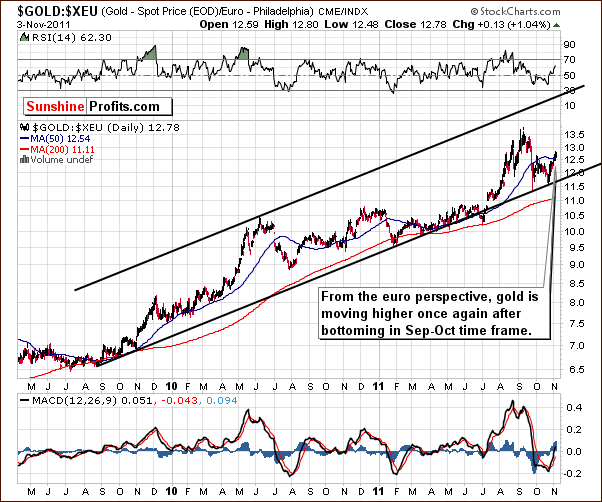
The euro perspective for the price of gold is one more view which appears to be bullish. A powerful rally has been in place for a few weeks now after the September-October double bottom. Similar multiple low points are seen in several charts this week and with this index far from a significant resistance line, a move higher will likely be seen.
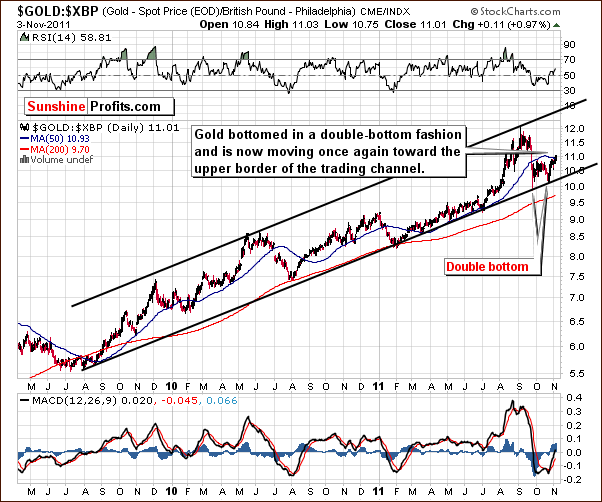
The view of gold’s price in terms of the British pound also shows an index level far from its next resistance. Here we see that the index recently bounce off its support line, and this normally indicates a much greater upside potential as compared to the downside possibility. Overall, the outlook is bullish here, and we see that there was also a double bottom in this chart recently. In fact, the British pound and Euro Index charts are indeed quite similar (and so are indicators based on these prices).
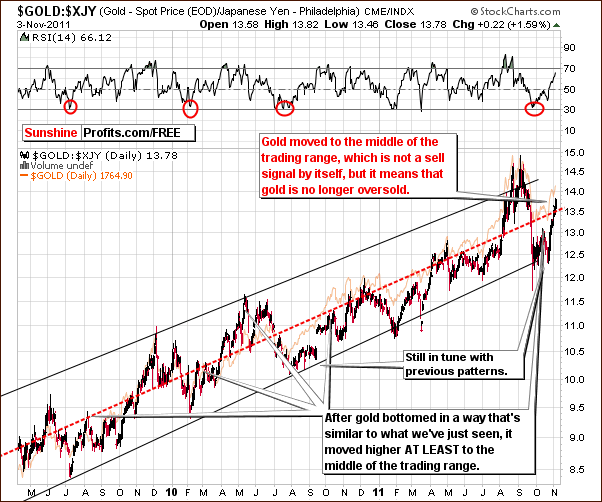
Looking at gold from the Japanese yen perspective, we see a much different picture. The index level is close to the middle of the trading channel, and RSI levels no longer indicate an oversold condition. This does not invalidate the signals from our previous charts as the middle of the trading range should be considered an “at least” index level. That is to say, when a move is seen to the lower border of the trading channel in this particular index, the following bounce normally sees a move to at least the mid-point of the channel. Although prices are quite likely to go higher from the USD perspective, the situation is more neutral than bullish in terms of the yen.
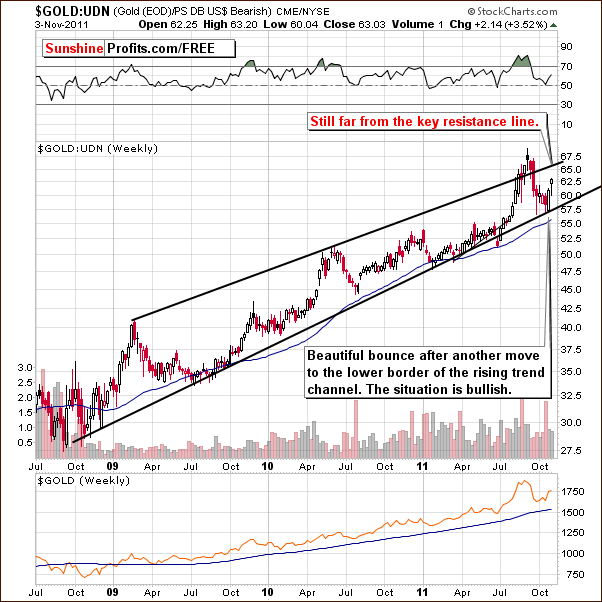
In this week's long-term chart for gold from a non-USD perspective (more or less the average of the above with the biggest emphasis on the euro perspective) which is an average of all other currencies, we again see gold far below its next resistance line. A rally appears likely here until this upper border of the trading channel is reached.
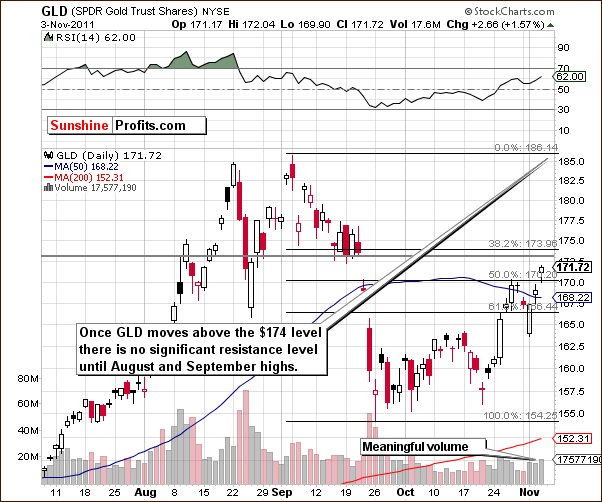
In the short-term GLD ETF chart this week, there is still an important resistance line in play, the 38.2% Fibonacci retracement level based on the whole September decline. Price levels here have approached this line which also coincides with the upper border of the September price gap. This could make the resistance level a bit stronger and result in some sideways trading or a pause in the rally. The emphasis here is on “could” as it doesn't have to be the case as we have already seen a correction.
It is likely that prices will eventually surpass this resistance level, and there is a good chance that it could move to the level of the previous highs seen in August-September. Such an expectation is consistent with the prior gold charts in this week's Premium Update.
Summing up, the situation in gold appears bullish for the long, medium and short term at this time. It is possible that the rally may see a pause for a few days or even for a week or two. It is expected, however, that this rally will continue, and the correction seen earlier in the week typically indicates that the gold markets are ready to move higher. It's probable that those without faith in the gold market have exited the market already. The $1,780 target level will likely be reached soon and could very well be surpassed in the coming weeks with the following target at previous highs close to the $1,900 level.
Silver
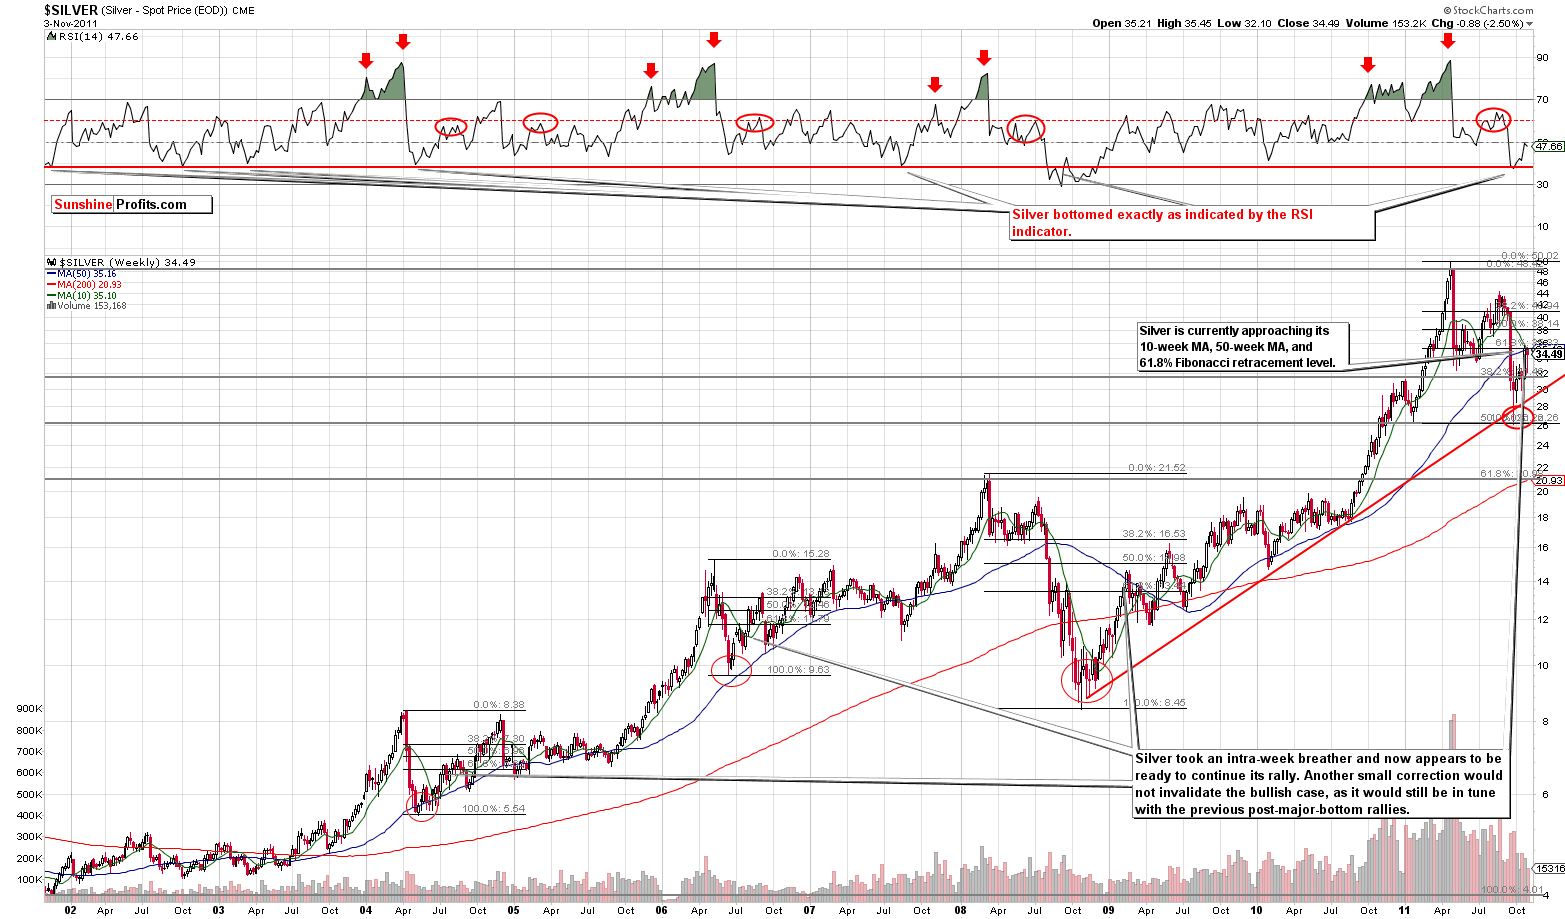
In this week's long term chart for silver (please click the above chart to enlarge), we see a move similar to what was seen in the general stock market. Silver also corrected early this week, but this correction is barely visible from the long-term perspective. Silver's current price level is actually quite close to where it ended last week. The short-term trend for the white metal is bullish based on the price correction having already been seen. It appears quite likely that the current rally will continue.
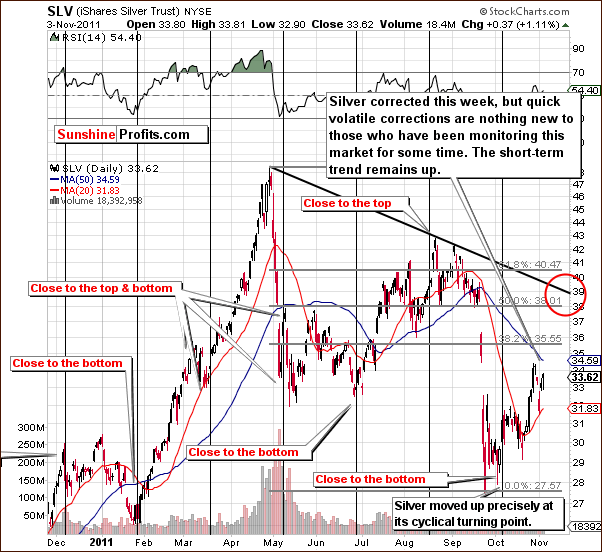
In the short-term SLV ETF chart this week, we see more significant details on the recent days' price action. The target level here to the upside appears to be between $38 and $39. This would correspond to a $40 price for the underlying metal. Once silver reached the $40 level, we will most likely consider closing speculative long positions. We will keep you informed as this point in time draws closer.
Summing up, the situation in silver is clearly bullish at this time. There may be more corrections and pauses along the way, but it seems that silver is on its way to at least $40.
Gold and Silver Mining Stocks
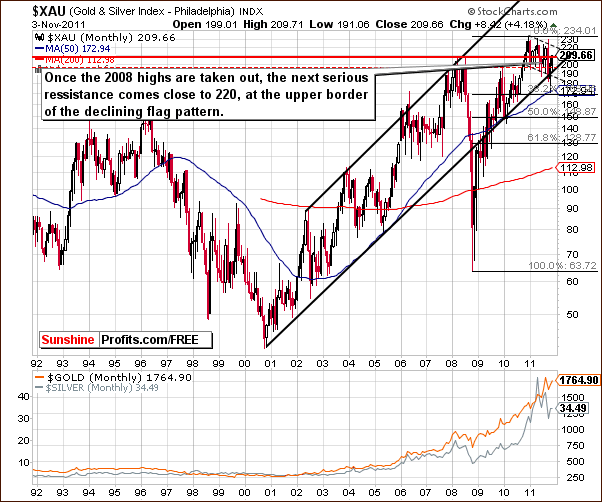
In this week's very long-term XAU gold and silver miners' index chart, we see that index levels are once again trying to move above their 2008 highs. Once this is accomplished, the next stop appears to be considerably higher, and an upside target levels of 220 and 230 (previous highs) seems reasonable. Once again we have a bullish situation at hand.
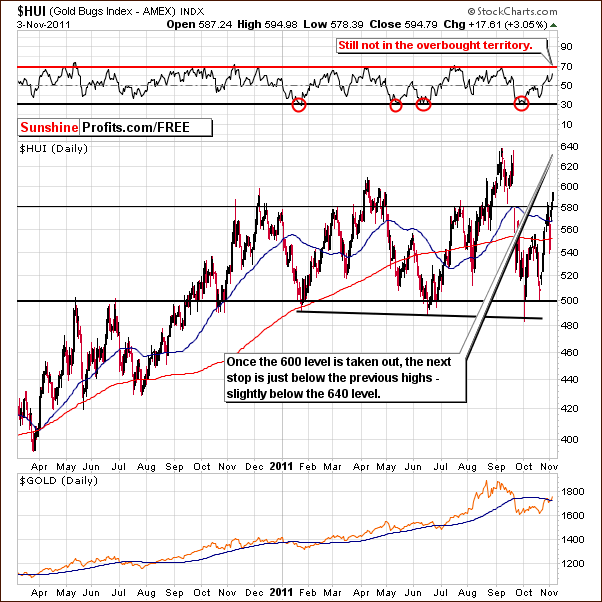
In this week's long-term HUI Index chart, the outlook is also bullish. It’s important to note that the RSI level here is still not yet in the overbought range. In the past, tops have previously formed when the RSI level was close to 70. This is not the case today, and although price corrections along the way have been significant, the time that it took was pretty insignificant.
Gold stocks are now close to the 600 level and once this is taken out will likely approach 640. This is the trading range of the September highs and could very well be reached again. The situation here remains bullish at this time.
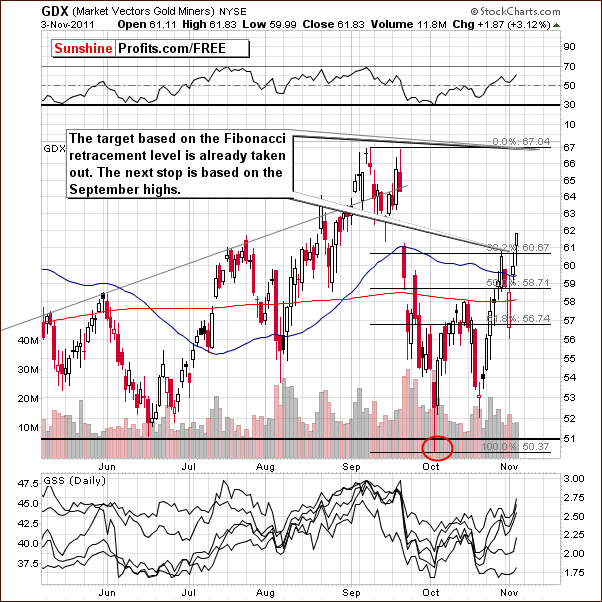
In this week’s short-term GDX ETF chart, we have seen a breakout which has not yet been confirmed. Based on this factor alone, the situation is only slightly bullish. However, other factors mentioned earlier (XAU, HUI charts, and metals sections) suggest that a move higher is more likely than not. The next target is at the $67 level - at the previous highs.
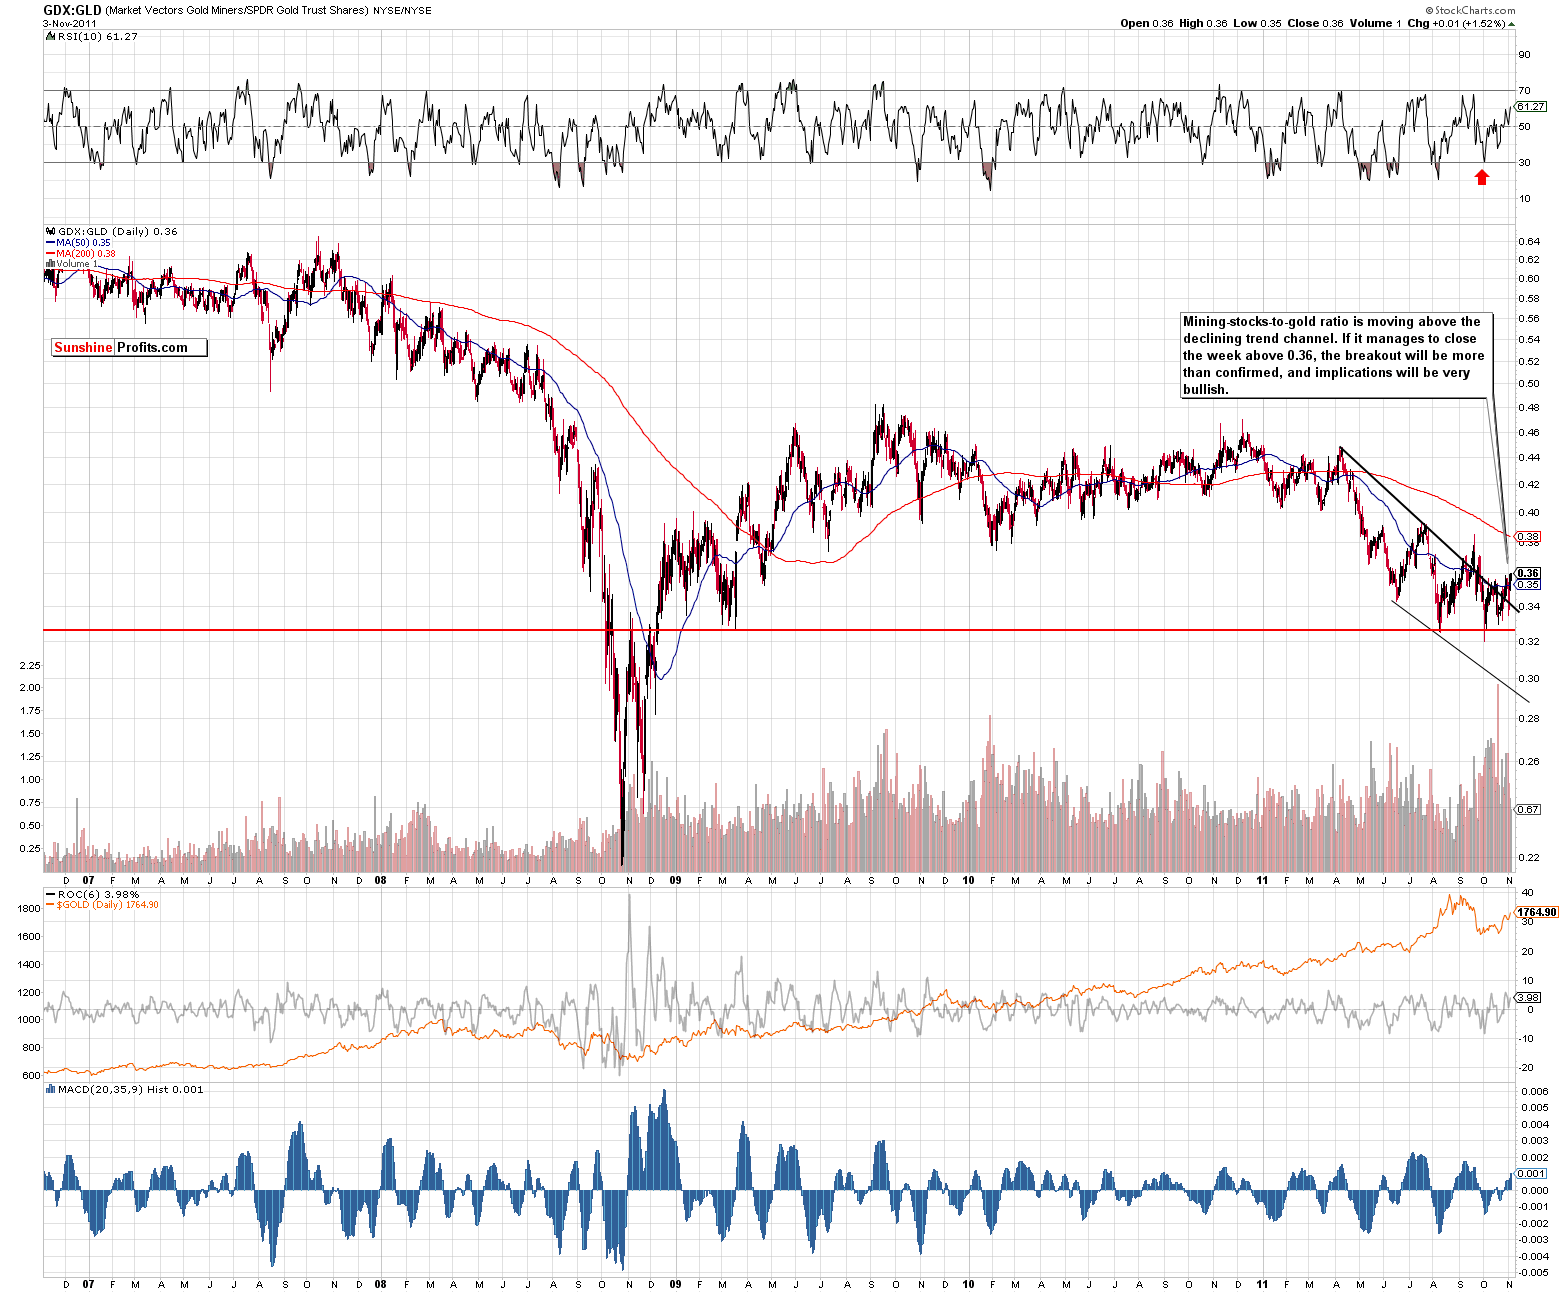
In the GDX GLD ratio chart (please click the above chart to enlarge), we see that the ratio has moved above the declining trend channel. This was mentioned as a likely possibility in last week’s Premium Update:
A more profound rally could be forthcoming if a confirmed breakout above the declining trend channel takes place. Once the top is reached in the precious metals sector, and after we see a period of consolidation, a breakthrough in this ratio could be viewed as a beginning of a powerful rally.
This move has just taken place although it has not yet been confirmed. If the ratio closes on Friday above the support line, the odds are likely that the rally will continue for perhaps a few weeks. A move to the level of previous highs or even above it is clearly possible. Overall the signal from this chart is bullish for the whole precious metals sector.
Summing up, the gold and silver mining stocks appear poised to move higher across the board. The situation is bullish and the previous highs appear to be the likely target (640 for the HUI Index and $67 for the GDX ETF)
Juniors
As stated in the Key Principles section, the list of top juniors will be updated approximately every 4 weeks, so this is the Update that should contain the revised version of the list. However, before moving on to the rankings, let’s take a look at the whole sector.
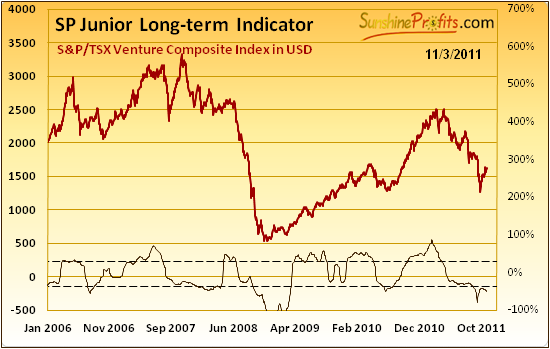
Over a month ago (September 27th Market Alert), based on i.a. our SP Long-term Junior Indicator that had flashed a buy signal we suggested moving back to the junior sector, and so far it appears to have been a profitable move.
As a reminder, the above indicator flashes a buy signal when it moves below the lower dashed line and starts to rise and it flashes a sell signal when the indicator is above the upper dashed line and starts to decline. In this case, we've seen the former and it the outlook for juniors is bullish.
The situation in the long-term interest rates, stock market (note that juniors are highly positively correlated with main stock indices stocks) and the rest of the precious metals market is positive as well.
Since it's a good time to be in the junior sector, let's move to our top junior rankings (reminder: we usually post them every first Friday of the month).
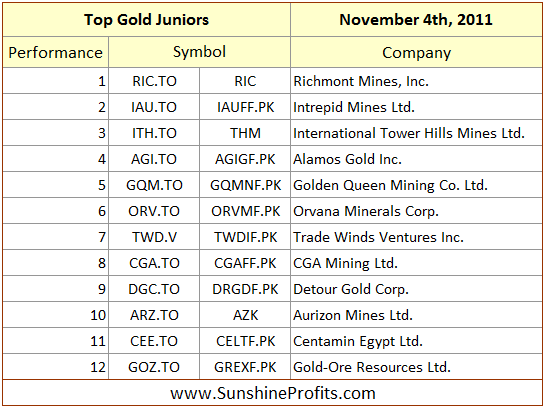
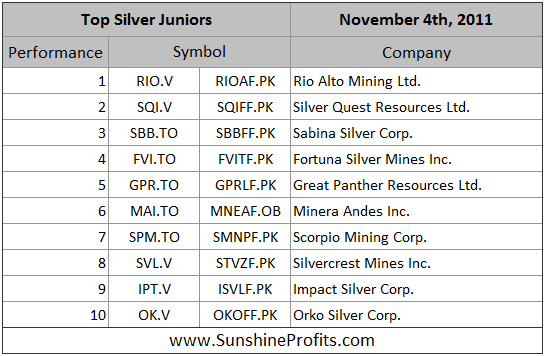
Summing up, there are no changes as far as our silver junior selection is concerned and there is one regarding its golden equivalent. Namely, we decided to substitute the San Gold Corporation with Gold-Ore Resources Ltd.
Letters from Subscribers
Q: I was wondering why you look at gold priced in Japanese yen? Since gold is priced in London why not look at it in GBP? Are the signals from the Gold:GBP chart the same as those from the Gold:YEN chart?
A: Before replying to this particular question, we would like to remind one of the previous replies that we provided on a similar topic.
One of the questions we received recently was about buying gold priced in USD vs. buying gold priced in other currencies. Subscriber asked what currency it is best to buy gold with. The short answer is that generally, it does not matter much as far as profit and currency risk exposure are concerned. For example, if you live in Great Britain and have British pounds and you want to buy gold, you need to either use your pounds to purchase the gold, or convert your pounds into another currency (USD for instance), which you would then use to purchase the gold.
The bottom line is that you are not holding dollars or pounds - you are holding gold. When you decide to sell your gold, you will either get GBP, or USD which you would then need to convert back into pounds for use in your daily life. The only difference is that if you use USD for the purchase you will need to buy it and then sell it, paying currency conversion fees for both transactions. If the price of gold in USD goes up because the dollar moved down, you would have a gain in the USD, but soon after you convert your dollars into pounds you would not see this tremendous gain. This is just an example. We believe that in the long run gold is likely to move up against all currencies.
Here is another example:
Gold in Euro moves up 100% from 1,000 to 2,000.
Dollar goes up against Euro from 0.7 to 0.9 (meaning that 1 dollar used to buy 0.7 Euro and now it buys 0.9 Euro).
What impact would this have on gold priced in dollars?
At the beginning, gold traded at $1,429 (1000 / 0.7) and now it trades at $2,222 (2000 / 0.9), which means that it increased by about 56%
So - we have an increase in the value of gold in both USD and EUR, which means that gold increased its value against the U.S. dollar while the euro decreased its value against the U.S. dollar.
Of course, the numbers above are hypothetical, and everything depends on the sizes of the respective rallies/declines. But this example clearly shows that a decrease in the value of the euro (against the dollar) does not need to translate into a lower price for gold.
At the moment, it is not surprising to see European investors purchasing gold in response to their economic problems. Some investors are willing to purchase dollars as a safe-haven, which we found ironic when we first commented on it several months ago. We still find it ironic, bordering on foolish. On the other hand, some savvy Europeans will be willing to purchase gold and silver.
Moving back to the original question - from the purely technical perspective, signals coming from GOLD:GBP and GOLD:YEN charts are somewhat similar but different. However, GOLD:GBP is very similar to the GOLD:UDN ratio that we feature on a weekly basis, so we take into account the GPB factor as well.
Now, since the GOLD:YEN chart is significantly different from the GOLD:UDN ratio, we can see confirmation/invalidation either in the USD picture, or in GOLD:UDN.
The GOLD:GBP chart would not provide a significant confirmation/invalidation of the GOLD:UDN ratio, simply because it's so similar to it. We would be double-counting the factors.
We realize this may be difficult to visualize without looking at the charts, so it might be a good idea to move back to the Gold section of this update and compare gold charts to the gold:UDN ratio.
Q: While I often agree with your analysis on world affairs, I do not agree that things are so simple here. The fact is that Lehman was allowed to fail. Sometimes things that seem irrational are what indeed take place. Unlike most of the world today, Greece has a left that has power and historical significance. Politicians often act in ways that appear foolish by international standards but are quite sane by local political merit.
A: Thank you for your comments and for sending your thoughts on this matter. In our opinion the positive outcome (accepting help) is still the most probable one.
While it is certainly true that Lehman was allowed to fail, we doubt that would have been the case if that particular failure threatened to cause the whole country to fall apart into separate states (the odds for the EU falling apart will be considerably higher if Greece goes bankrupt).
Q: Greece is holding 111.5 tons of gold, as per the latest estimates. Despite being the sickest and the most bankrupt economy, Greece has decided not to sell any gold. Perhaps the only way out is an ultimatum: tell Greece enough is enough and refuse to pay any further funds to them. The Greek government could & should pay off their debt in full. German and American taxpayers are bailing out Greece & letting them keep their gold. We should demand Greece turn over their gold and pay their debt or else go in and take it ourselves.
A: In the Sep 16th, 2011 Premium Update we wrote the following:
In addition, it is unlikely that the heavily indebted European counties will sell their gold reserves because their reserves are merely a pittance when compared to their mountain of debt - at least at today's prices.
Greece's 111.5 tons of gold are worth approximately $6 billion at today's prices. That's less than 2% of Greece's public debt.
They are not selling their gold because that wouldn't change much, and if the country ends up having even greater financial turmoil, it might really need that gold.
If Greece refuses to pay its bills, then it will effectively mean bankruptcy with all its consequences, not only for Greece (no more outside financing at reasonable interest rates, possibly more violent strikes and riots), but for the whole EU and many other countries that export to the EU. That is not a "solution," that's a bad outcome. Will that happen soon? Not likely, as the EU still has means of help and it knows very well how much is at stake.
Naturally, that's just our opinion and we could be wrong, but that's the way we see it.
Q: Looks like diamond prices could drop after this. Will diamond investors switch to gold? Wall Street Journal: “Zimbabwe Applauds Lifting of Diamond-Sales Ban”
A: Yes, diamond prices could be affected negatively to the extent that the market was not anticipating this decision. Since the supply of diamonds will increase, their prices could fall, and since the diamond market is sometimes associated with the precious metals market (jewelry demand), some investors might prefer to switch from diamonds to precious metals.
Summary
Despite the early week contra-trend moves, the euro is likely to move higher and the dollar lower. The general stock market appears ready to continue its recent rally and the implications from all these factors are bullish overall for the precious metals.
Based on an analysis of the precious metals sector alone, we believe that higher prices are likely even though many of our previously stated target levels are soon to be reached. Early week corrections that took metals and stocks lower and the dollar higher appear to be over.
This means that the correction that we have been anticipating previously might already be over and gold with mining stocks is ready to move to their previous highs. The metals appear ready to break out above their target levels, which means gold surpassing $1,780 (perhaps to $1,900) and silver moving above $36 (perhaps to the $40 level). The HUI Index seems headed for 640. A bullish outlook appears to be in place for the entire precious metals sector at this time.
As a reminder, we continue to favor juniors over the senior precious metals producers.
Should we change our views on any of the precious-metals-related details (like targets) before the next update is posted, we will notify you immediately via Market Alerts.
Our next Premium Update will be posted on Thursday, November 10, 2011 (one day ahead of the normal schedule).
This completes this week's Premium Update.
Thank you for using the Premium Service. Have a great weekend and profitable week!
Przemyslaw Radomski

