
The yellow metal, money for more than three millennia, has a close relationship to other forms of money. Some argue that it isn't gold that has risen in value in the last decade, as much that fiat currencies have lost value against gold. Ever since gold began its spectacular rise a decade ago, the U.S. dollar has lost over 80% of its purchasing power. The other currencies have not fared much better. The euro and the Japanese yen have lost over 70%. Gold is the only form of money that governments cannot create out of thin air which is why the supply of fiat currencies is expanding exponentially faster than gold supplies, which increase by about only 3% per year.
We like to pay close attention to currencies and to the multi-front currency war because of the effect on gold.
In the “currency war,” neutrality does not pay as Switzerland discovered when it recently had to set a floor rate at 1.20 franc per euro by selling francs. The Swiss currency had gained because it was considered a safe haven. Now that the luster of the franc has dimmed somewhat, gold is more attractive than ever as a choice for wealth preservation.
The latest battle in this currency war is heating up between the U.S. and China and a trade war between the two most important economies in the world is certainly a cause for worry. For much of the past two years China has been under pressure from the US to allow the yuan to appreciate. For its part, China has accused the U.S. of lowering the value of the dollar by printing so much of it. Others suggest that both China and the US are “winning” the currency war by holding down their currencies while pushing up the value of the Euro, Yen and currencies of some emerging economies.
How did it all begin?
It was on September 27 last year that Brazilian Finance Minister Guido Mantega announced that the world is in the midst of an international currency war as nations race to devalue their currencies in hopes of exporting their way out of trouble. The problem began earlier as a logical consequence of the financial meltdown of 2008. We started off with international savings imbalance that led to excessively low interest rates. With such low interest rates people were tempted to buy homes, especially when the banks offered great subprime deals to people that normally would not qualify. All this home buying created the real estate bubble where it seemed that prices would keep going up forever.
Then in 2008 the subprime implosion prompted government rescue packages and the 24/7 running the money printing presses. The resulting explosion of sovereign debt put governments in the bind between two evils. Run a budget austerity program with sever cutbacks on public expenditure and risk deflation, or print more money and cause inflation via the devaluation of the currency.
There are only three ways to reduce public debt.
- Budget austerity which, in theory, is supposed to enable the government to eventually run a surplus and pay down the debt.
- Monetization where the government takes advantage of the unique right of the central bank to print money. The government then can borrow this fiat money freshly printed by its own central bank to finance public spending. The danger here is the specter of inflation.
- Default is where a government swamped by debt repudiates or reschedules its debt. There has been much talk that it's only a question of time when Greece will have to go this route.
We live in a different world now. If until 2007 exchange rates developed in a conventional economic environment in which high yield currencies appreciated, since 2008 the game has changed. Now it's a race to devalue the currency.
For a widespread currency war to take place several significant world economies must wish to devalue their currencies at the same time. This can take place in times when the world is suffering through a recession, as it is now.
Just like gold, US dollars have value only to the extent that they are strictly limited in supply. Imagine that one could, through alchemy, produce gold in unlimited quantities. The price would plunge immediately. The same will be true in the long run for fiat currencies. You can't flood the market with a supply of more and more dollars without the value of those dollars declining (monetarists would argue and discuss the impact of the population growth rate, but that is a different matter).
This is not the first time that the dollar has been devaluated through manipulation. Franklin D. Roosevelt did it in 1933-34. Here is what Ben Bernanke, a good student of economic history, said in remarks he made before the National Economists Club in 2002.
Although a policy of intervening to affect the exchange value of the dollar is nowhere on the horizon today, it's worth noting that there have been times when exchange rate policy has been an effective weapon against deflation. A striking example from U.S. history is Franklin Roosevelt's 40 percent devaluation of the dollar against gold in 1933-34, enforced by a program of gold purchases and domestic money creation. The devaluation and the rapid increase in money supply it permitted ended the U.S. deflation remarkably quickly. Indeed, consumer price inflation in the United States, year on year, went from -10.3 percent in 1932 to -5.1 percent in 1933 to 3.4 percent in 1934.17 The economy grew strongly, and by the way, 1934 was one of the best years of the century for the stock market. If nothing else, the episode illustrates that monetary actions can have powerful effects on the economy, even when the nominal interest rate is at or near zero, as was the case at the time of Roosevelt's devaluation.
With interest rates hovering near the zero level central banks have only one tool in their box to combat slowing growth. Yes, currency creation, which inevitably will lead to inflation. Printing money is such an attractive solution for governments because it spurs growth by exports since goods are now cheaper for countries whose currencies are stronger. Inflation is imported and the debt burden is reduced.
China and Japan have bet massively on exports to drive growth and to help achieve that goal they weaken their currency. It is estimated that the Chinese yuan is about 40% undervalued against the dollar. Although the currency has been allowed to rise 7 percent against the dollar since June of 2010, in late August the rise slowed to a virtual halt. China is returning to its old strategy to support its exports amid a faltering global economy.
Americans are mad as hell and are not going to take it. The Senate last week voted for the Currency Exchange Rate Oversight Reform Act of 2011, which would allow the US to punish any country that manipulates its currency with special duties and import tariffs. China is not mentioned specifically, but it doesn’t take a genius to figure it out. The bill still has to pass the House. It is not likely that such a bill will persuade Beijing to change its ways and the more likely response from China would be some form of trade policy retaliation.
A best-selling book right now in China is titled “Currency Wars” with more than 2 million copies sold. The book pushes towards an isolationist financial policy.
The bottom line is that as these currency wars develop and the world's economic situation does not improve, capital will flow into safe havens. The Swiss franc is too expensive and in a currency war it becomes difficult to position oneself correctly in the forex market. As far as we're concerned the best bet is the one currency that cannot be printed hand over fist—precious metals.
The World Gold Council this week released a research study that seems rather obvious. An allocation to gold within a portfolio that includes alternative assets such as private equity, hedge funds, real estate and commodities, can preserve capital and reduce risk without diminishing long-term returns, according to the report. In short, there is no substitute for the protection that precious metals can offer.
To see how gold will fare in the near future let's turn to this week's technical part with the analysis of the long-term US Treasury interest rates. We will start with the long-term chart (charts courtesy by http://stockcharts.com.)
Long-term US Treasury Interest Rates
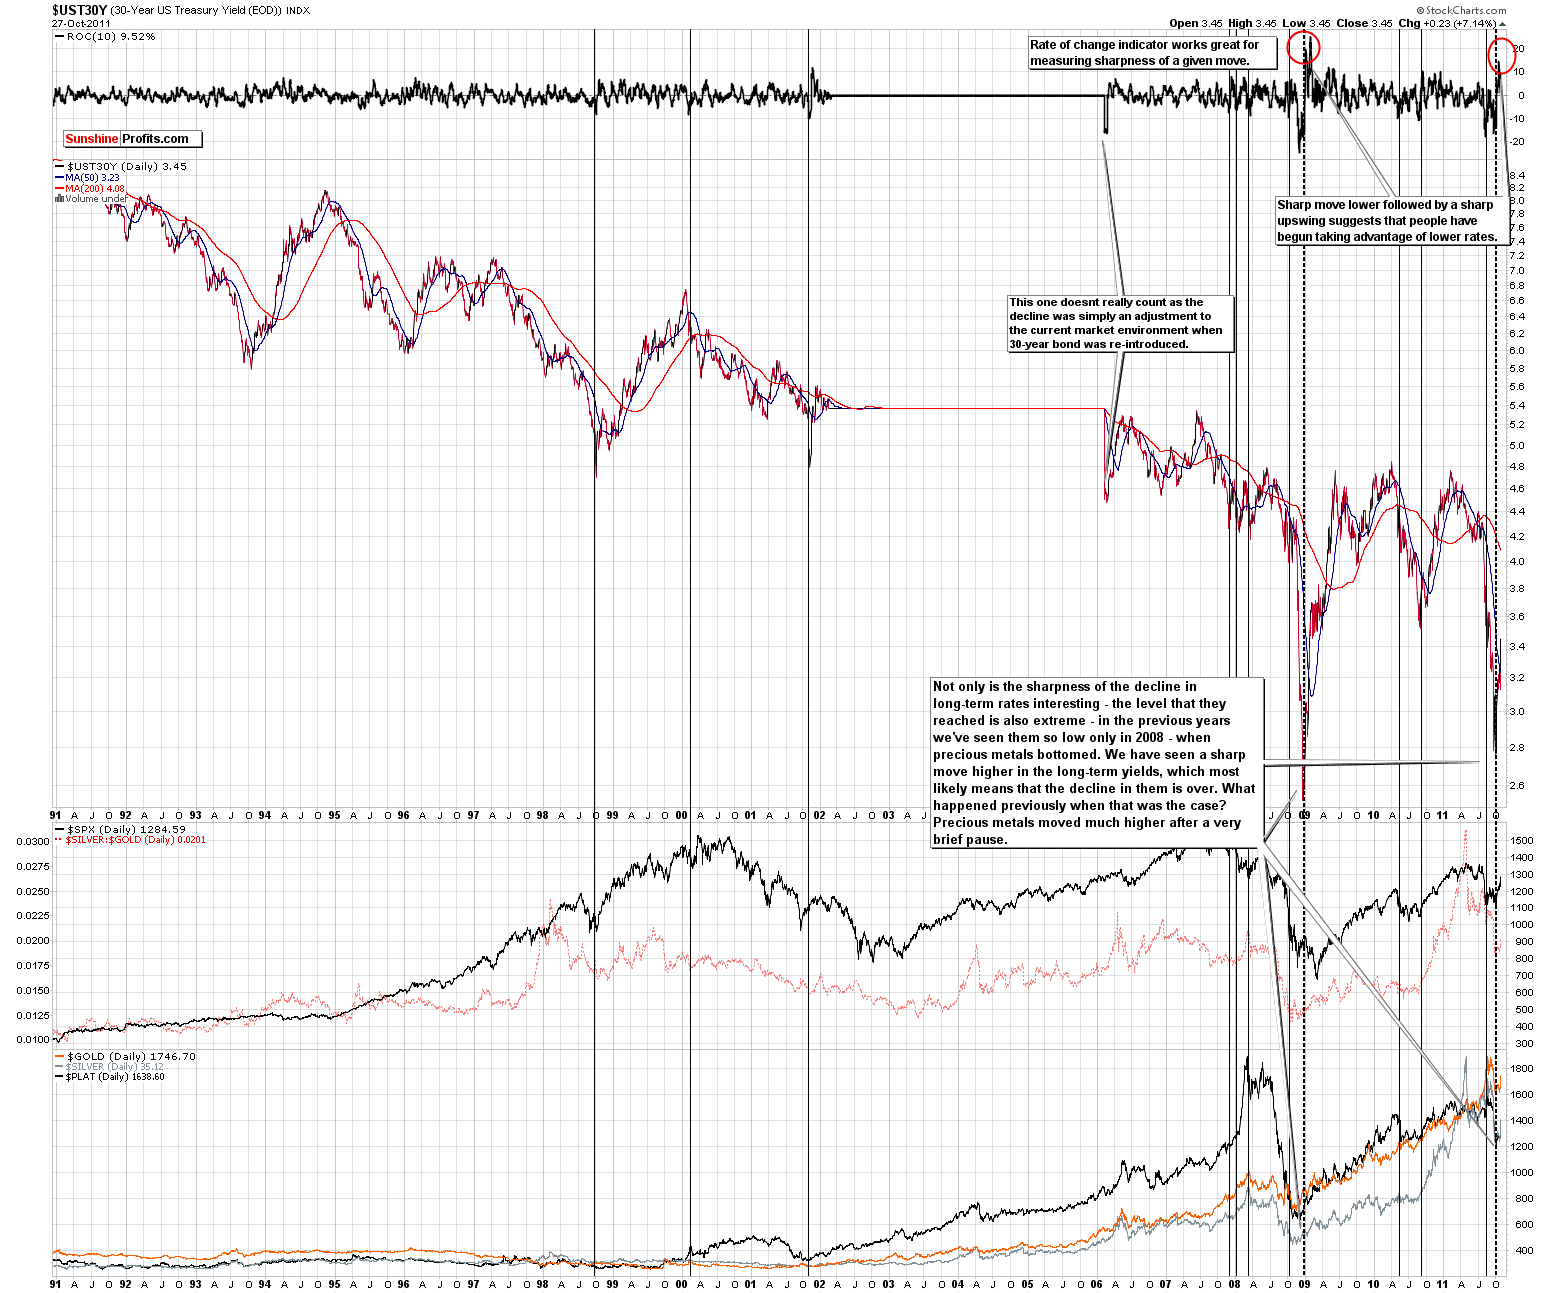
Once again, we begin with the 30-year US Treasury long-term interest rates chart (please click on the chart to enlarge it) since it is instrumental in putting everything which follows into proper perspective. We have been including this chart pretty regularly in recent weeks since it is truly influencing most, if not all of the markets covered in later sections of our Premium Update. There are no changes on this chart since last week – we decided to include as it helps to focus on the big picture and the medium-term trends.
Back then we wrote the following:
There was only a minimal change in rates this week but the rate-of-change (ROC) Indicator did move higher because rates held their previous gains and makes our current situation more closely resemble what was seen in 2008.
This was the only time where long-term rates declined as severely and then bounced sharply. The precious metals markets rallied soon thereafter. It is possible that we will see this again and any surprise move by the precious metals markets is likely to be to the upside not the downside. At that time, it clearly appears that betting on lower prices is quite risky as opposed to an apparent much safer bet on higher prices.
Euro – USD Indices
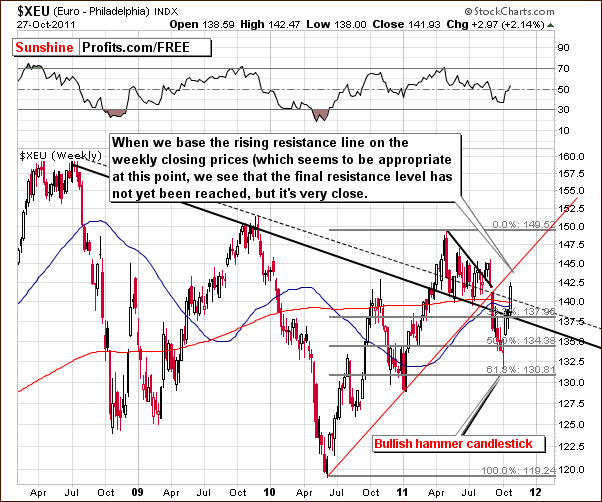
In the long-term Euro Index chart which is based on weekly closing prices, we have seen a powerful rally this week. Index levels have moved above the declining resistance line and are approaching the final resistance line, which is based on previous local bottoms and is in the 143-144 range.
This index level close to last year's high and once it is reached, a pause is likely. This will probably be seen regardless of what develops in the meantime to determine the likely move thereafter. The short-term rally seen in the past few weeks is likely to pause when the resistance line is reached and what happens after that is not clear at this point.
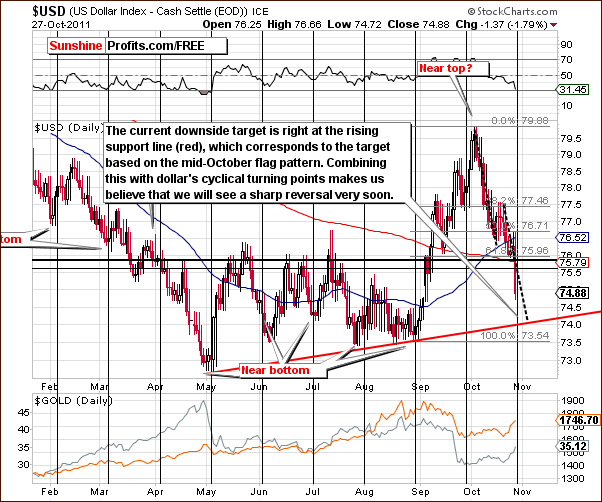
A likely USD Index downside target level appears to be close to 74, and this is precisely at the medium-term support line based on several bottoms. For this alone reason, the index is unlikely to move below 74, at least on its first attempt, especially due to the rapidness if the recent decline. Still, there are more reasons to believe that this support level will hold.
As we have mentioned previously, when the flag pattern is in play (meaning that price moves out of the formation and completes it), one can expect the move following it to be similar to the one that preceded it. The recent mid-October intra-day price swings can be viewed as a flag pattern. This provides us with 74 (again) as a target level – please take a look at the declining dashed black lines on the above chart for details.
Lastly, the index is approaching a cyclical turning point and a reversal is therefore likely. The RSI level close to 30, it will likely flash a buy signal very soon. This has coincided with local bottoms in the past, and after a bottom close to 74 a rally to the 76 level or so (not too precise at this point) then appears likely.
Summing up, the immediate-term outlook is bearish for the dollar and bullish for the euro. A reversal soon after additional price moves is likely.
General Stock Market
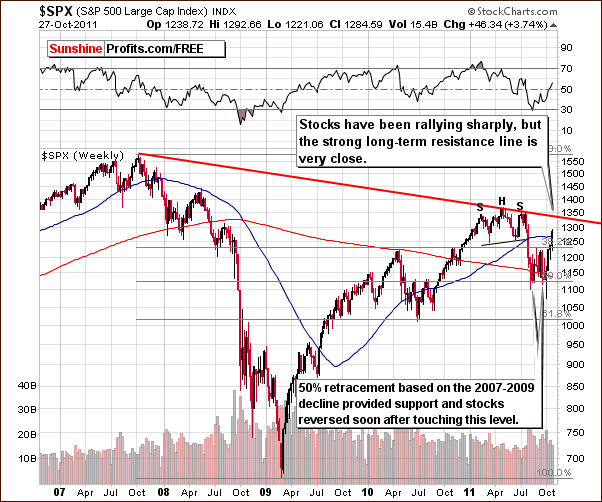
In the long-term S&P 500 Index chart, we see that the 50% Fibonacci retracement level recently provided support and stocks have moved higher since reaching this level. A very strong resistance line based on 2007 and 2011 tops will be in play very soon however. This will likely cause at least a pause in the current rally and the present upside target level for the S&P 500 Index is between 1330 and 1340.
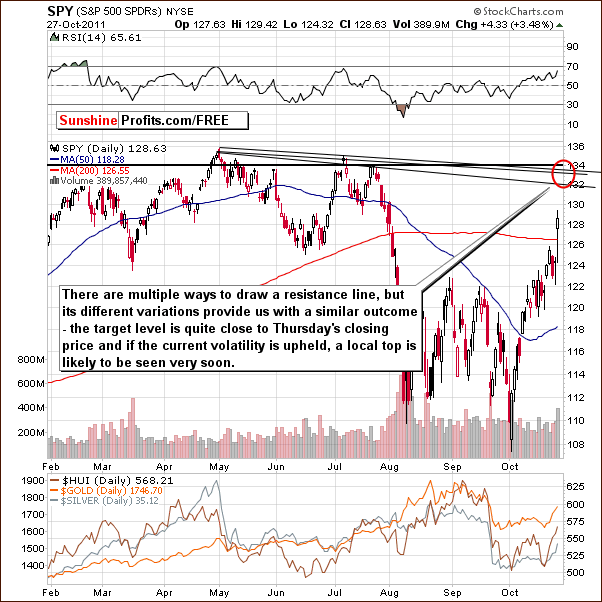
In the short-term SPY ETF, the recent price action has been very bullish. After declining, prices moved back up quickly on significant volume suggesting that there is buying power out there. It appears likely that higher prices will be seen in the near term and then a strong (combined with the long-term one) resistance line will come into play. If Thursday's performance is duplicated Friday or Monday, the target level will likely be reached and a local top will likely be seen. The general trend however is still to the upside partly influenced by the long-term interest rate situation.
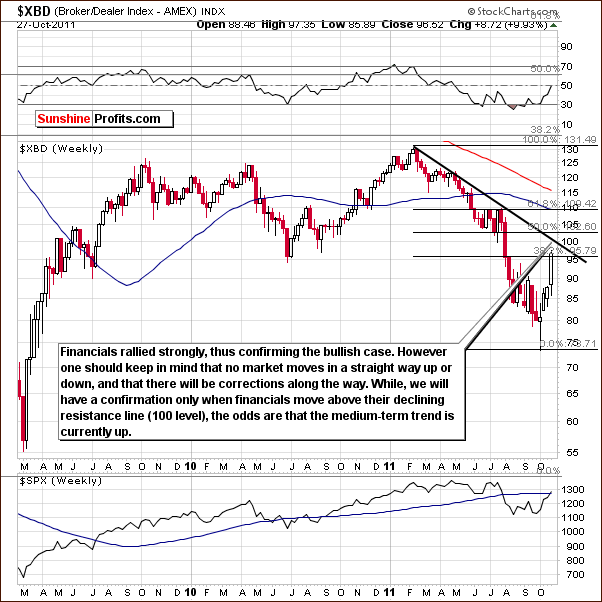
In the Broker Dealer Index (proxy for the financial sector) chart, strong price action was seen on Thursday, but the index is not above its declining resistance line yet. The trend of the rebound suggests higher index levels are likely but there is an important resistance line slightly above current levels. A pause in the rally and period of consolidation are therefore likely to be seen soon. A subsequent move to the upside would then be possible.
Summing up, the general stock market has rallied significantly of late and a pullback will probably be seen when the nearby strong resistance line is reached (1330 – 1340 for the S&P 500 Index). This resistance line is based on two major tops. Other short-term factors support the case for a pause in the rally. This is also confirmed by the financials' sector.
Correlation Matrix
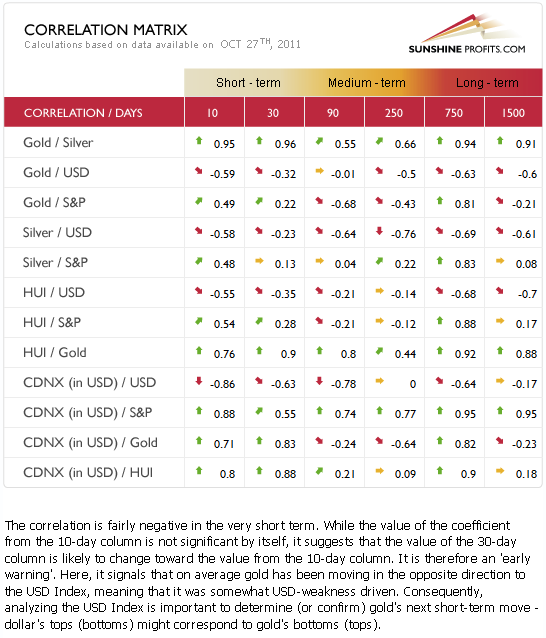
In this week's Correlation Matrix, we see rather mild signals.
The short-term, 30-day column values are quite weak at this time as no relationship is apparent. The 10-day column however shows more of a tendency which suggests that the general stock market and the dollar are more likely to confirm the bullish scenario for metals in the immediate term with a bearish outlook soon thereafter more likely than not.
As complicated as it sounds, the bottom line is that the currencies and stock market provide us with an influence that is not too strong, and without other factors suggesting the same it would not be too meaningful. The overall indications are bullish for the immediate term, but a consolidation in the precious metal sector appears likely in the not too distant future. The important thing is that this is also what we can infer based on the analysis of the following charts.
Gold
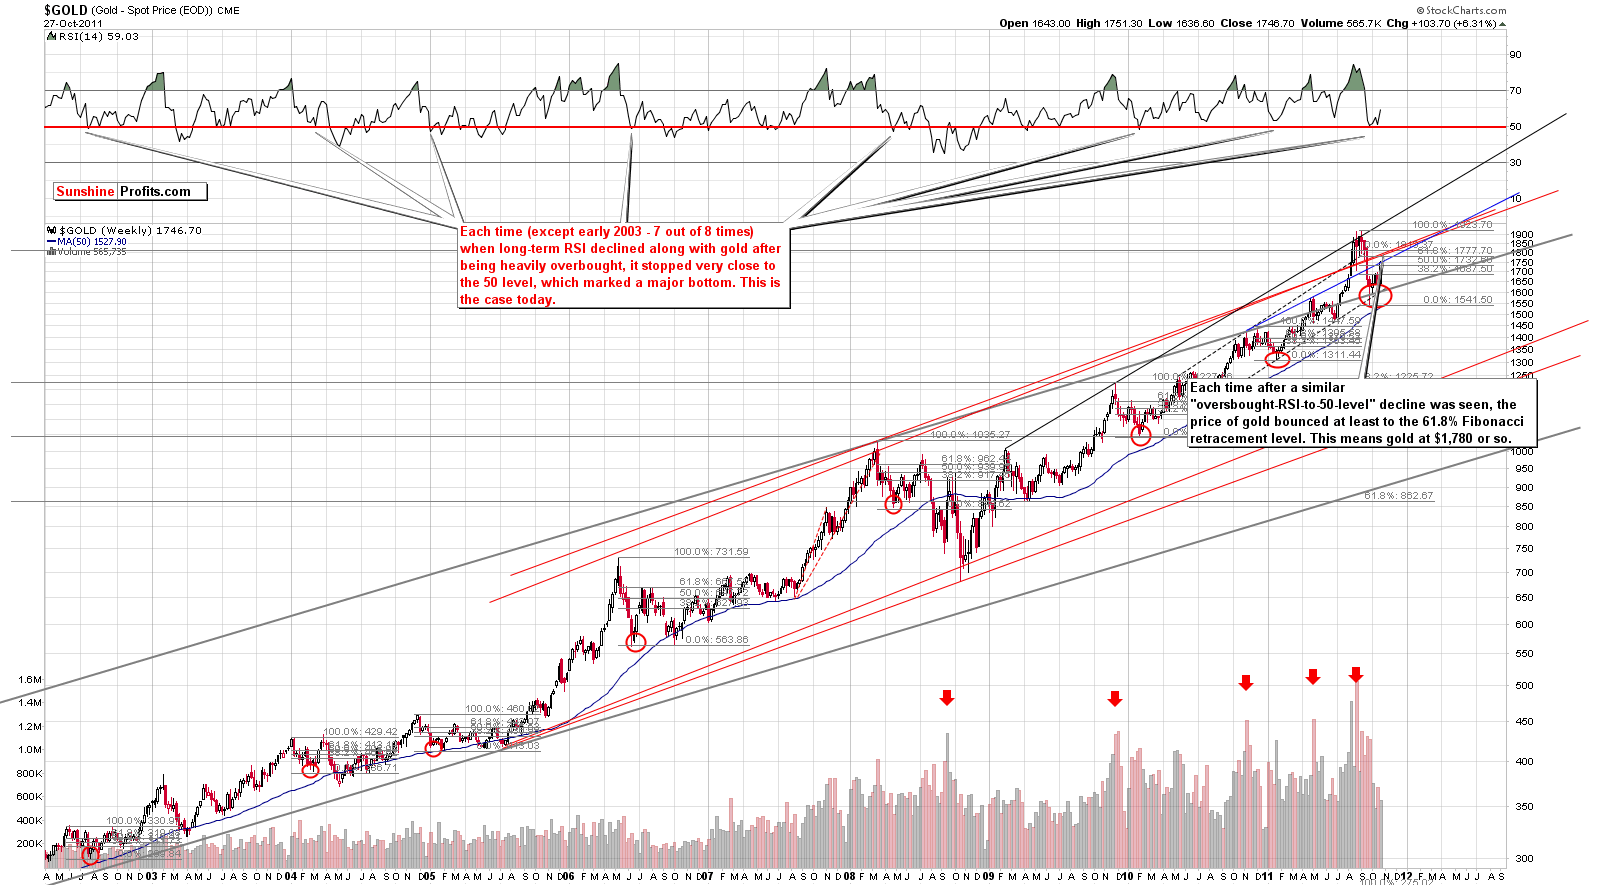
We begin our gold section once again with a look at the very long-term chart (please click the above chart to enlarge). Gold rallied sharply this week as it moved toward our previously discussed target level. As we stated in last week's Premium Update, "A likely upside target level for gold at this time still appears to be $1,780." Thursday's closing price was a bit more than $30 below this target - at $1,746. One more day of significant rally could bring gold to this target level and closing speculative long positions is therefore something that you should be preparing for at this time.
The $1,780 level is important because it coincides with the 61.8% Fibonacci retracement level and the upper border of the long-term trading channel. Prices are likely move back a bit once this target level is reached. Still, we don't see gold moving below $1,680 anytime soon.
Two weeks ago we wrote the following:
The average performance of gold after an above-mentioned bottom in the RSI is historically very strong. Every time over the past 8 years, gold's price has rebounded to at least the 61.8% Fibonacci retracement level (…. This is about $100 higher than Thursday's closing price level, so the upside potential here is significant. (…) In each case, the rebound in gold's price was very similar to the shape of the decline seen before the bottom. If this holds once again, the recent very sharp decline which is similar to one in 2006 could be followed by a very quick upswing to the 61.8% Fibonacci retracement level [$1,780] or higher.
The above quote is still up-to-date and thus the rally does not appear to be completely over, but close to a local top.
Let's take a look at gold from the non-USD perspective for additional medium-term details.
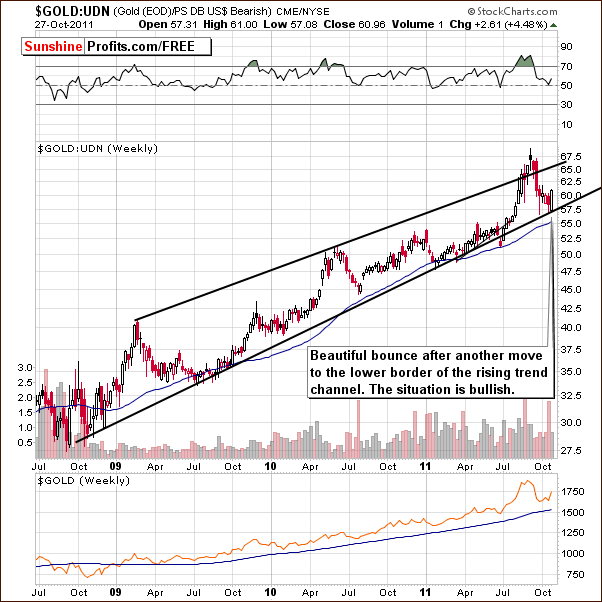
In this week's long-term chart for gold from a non-USD perspective, we see that the index levels bounced immediately after reaching the lower border of the rising trend channel. The uptrend is still in place and a short-term correction would likely not invalidate it. The medium-term and long-term sentiment both appear to be bullish today.
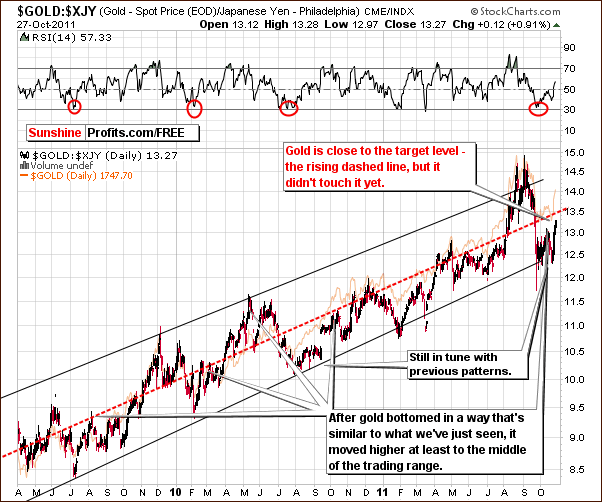
Looking at gold from the Japanese yen perspective, we see a confirmation of the signals in our two previous charts. The trend here is up as the breakdown has been invalidated. The index is approaching the middle of the trading range and this has frequently corresponded to a local top after which time a short breather is quite probable before a move to higher index levels.
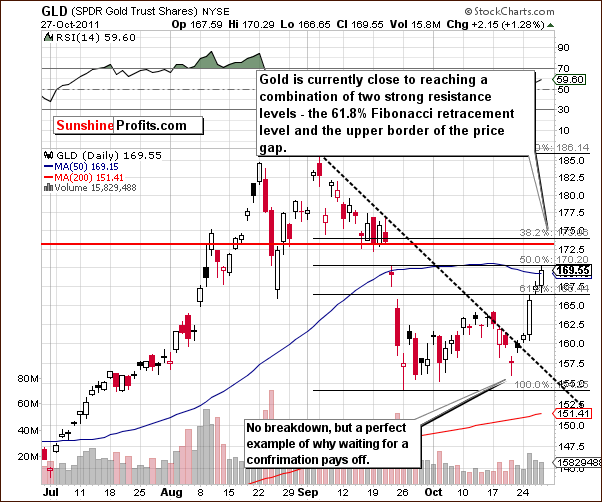
In the short-term GLD ETF chart this week, price levels are approaching two short-term resistance lines. One is the 61.8% Fibonacci retracement level and the other is the upper border of the price gap which was seen last month. This price gap was roughly between $170 and $173, and, actually, the $173 level has provided support and resistance in the past. We are likely to see a pause in the current rally once these levels are reached.
Summing up, once the $1,780 target is reached, a short-term consolidation appears likely and gold's price could move back to $1,700 or even $1,680. This appears to be the maximum downside target area.
In fact, gold could then trade sideways somewhere between $1,680 and $1,780, which could create a bullish cup-and-handle pattern that started in mid-September. After that, another strong rally would begin. Naturally, that's just a speculation at this point, but it does appear to be the most likely outcome from here.
Silver
The main point that comes to mind when looking at this chart (please click the above chart to enlarge) is that the recent price decline was profound. Consequently, we look to previous large declines in order to determine how far the current price rebound is likely to go. In doing so, we see a picture that is coherent with general implications, although specific details are somewhat blurred.
The $36 target level appears reasonable although the rally may not end there. Either way a local top is probable within the next few days or so. In 2006, a few significant, quick declines were followed by sharp rallies to price levels even higher than those which preceded the declines. This is something that we may see right now, or we may see a bit longer consolidation (for a few weeks) before silver moves sharply higher once again.
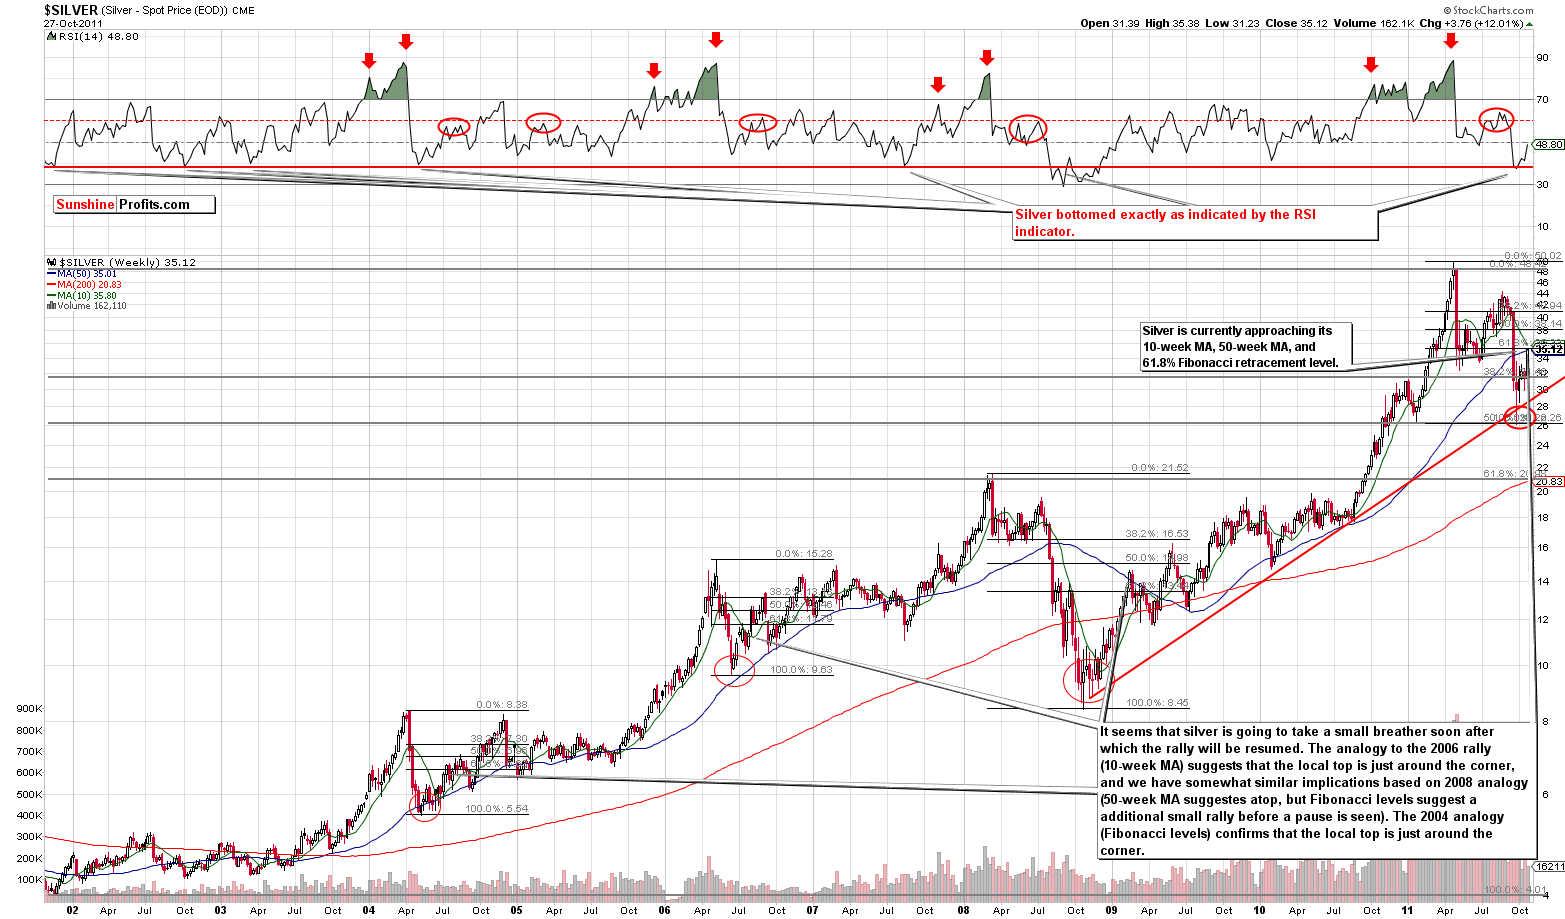
Based on this week's long term chart for silver, we arrive at the same conclusions. We see a price action this week similar to that of gold. There are different factors involved here, however, as silver is approaching its 10-week and 50-week moving averages as well as the 61.8 Fibonacci retracement level it seems that a local top will be formed rather sooner than later, perhaps within the next few days.
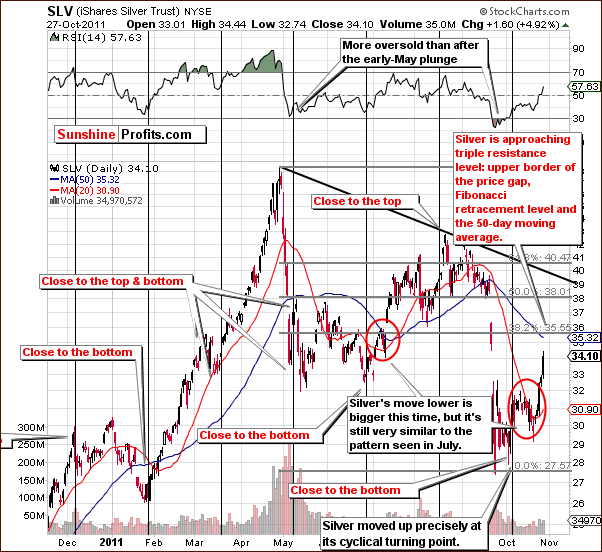
In the short-term SLV ETF chart this week, we see that the recent rally has brought price levels close to three resistance lines. The upper border of the price gap, the 50-day moving average and the 38.2% Fibonacci retracement level are all slightly above Thursday's closing price level. Once this resistance level is reached, a consolidation period is likely to be seen. How low can silver go once this level is reached? Perhaps as low as $33 ($32 in case of the SLV ETF) or even lower.
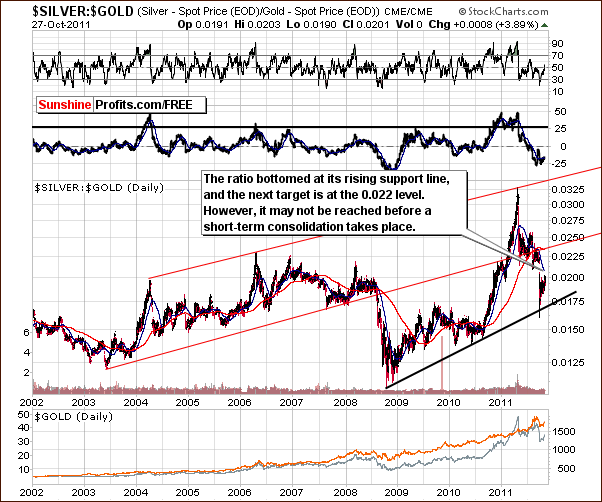
In the long-term silver to gold ratio chart, we see that the ratio bottomed at its rising support line. The target level of 0.022 is still valid but may not be reached immediately. A local top could be seen first with the target level likely being reached a few weeks later.
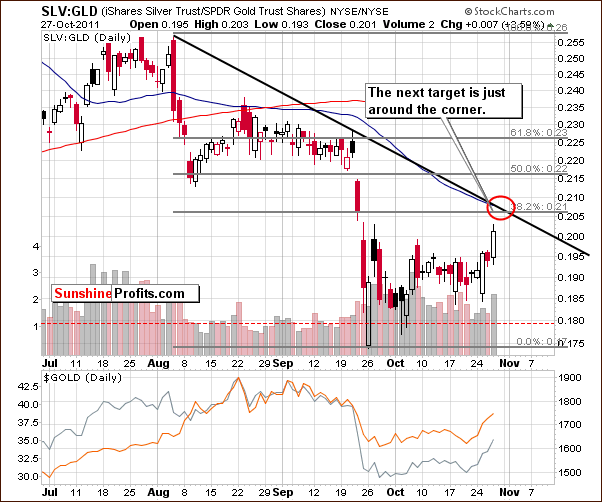
As we can see on the short term silver to gold (precisely, SLV:GLD) ratio chart, the ratio is quickly moving higher. The question at this time is how far can it go? The tops in this ratio frequently correspond to the tops in the underlying metals' prices (note the 2011 top in both: silver and long-term silver-gold ratio charts) and with silver approaching three resistance levels, a top in the ratio would serve as a confirmation of the local top in the metals.
Actually, the situation in the ratio is very similar to what we've seen in gold and silver. The 38.2% Fibonacci retracement level and a short-term declining resistance line coincide just a little above where the ratio closed on Thursday. So, the top-is-near theory appears to be well confirmed.
Summing up, silver is approaching a local top and the silver to gold ratio appears to be topping as well. The $36 target level appears reasonable, however silver may move even higher before the top is reached. Other markets should be watched closely, especially gold ($1,780) and the USD Index (74), to determine the exit point for speculative long positions in silver.
Gold and Silver Mining Stocks
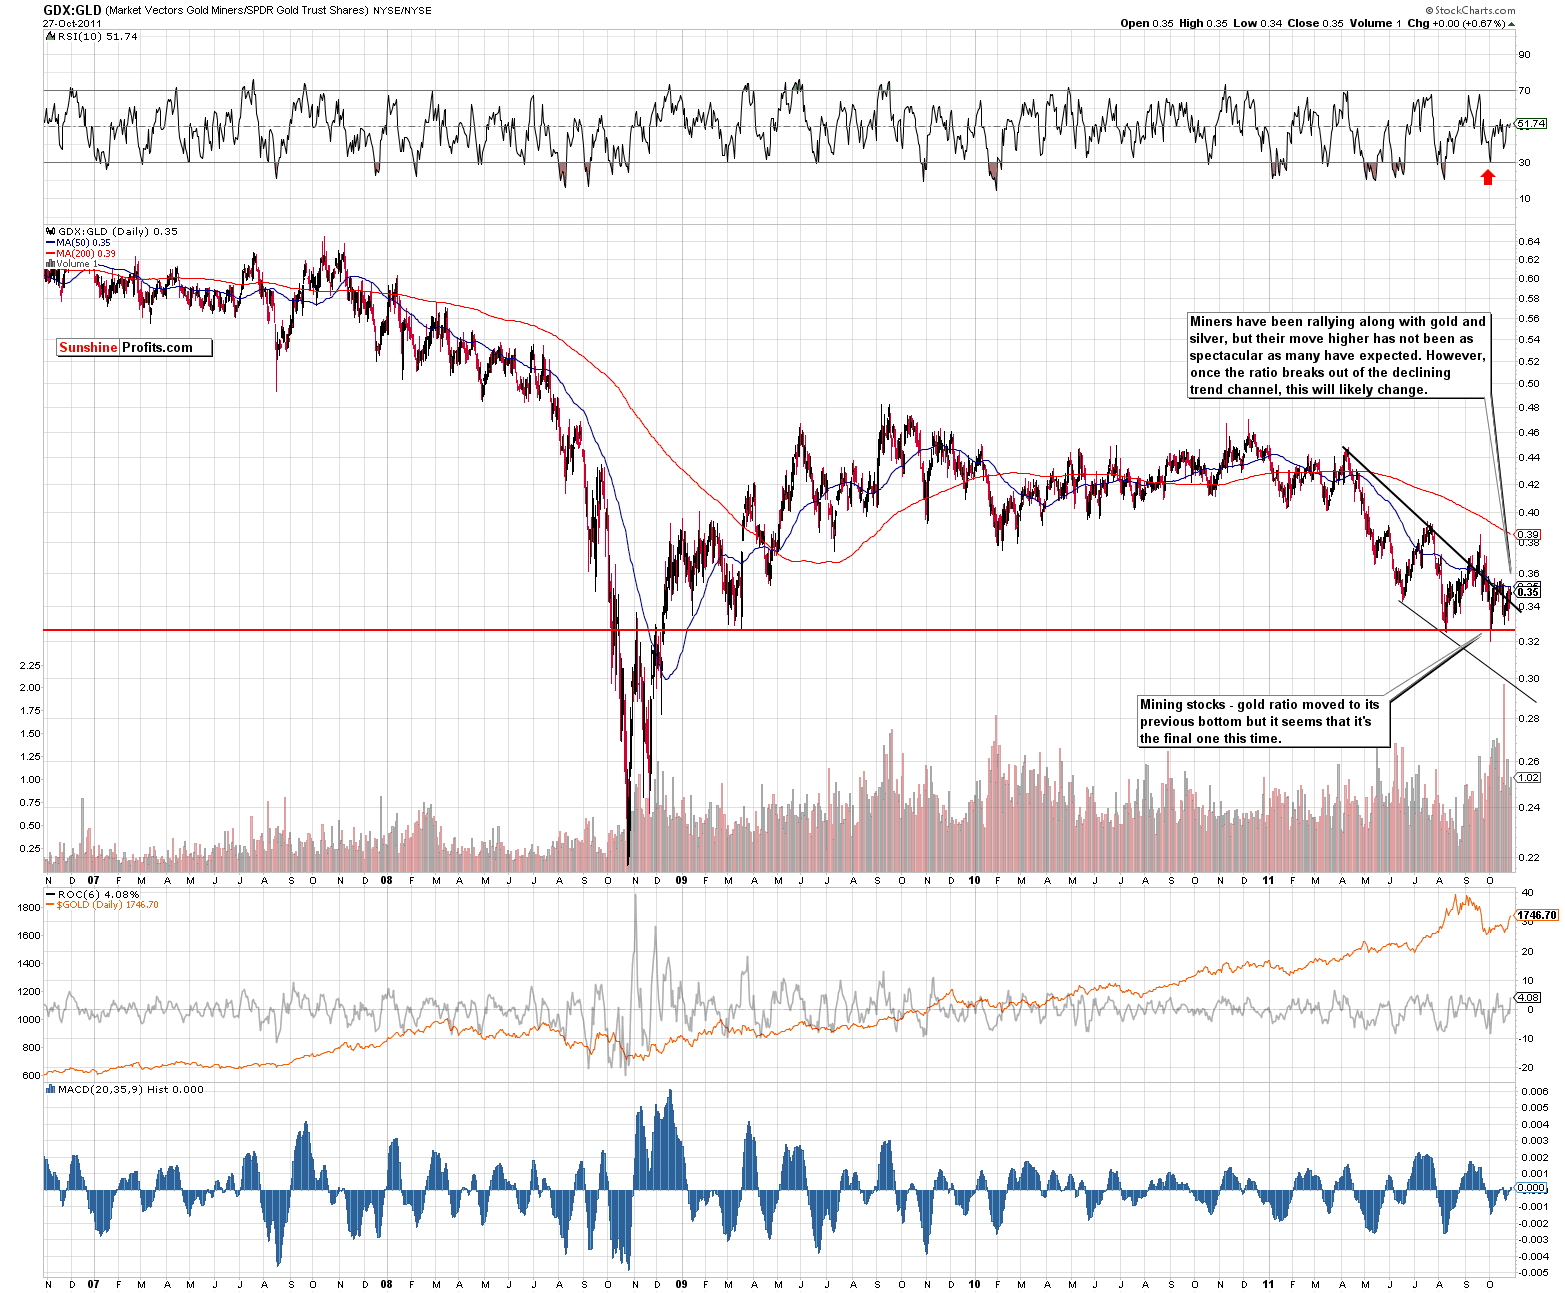
In the GDX:GLD ratio chart, we can see how mining stocks have performed against the yellow metal. At this time, we still see the ratio in a downtrend, as the mining stocks have performed rather weakly in light of the rallies seen for gold and silver.
Although, the mining stocks have rallied a bit, it has not been nearly as spectacular as many had expected. A more profound rally could be forthcoming if a confirmed breakout above the declining trend channel takes place. Once the top is reached in the precious metals sector, and after we see a period of consolidation, a breakthrough in this ratio could be viewed as a beginning of a powerful rally.
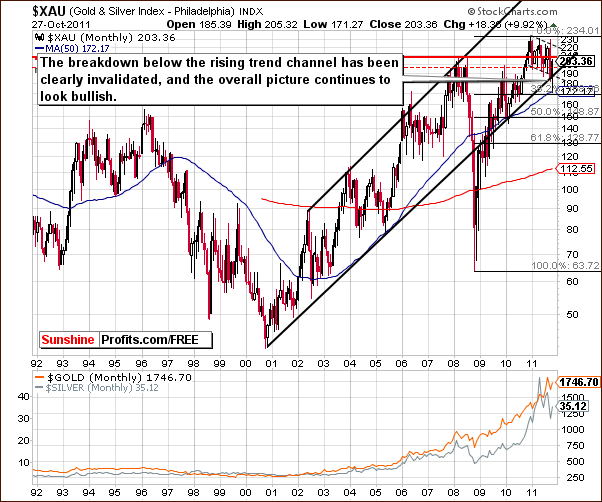
In this week's very long-term XAU gold and silver miners' index chart, the breakdown has clearly been invalidated and the outlook here remains bullish. The gold and silver mining stocks appear to be poised for what could be a significant rally in the coming weeks. This chart does not tell us whether a short-term consolidation is likely before that or not – however the chart does.
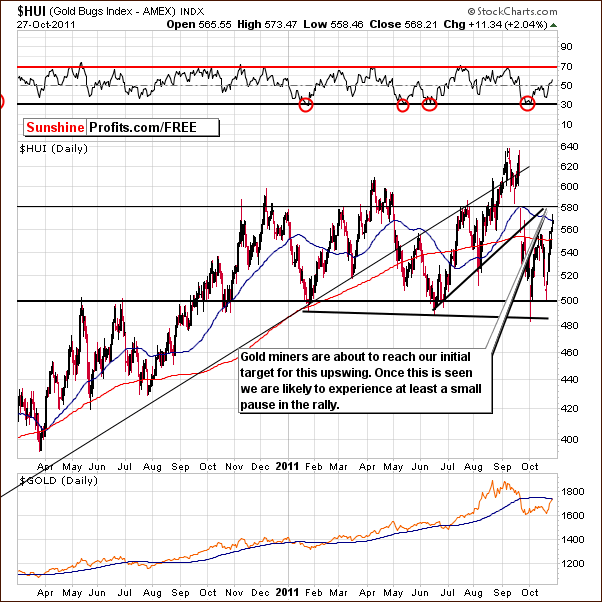
In this week's long-term HUI Index chart, we see the index level approaching the 580 target level which we have mentioned in previous updates. The rally will likely pause soon after this target level is reached. After the move to 580-590, a reversal to at least the 550 level (200-day moving average) is quite likely.
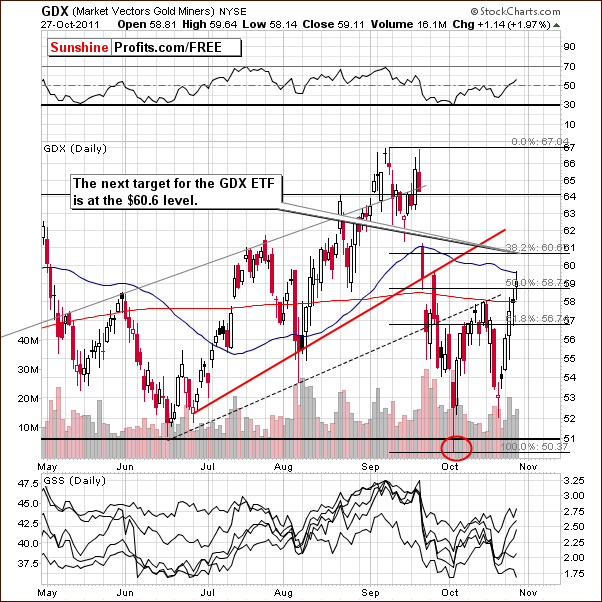
In this week’s short-term GDX ETF chart, the $60.6 target level is nearly at hand with Thursday's closing price level above $59. This target level coincides with the 38.2% Fibonacci retracement level and a move above this target level appears unlikely at the first attempt.
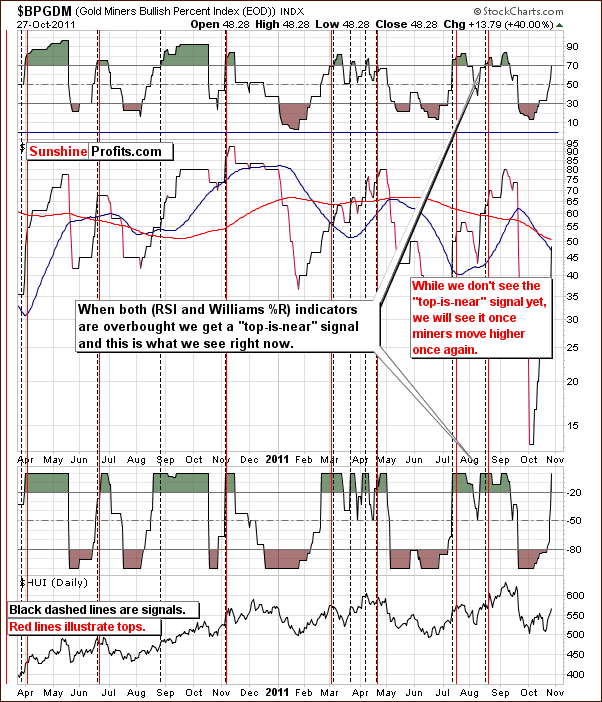
In the Gold Miners Bullish Percent Index chart, we look for signals that the “top is near”. This has been a very reliable indicator in the past if the RSI level and William %R are both overbought. This is not the case at this time yet, but if the gold miners move higher, both indicators will likely do the same and the overbought status will then be obtained. Closing speculative long positions should then be strongly considered.
Summing up, as we saw with gold and silver, the gold and silver mining stocks appear to be ending the first part of their rally. A local top is quite possible within the next few days to be followed by a period of consolidation.
Letters from Subscribers
Q: Current prices for gold equities exhibit a low correlation with the price of gold. With the bull market in gold and historically low interest rates, it benefits these companies to sit on their reserves. This increases their book value, but because investors and equity analysts focus primarily on shorter-term earnings, their stock prices may be lower as a result. Do you expect gold miner equity prices to languish for a long time, underperforming other industry groups?
A: We had a similar question from one of our subscribers some time ago. Here's what we replied back then:
As we explained previously there are reasons for miners' underperformance even without taking the manipulation theory into account. Each stock's share prices are ultimately driven by a company's earnings power. In other words, the more sustainable net income a company generates per share, the bigger the price of this share. Profits are not only driven by revenues but also by costs. If costs rise, then profits may not rise even with an increase in revenue.
In the case of mining stocks we need to consider not only the price of metal that a given company produces, but also the company's costs. Since a big share of the company's costs is related to the price of crude oil (the most versatile commodity), we need to take into account oil prices. With oil around $100 and expectations of higher prices investors discount this and project lower profits. Thus, the share price does not increase as one would expect based on the gold price alone.
The point about miners' earnings and their link to stock prices is indeed interesting. Here's our take:
1. We'd say that in the mining business earnings don't get as much attention as in most sectors. Naturally, they are very important, but in the mining business, the company's properties are just as important. There are (were?) even some analysts that focus almost solely on the price / ounces-in-the-ground ratio, which is close to the P/B (price to book value) ratio. Therefore, even with lower earnings, a company might still be viewed as attractive because of what it owns and what can ultimately be extracted at a sizable profit.
Take SSRI (4th and 5th questions from the top). This company was one of the most popular silver miners (and a high-performing one too) for many years before they started producing silver.
2. Assuming that earnings and their quality are the key factors behind the stock price valuation, we should take into account all future earnings, not just the current ones or the ones that will likely be seen in a year or two. While simple P/E (price to earnings) analysis is popular among individual investors, we think that institutional players and those with a lot on their broker accounts will prefer to use FCFF valuation or a similar cash flow discounting method. In the current low interest rate environment, the weights for future cash flows will not be much different than the weights for present cash flows. This, in turn, means that moving cash flows through time will not severely damage a company's valuation even if these cash flows don't change based on higher gold/silver prices in the coming years. In other words, with low interest rates people will not care much about having their company's earnings in a few years instead of right now. Even if the company takes a loan to cover their expenses in the meantime, this will not cost very much as the interest on the loan will be very low. Naturally, by "not caring much" I don't mean that it will not lower the valuation - it will, but to a small degree.
Now, this is under the assumption that cash flows don't change. Since we are in a bull market in precious metals (and this belief is certainly shared among those who decide whether to invest in gold stocks instead of gold or vice-versa), we should on average expect the revenue from gold/silver sales to increase over time. So, if (1) cash flow will be greater as a company waits to sell their metals, and (2) simultaneously, time will not destroy the value of this cash flow to any considerable degree (again - low rates), then we could expect that when a miner decides to wait to sell their assets (and thus temporarily reduce their earnings), it should in fact increase the value of the mining company for those who believe in the bull market in precious metals.
Of course, the above is not a complete analysis, because we didn't mention costs that are also likely to rise (rising fuel prices, high inflation making workers demand higher wages, and so on) along with the prices for precious metals. However, writing a detailed fundamental analysis of the sector was not our point here. Our point was that a company's decision to pause their production may not only not have a negative impact on its price, but it may actually have a positive one.
Summary
It seems that the underlying moves in the USD Index, the general stock market, gold, silver and the gold and silver mining stocks are likely to pause soon. This could actually be seen as soon as on Friday or Monday. The USD Index is likely to reach a bottom around the 74 level with the S&P 500 moving to a local top in the 1330 to 1340 range. Gold is most likely to move to the $1,780 level before ending its current run and reversing.
The situation for silver and the miners is less clear at this time. The $36 target level for silver and the 580 level for the HUI Index appear to be the most logical upside targets today. It seems best to watch gold, the dollar, and the general stock market for exact timing on these reversals. If the USD Index moves to 74 but gold has only risen to, say, $1,765, it still appears that it would be appropriate to close speculative long positions. We do not plan at this time to close any of our long-term investment positions based on this outlook, and we think that only speculative positions should be closed and (profits taken off the table) when these targets are reached.
It does not seem best for most traders to consider short positions at this time, since the main trend is clearly up. The resulting moves to the downside may not be all that significant and we do not recommend opening short positions when the abovementioned targets are reached unless you engage in day-trading.
[EDITED when HUI moved above 580, but gold is at $1,744: mining stocks are likely to move even higher and waiting for gold to move close to the $1,780 target appears to be the best approach at the moment]We will continue to monitor these situations and, as always, keep you informed as the situation develops further.
Our next Premium Update is scheduled for Friday, November 4, 2011.
This completes this week's Premium Update.
Thank you for using the Premium Service. Have a great weekend and profitable week!
Przemyslaw Radomski

