
Whenever gold prices rise or decline the headlines give a flavor-of-the-week reason—the dollar is up, the dollar is down, the eurozone is in trouble, it's the latest jobs report, etc. There is no doubt that global economic conditions are inter-related and that a “butterfly flapping its wings” in one part of the world can effect gold prices. This week was no exception. This week's decline was partly explained by news out of China. The Chinese economy, the second largest in the world, expanded by only 9.1 per cent in the third quarter, down from 9.5 per cent in the second quarter and 9.7 per cent in the first three months of the year. This is a growth rate that all countries on the planet would give their eye teeth to find in their fortune cookie. But for China it was the slowest growth since 2009. This prompted fears that the world's economic engine will slow down eating into demand for exporting countries.
Just to give you an idea of the numbers we are talking about—the Chinese growth rate compares with just 1.3 percent growth in the United States and 0.2 percent growth in the 17-country euro zone during the second quarter.
China's slowed growth is a result of China's government struggle to rein in high inflation by tightening credit markets, raising interest rates five times since last October and imposing higher reserve requirements on many of the nation's banks. So far they have had little success with inflation and consumer prices still zoom at the rate of China's new high-speed trains. (Come to think of it, didn't one of those trains crash recently killing 40 people? The crash has come to symbolize much that's wrong with China's warp-speed, lack-of-attention-to-safety-and environment development.) In September prices increased 6.1 percent annually, compared with just 3.6 percent a year earlier.
Can China rein in its high inflation? This is an important question for gold investors. China's high inflation will inevitably be exported to other counties along with the higher priced Chinese consumer goods. Gold is a classic hedge against inflation and Chinese emerging middle class knows this well.
Can China do it? It will be difficult at best. Although China may understate its inflation statistics, it is clear that inflation is inevitable. Recall that Chinese companies raised worker wages after a spate of worker suicides. In addition, real estate prices are up 13% in the past year. Everything that China manufactures will become more expensive in dollar terms and that is how you import inflation. There are other emerging markets with significant inflation, including Russia with 6%, Brazil with 5.4% and India with 14.5%, to name a few. The commodities and manufactured good in these countries will become more expensive in US dollar terms. This is bringing inflation to developed countries through the back door, via the emerging market ones.
A recent International Monetary Fund report estimates that China exports more inflation to the region than is previously assumed. For every 1 percentage increase in Chinese inflation, the increase in Asia-Pacific countries is 0.25-0.5 percent. The report argues that the real danger for regional inflation is an up-tick in Chinese output driving commodity prices up. It notes that a 1 percent increase in Chinese output can raise global commodity price inflation by about 5 percent and that the Asian-Pacific region is especially vulnerable to commodity price increases since food and energy compose a sizable proportion of average daily spending.
China's strategy to build up an enormous export-led growth engine has been to use low wages and to keep its currency cheap. Experts estimate that the Chinese yuan is 40% undervalued, making Chinese products artificially cheap. China has also used its huge market to lure Western companies to transfer their next-generation technology to China. Goods are as much “copied in China” as “made in China.” Many Chinese realize that it is time to change that template but that will be difficult as long as China's entire system stifles creativity by putting emphasis on rote learning rather than innovation.
The U.S. Senate last week voted for the Currency Exchange Rate Oversight Reform Act of 2011, which would allow the US to punish any country that manipulates its currency with special duties and import tariffs. The bill is targeted at China, even though it doesn't mention any country specifically. It is unlikely that the bill will pass the House. Even if it does, it is not likely that such a bill will persuade Beijing to change and it could ignite a trade war. It has already provoked a strong response from China. Beijing describes it as trade protectionism, condemning the bill as a serious violation of World Trade Organization rules and a “ticking time-bomb” that could ignite a trade war.
America has to get used to the idea that it will never get those labor intensive assembly jobs back. The differences in wage are too large, regardless of what China does with the yuan.
Keep in mind that China is the world's largest holder of American debt. Or, as Late night talk show host, David Letterman, said recently: "Two things you need to know about taxes. They've extended the deadline to April 18, and when you write your check, just make it out to China."
With everything that has happened with precious metals this week, let's not delay any longer and let's turn to this week's technical part with the analysis of the US Treasury interest rates. We will start with the long-term chart (charts courtesy by http://stockcharts.com.)
Long-term US Treasury Interest Rates
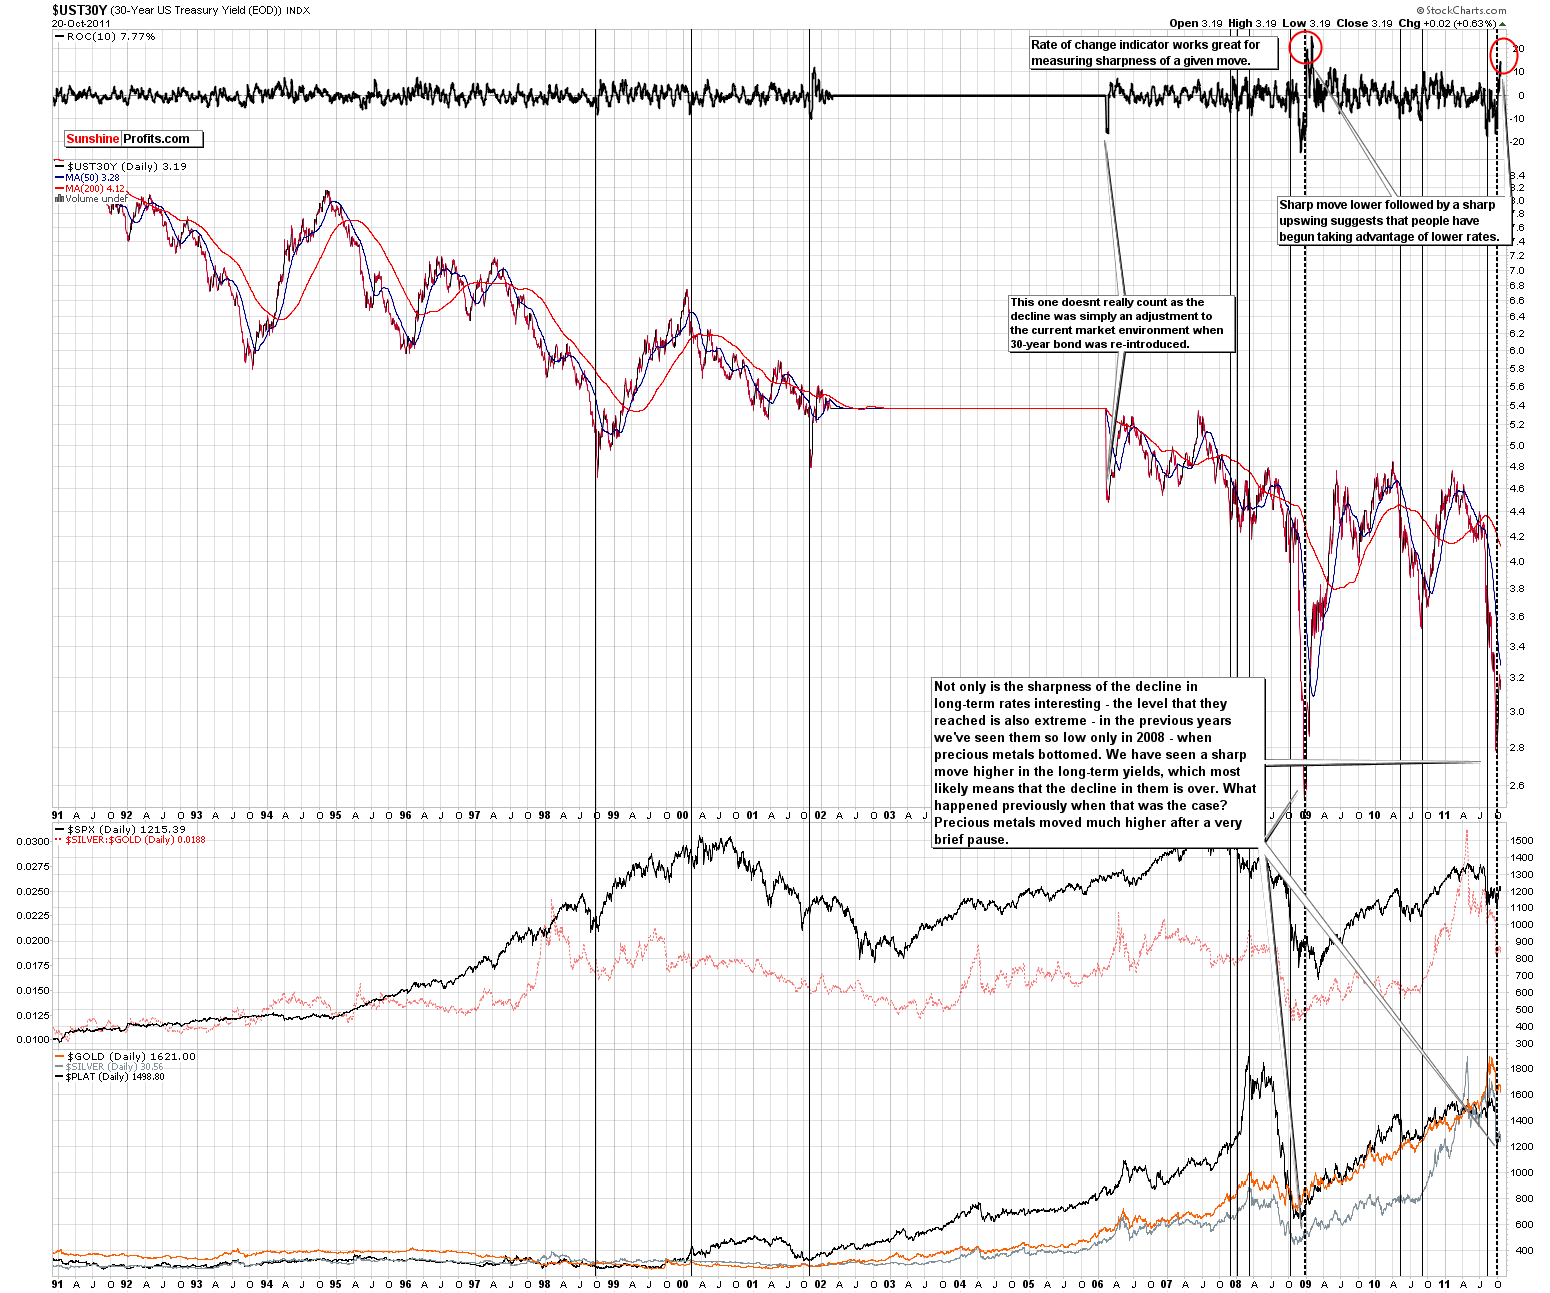
Once again, we begin with the 30-year US Treasury long-term interest rates chart (please click on the chart to enlarge it) which is instrumental in putting everything which follows into proper perspective. There was only a minimal change in rates this week but the rate-of-change (ROC) Indicator did move higher because rates held their previous gains and makes our current situation more closely resemble what was seen in 2008.
This was the only time where long-term rates declined as severely and then bounced sharply. The precious metals markets rallied soon thereafter. It is possible that we will see this again and any surprise move by the precious metals markets is likely to be to the upside not the downside. At this time, it clearly appears that betting on lower prices is quite risky as opposed to an apparent much safer bet on higher prices.
Euro – USD Indices
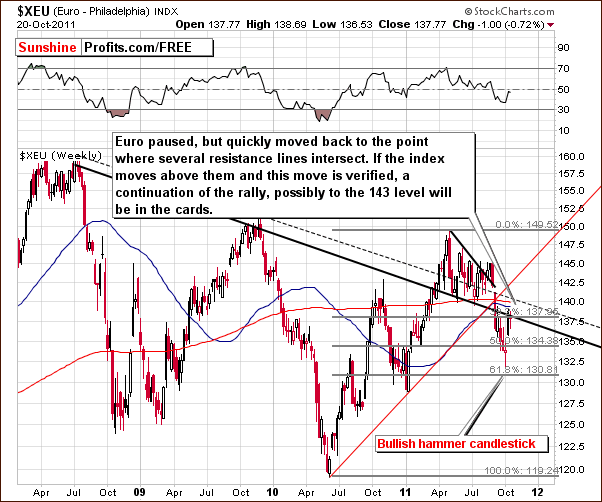
In this week's long-term Euro Index chart, we've seen the index level bounce off the resistance line, move down to the support level and then pull back up to resistance. Now it is at the declining long-term resistance line, which coincides with the 61.8% Fibonacci retracement level. These two helped to keep the index from further rally this week.
If the index manages to move above the resistance level and hold for three consecutive trading days, the breakout will likely lead to even higher index levels with the next target around 143. It's possible that the euro could rally even more. Clearly, the situation is currently tense. A decline from here would confirm the breakdown and a move higher would invalidate the breakdown. As is often the case, time will tell all and what eventually happens will be a key determining factor for the subsequent direction of the currency markets.
On a side note, please keep this chart in mind when you hear talk about technical analysis being no longer valid. The recent reversal after a bullish-hammer-candlestick-pattern coinciding precisely with the Fibonacci retracement level was no coincidence.
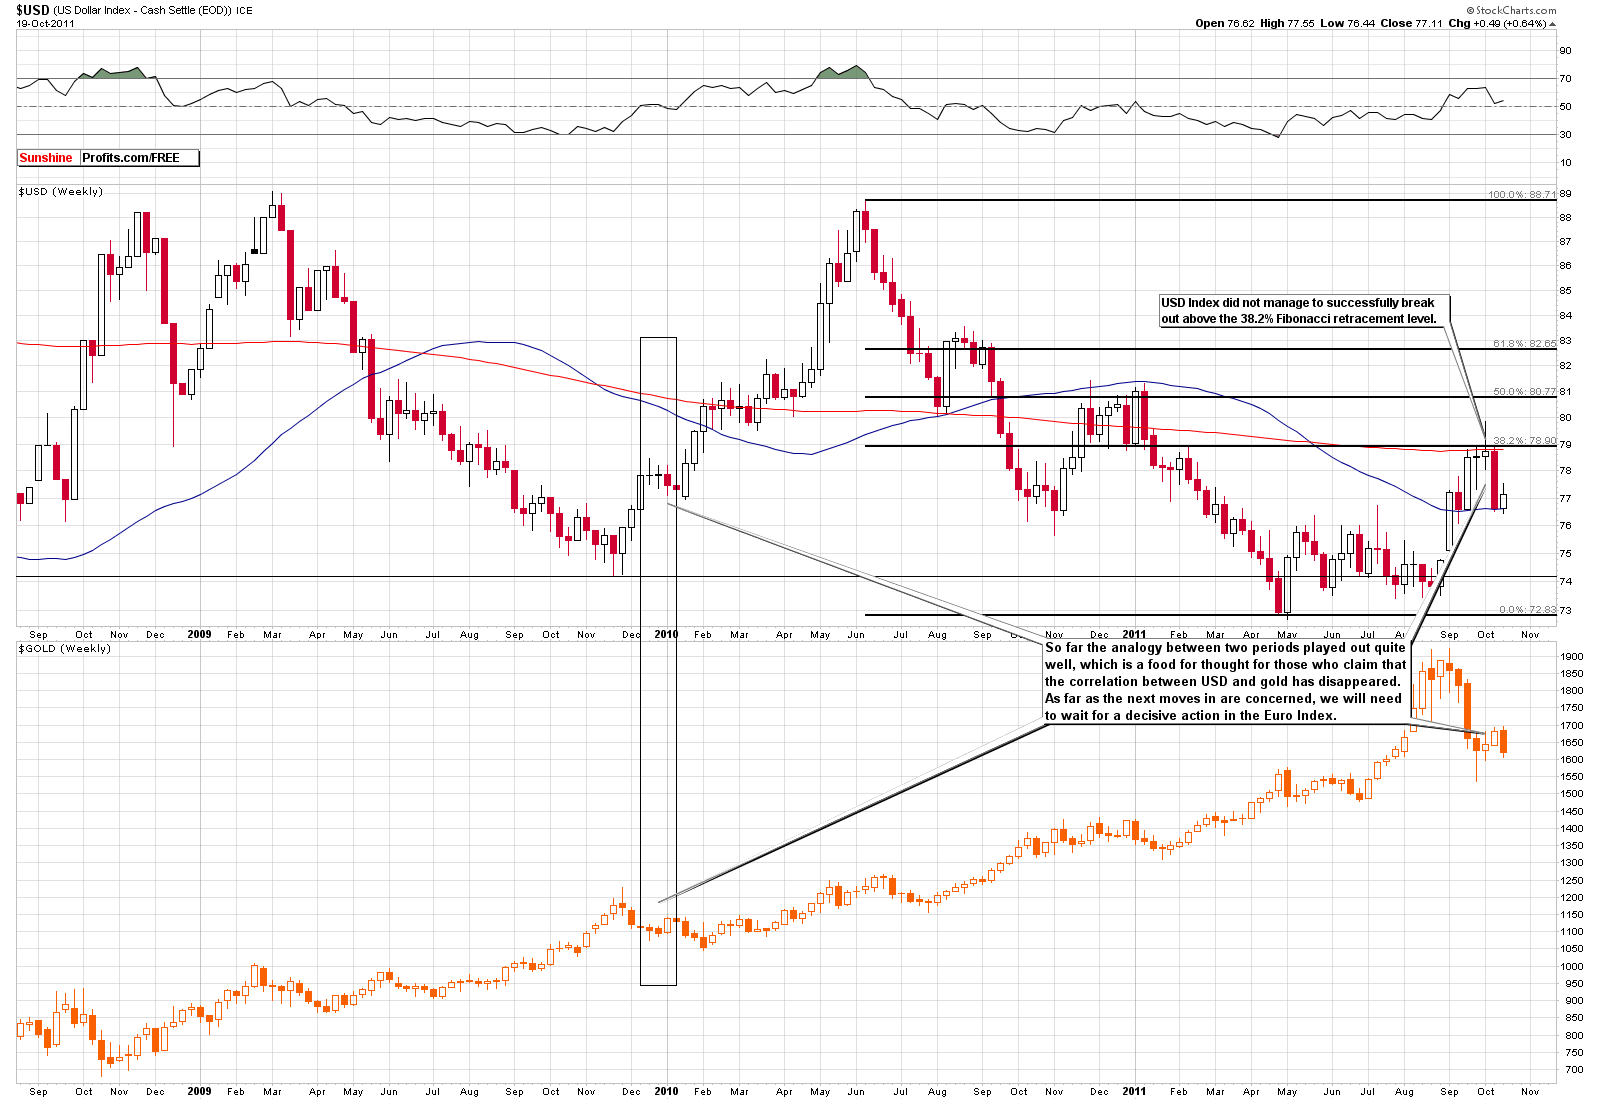
Once again we look at the implications for the dollar and for the price of gold as we compare them side-by-side (click on the chart to enlarge it). Here we have some food for thought for those who claim that the correlation between gold and the dollar has disappeared or is no longer applicable. The analogy between today and late 2009 played out remarkably well, as a decline in the dollar coincided with an upswing in gold's price. So where is the next move from here?
With the tense situation in the currency markets, especially with respect to the euro, the situation is quite blurry. The Eurozone tensions have diminished somewhat this week and a move higher for the euro appears to be about a 55-45 likelihood and would, of course, result in a likely decline in the USD Index.
Summing up, the situation is truly quite tense, but the days and weeks ahead should clarify it greatly. With the odds apparently favoring an uptrend for the euro rather than the dollar, the outlook for precious metals appears slightly more bullish than not at this time.
General Stock Market
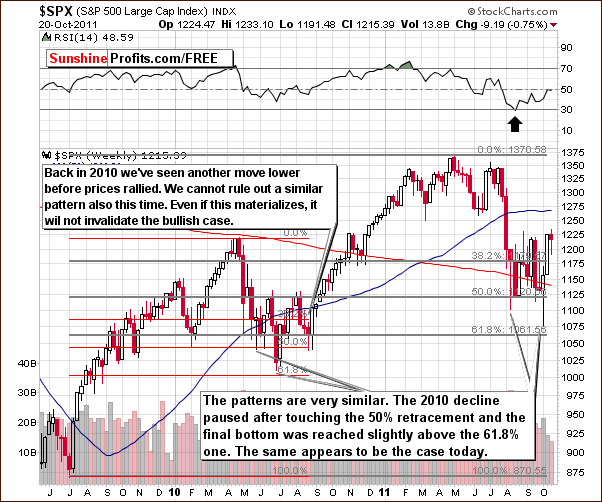
In the medium-term S&P 500 Index chart, we see that stocks held the gains of the previous week. If a rally is seen on Friday, stocks will break out above previous highs and this will clearly make the situation more bullish.
Quoting from last week's Premium Update:
We continue to see a significant analogy to 2010 trading patterns. There is a possibility that we may see another move lower before the bigger rally begins. This would be similar to what was seen in August of last year and may be seen once again if history repeats itself.
The same applies today and the situation is not too worrisome at this time as long as stocks stay above their previous lows. Unless a downturn of this nature is seen, the situation will remain bullish.
Summing up, the situation for the general stock market is slightly more bullish for the week ahead even though the rally may not continue immediately. A small decline in stock prices or a short period of sideways price movement may be seen in the days ahead before any rally of significance. There does, however, appear to be about a 55-45 likelihood that an immediate rally will be seen.
Correlation Matrix
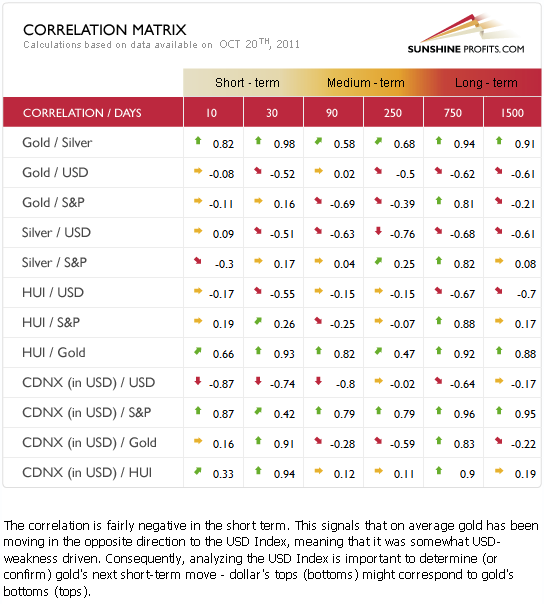
In this week's Correlation Matrix, we can analyze the implications discussed in prior sections of this update. The general stock market influence on precious metals is seen here to be quite negligible at this time. Little influence is seen in the short-term columns, so even if stock prices move lower in the days ahead, the precious metals markets likely would not be affected to any great extent. Gold and the dollar have a visible negative correlation but not a very strong one. Implications here are slightly bullish for the precious metals. More details will be discussed in the gold and silver sections which follow – particularly, in our analysis of the long-term charts.
Gold
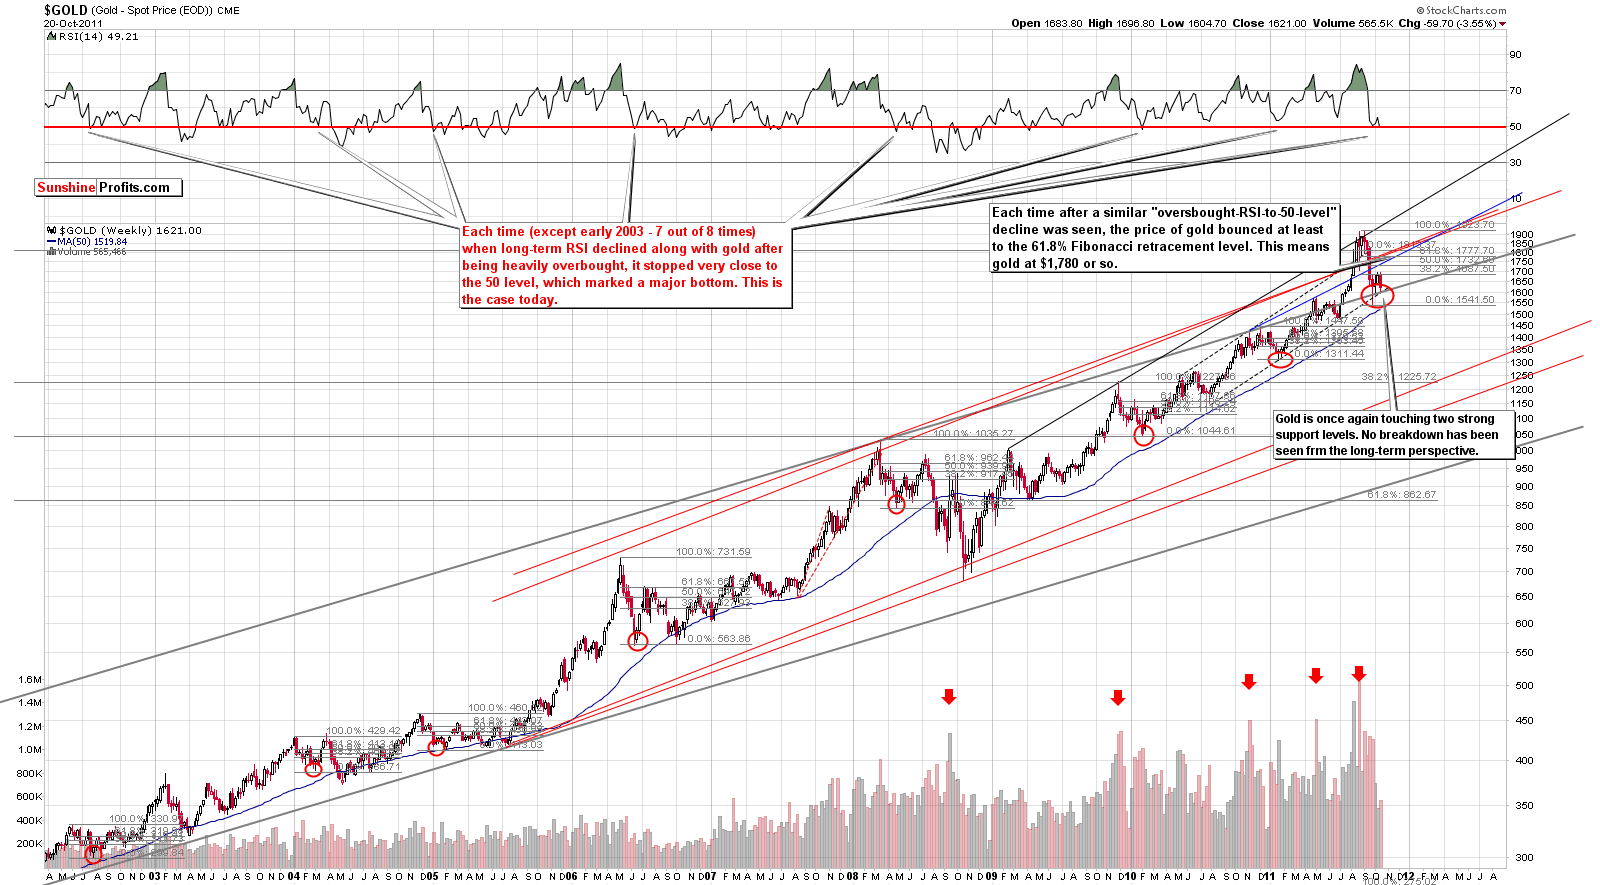
We begin our gold section once again with a look at the very long-term chart (please click the above chart to enlarge). Here we see that even though gold’s price has declined this week, it reached the intersection of two important support levels and rallied late on Thursday after doing so. Therefore, no breakdown has been seen from the long-term perspective and the general direction for gold still appears to be to the upside. This is also confirmed by the current RSI levels.
A likely upside target level for gold at this time still appears to be $1,780, which is a good bit above where the price is today. In last week's Premium Update, we discussed a rebound which was expected to be similar in scope to the previous decline.
The average performance of gold after an above-mentioned bottom in the RSI is historically very strong. Every time over the past 8 years, gold's price has rebounded to at least the 61.8% Fibonacci retracement level (…. This is about $100 higher than Thursday's closing price level, so the upside potential here is significant. (…) In each case, the rebound in gold's price was very similar to the shape of the decline seen before the bottom. If this holds once again, the recent very sharp decline which is similar to one in 2006 could be followed by a very quick upswing to the 61.8% Fibonacci retracement level or higher.
This move has yet to be seen but our points regarding the likely rapidness of the eventual rally have not been invalidated. The point here is if a decline is seen before the upswing, it could simply be the formation of a double bottom with the rally yet to come. So a short move down did not invalidate any rally this week since the rally had not yet begun. We have simply seen a rebound after an initial bottom with a second bottom now being formed. As long as the two support levels in the $1,600 range hold, the outlook remains bullish.
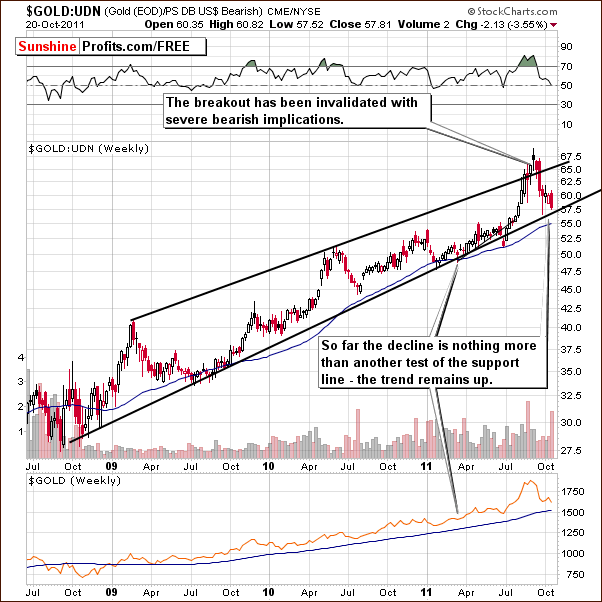
In this week’s long-term chart for gold from a non-USD perspective, we see another move towards the lower border of the trading channel. This appears to be no more than a test of the support line and the upside potential appears greater than the downside risk. The outlook is therefore bullish from a non-USD viewpoint this week.
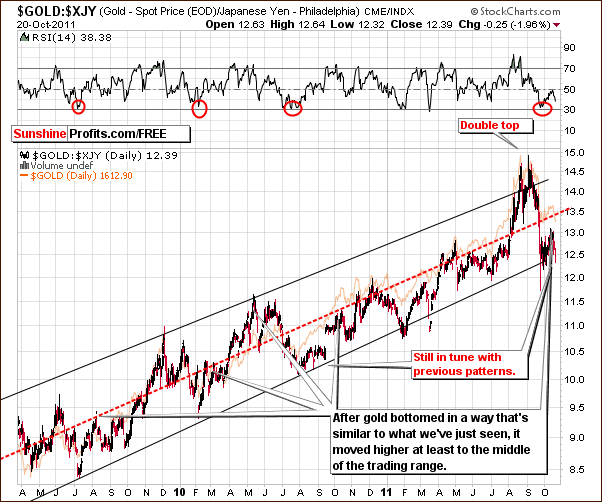
Looking at gold from the Japanese yen perspective, we did not see an invalidation of the previous trading patterns this week. The index level remains close to the lower border of the trading channel. This is not a completely new phenomenon, as a similar trading pattern was seen in late summer 2010. In fact, twice last year the index level rallied following a period of hanging close to the lower border. No real downside signals are apparent in this chart this week.
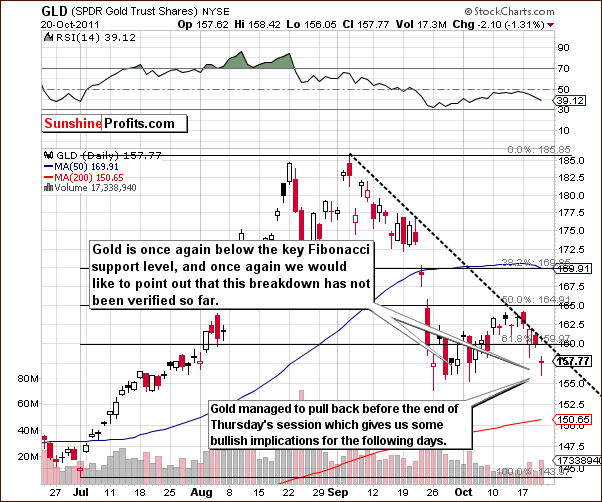
In the short-term GLD ETF chart this week, we could be seeing a double bottom formation being started. There is a possibility of a breakdown below the 61.8 % Fibonacci retracement level created by the July to September rally, but this breakdown has not yet been verified and no conclusions should therefore be made at this time. The situation here could turn bearish if a move below this key support level holds for two or more days (and gold moves below previous lows), but this does not seem likely.
Another point to keep in mind is that gold is quite close to its declining resistance line (dashed line on the chart) and a move above the $160 or so level for the GLD ETF could signify a breakout. A sharp rally much in line with what we stated in our opening gold section this week would then become a real possibility.
Summing up, although gold's price declined in the past few days, we still believe the situation remains bullish for the short- and long term. Please keep in mind that – if visible – signals coming from the long-term charts are more important than those coming from the analysis of the short-term ones. The trend will likely remain to the upside even if additional small price declines are seen and keeping long positions appears justified at this time.
Silver
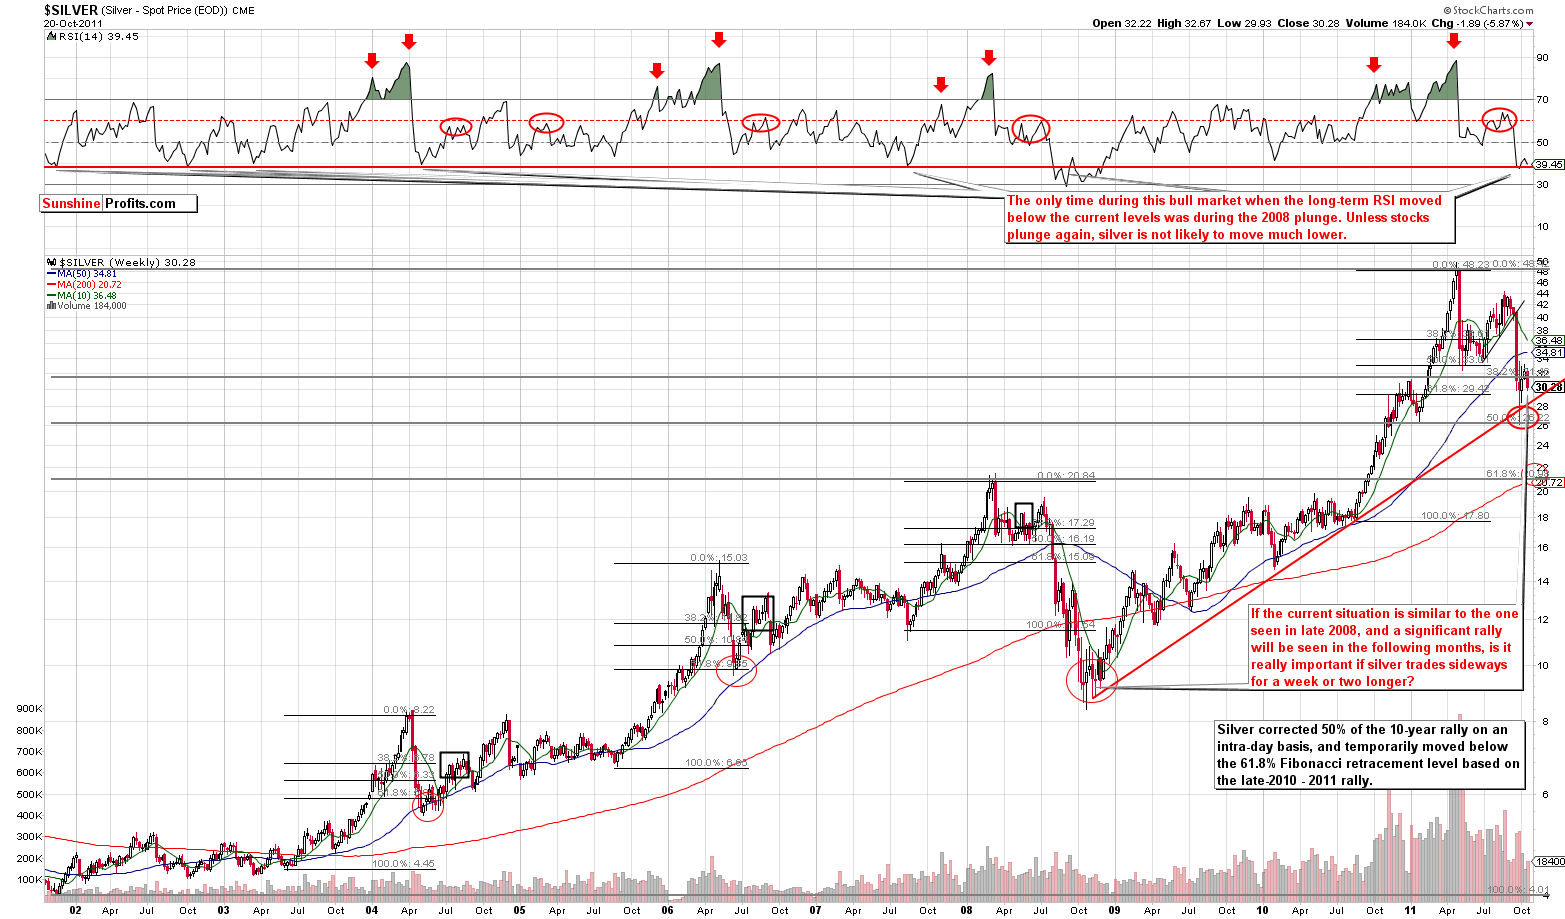
In this week's long term chart for silver (please click the above chart to enlarge), we mainly have just one point but it is of great importance. Based on the long-term interest rate picture along with the gold charts and this very long-term silver chart, it seems that we are in a situation strikingly similar to the final part of 2008. At that time, silver prices were extremely volatile on a weekly basis. This was followed by a period of rally which was every bit as sharp as the previous decline.
If the current situation plays out in a similar manner, the temporary moves up and down are not really important as long as the support lines for silver and gold continue to hold. Silver is presently well above its support and gold is above its own as well. We believe that betting on higher price expectations is justified at this time.
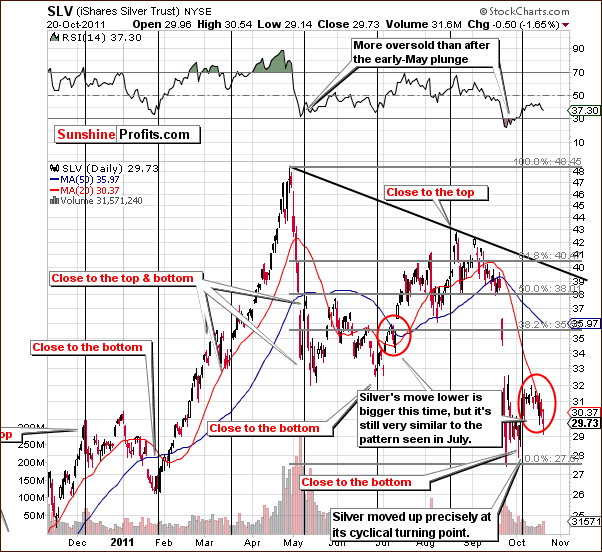
In the short-term SLV ETF chart this week, we can see that the most recent decline in nominal terms has been greater than was seen in July but, in relative terms (compared to the preceding rally) the two cases are very similar. Therefore, the situation is not overly bearish, as a sharp rally followed the previous pattern.
During the last correction, we saw silver's price cross its 20-day moving average. This time, when this moving average was broken, the correction stopped. The next price move could be quite sharp and the odds favor a move to the upside as soon as silver moves above its 20-day moving average – which is less than $0.70 above where silver closed on Thursday.
Summing up, the situation for the white metal remains bullish much as is the outlook for gold as well. The target for the coming rally for the white metal is around the $40 level.
Gold and Silver Mining Stocks
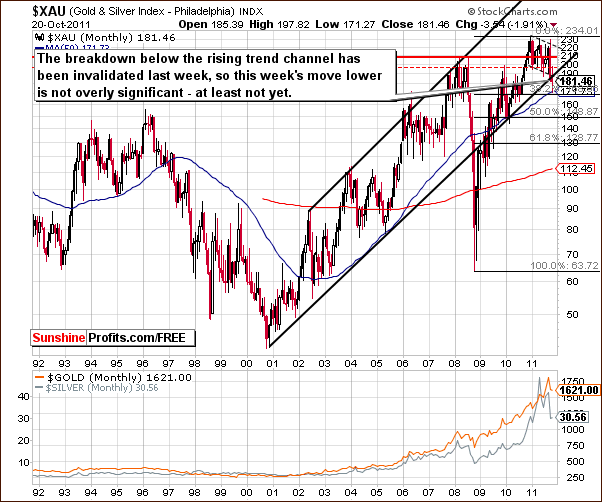
In this week's very long-term XAU gold and silver miner's index chart, we have seen index levels move lower but since the breakdown below the rising trend channel was invalidated last week, the lower index levels are not a major concern at this time. This view could change if declines continue in the week ahead.
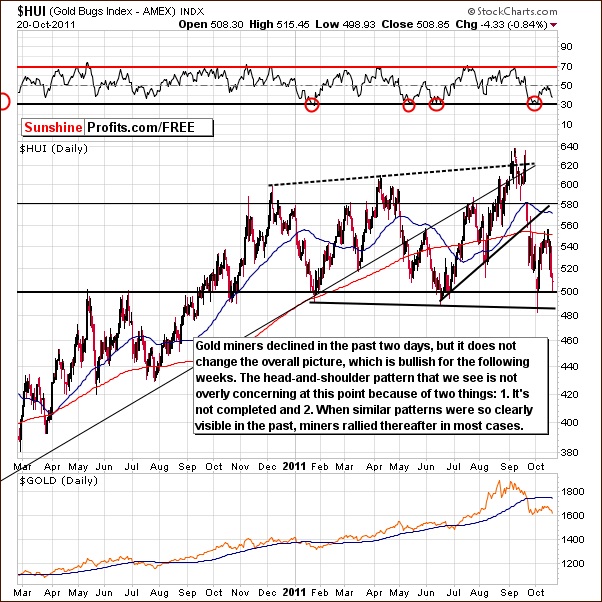
In this week's long-term HUI Index chart, we see a much more interesting situation as a head-and-shoulders pattern appears to be well underway. Normally this formation of a big head and two smaller shoulders is a bearish phenomenon but, in the precious metals markets, it often does not play out too well – especially if it's clearly visible. We realize that this may sound a bit drastic, but that is what we have observed over the past years and found that only completely confirmed and verified head-and-shoulders formations on the precious metals market should be taken into consideration. In most cases a rally used to follow almost-complete patterns - just like it was the case in mid-June earlier this year.
The pattern should not be regarded as overly important until it's verified with a breakdown below the neck level and a pullback that does not take miners above the neck level again. Another thing is that the index levels would have to be below the previous bottom for at least three consecutive trading days. Without these developments, the situation should not be considered too bearish.
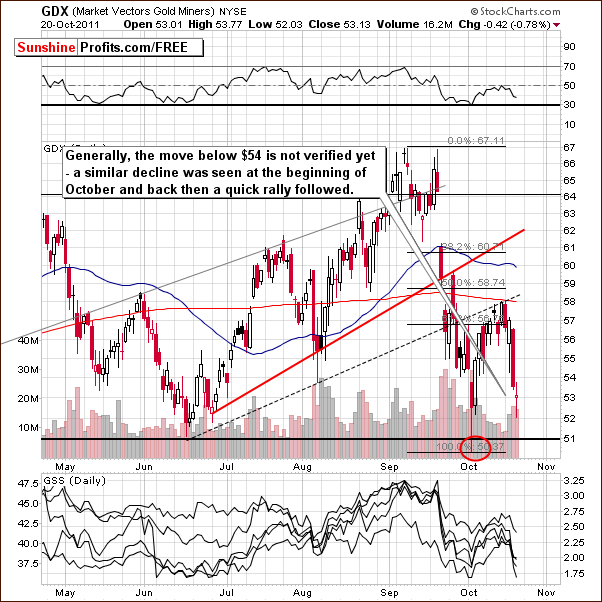
In this week's short-term GDX ETF chart, we see that although prices have declined below $54, the move has not yet been confirmed. A similar pattern was seen in early October, and, back then, much lower price levels were reached. This week we did not see such a move and Thursday's decline was quite modest. Worth noting here is that the prices of mining stocks have just (Thursday) reversed on an intra-day basis and closed slightly below opening levels. This makes the very-short-term picture at least somewhat bullish.
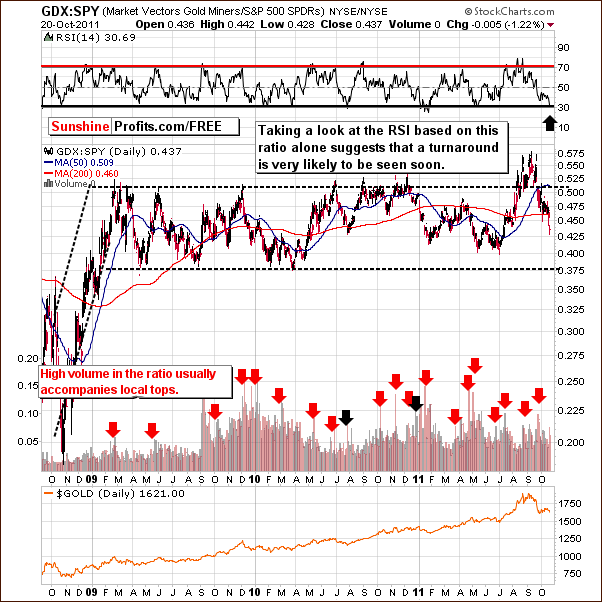
In the GDX:SPY ratio chart which compares the miners to other stocks, heavy declines were seen this week. RSI levels also dropped and the move from an overbought to an extremely oversold level has been very rapid and only seen a few times before this. Generally, in previous cases, the bottom was followed quickly by a rally and the RSI levels today have bullish implications being so oversold at this market juncture.
Summing up, the price moves for mining stocks this week have been far from encouraging but it is quite possible that the situation will reverse. A sharp rally similar to what may happen to silver appears to be a real possibility at this time.
SP Indicators
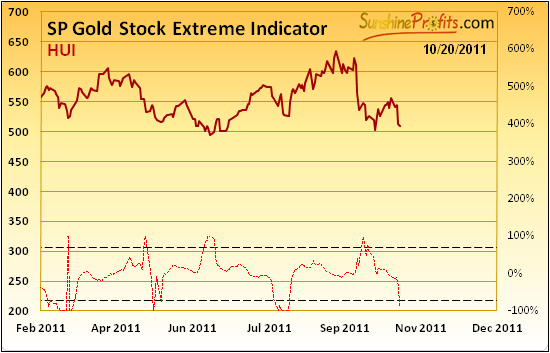
Our SP Gold Stock Extreme Indicator has flashed a buy signal based on Thursday's closing prices. The move below the lower dotted line in our chart in the past has indicated that the local bottom is in. Betting on higher gold prices seems therefore to be a good idea and long positions appear justified. This applies to both short-term and long-term positions for the yellow metal (and for the rest of the sector as well).
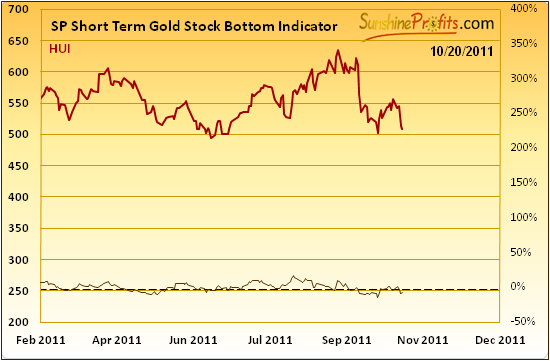
The SP Short-Term Gold Stock Bottom Indicator confirms the bullish situation of our first indicator chart. The suggestion here is that mining stocks are likely to move higher in the week ahead.
Summary
The currency markets are quite tense at this time with the Euro Index at two important resistance lines. At the same time, the general stock market appears ready to rally though it may not happen immediately. All in all, the implications for the precious metals sector appear slightly more bullish than not.
The long-term charts for gold and silver combined with the most recent signals coming from SP Indicators suggest higher prices ahead. The short-term volatility seen recently in the prices of gold and silver has not been too encouraging for those who hold long positions (like your editor), however we believe that keeping these long positions (from both: short- and long-term perspective) is justified based on the current situation on the market and the corresponding risk/reward ratio. Moreover, we believe that holding on to these positions in the past few days was a good idea - even though the sector moved a bit lower - because of the significant probability of a sharp move to the upside.
We would like to take this opportunity to remind you that - with respect to mining stock investments - at this time we prefer the junior mining stocks over the big precious metals producers.
Our next Premium Update is scheduled for Friday, October 28, 2011, however should any of the above points regarding the precious metals market change, we will immediately notify you via Market Alert.
This completes this week's Premium Update.
Thank you for using the Premium Service. Have a great weekend and profitable week!
Przemyslaw Radomski

