
In two Premium Updates at the beginning of this year we identified some of the risks and structural weaknesses that we believed were worth watching in 2011. This week we revisit the list and see how it is panning out so far with the year coming to a close in a few months.
Eurozone
No good news to deliver so far this year on the eurozone. Just this week Slovakia's government became the first in the eurozone to fall over opposition of bailing out indebted economies after the country’s parliament voted down approval for enhancing the zone's rescue fund. Also this week, Jean Claude Trichet, European Central Bank President, warned that Europe's financial crisis has reached “a systemic dimension.” Greece has continued to dominate the headlines and is facing a fifth successive year of recession and a possible sovereign default. Italy, Spain, Portugal, Ireland and even France have seen their share of headlines. Over the course of the year we have seen several instances where bad news about the euro boosted gold prices. Sovereign balance sheets resemble an overweight diabetic on the verge of a heart attack, wrote Pimco's Bill Gross in his recent letter to investors.
Bonds in a Bind
We wrote back in January that after years of delivering gains, bonds might not be such a great investment idea for 2011 since there is a distinct risk that long-term interest rates might rise, which would spell trouble for bondholders. We were wrong, but we were in good company. (And bonds are not our area of expertise.) The person who took the biggest hit for making the wrong call on bonds is the world's greatest bond trader, Pimco's Bill Gross, who advocated dumping government debt because of low yields. Instead, investors have been pouring their money into U.S. Treasuries all year as a safe haven. Due to Pimco's wrong-way bet, the once leading bond fund is up just 1% this year, trailing the returns of a whopping 84% of its peers. Recently Bill Gross has made a U-turn and has placed a big bet on lower long-term interest rates.
Real Estate—Real Trouble
Housing is a key driver of expansion during economic recovery but we said that it looked like home building will remain in a depression with a huge backlog of unsold and vacant homes. Foreclosures will continue with yet more houses dumped into a weak market. That has proved to be the case so far this year. The Standard & Poor’s/Case-Shiller 20-city index of prices has fallen back to where it was in 2003. Housing prices in Phoenix are at 2000 levels, and Las Vegas at 1999 levels. Lower prices have made homes more affordable than they’ve been in a generation. But mostly it’s still a vicious cycle of foreclosures and falling prices. There are still many people who have negative equity — they owe more on their mortgages than their homes are worth-- so that millions of more foreclosures are still in the pipelines.
Currency Wars
At the beginning of the year Brazil warned that the world is on course for a full-blown “trade war” as it stepped up its rhetoric against exchange rate manipulation. Also known as competitive devaluation, a currency war is a situation where countries compete against each other to achieve relatively low exchange rates for their own currency. Currency issues have certainly dominated economic news so far this year. Just this summer Switzerland lowered the value of the Swiss franc, boosting gold's role as a safe haven. Currency tensions between the U.S. and China have not eased over the course of the year. Legislation designed to press China to let its currency rise in value passed the Senate just this week. Americans say that China's yuan policy already amounts to a trade war that has decimated the U.S. industrial base with artificially cheap products.
Slowdown in China
We wrote that emerging market economies continue to grow, but that poses risks of inflation. We said: “China remains the 800-pound gorilla, with economists wondering how it will manage its rapid growth.” That has mostly been the case this year. Fast growth has fired up the country's economic engines, but it has also led to stubbornly high inflation. In March of this year, the Chinese government said that food prices rose by 11.7 per cent. Gold is considered a hedge against inflation and we have seen a rapid rise in gold buying among the Chinese middle class.
Social unrest
When we wrote that this year we are likely to see social unrest, demonstrations and riots we didn’t know just how right that was going to be. Look at the so-called “Arab Spring,” the protests in Tel Aviv, Spain and Greece and the recent “Occupy Wall Street” movement in the U.S. which is spreading across the country. When there is unrest, people tend to turn to gold to protect their wealth.
Hyperinflation
We wrote that sovereign debt across the West is past danger level and it won't take much for people to lose confidence in their currencies and start trading them for anything of value (Gold? Silver? Platinum?) Hyperinflation has a single cause: it occurs when a government cannot borrow money because its debt has risen so much that investors believe they will never be paid back with close to the same purchasing power. As a consequence of this flight of confidence, such a government is forced to print money to meet its obligations. This further undermines the value of its currency, often culminating in a frenzied collapse.
So far this year we have not seen hyperinflation but plenty of lack of confidence in sovereign debt.
War in Korea, or Iran, or Pakistan, or the Middle East
We wrote that we pray war will not take place anywhere in the world. So far our prayers have been answered.
Let's turn to the technical part starting with analysis of the 30-year US Treasury Bonds. We will start with the long-term chart (charts courtesy by http://stockcharts.com.)
Long-term US Treasury Interest Rates
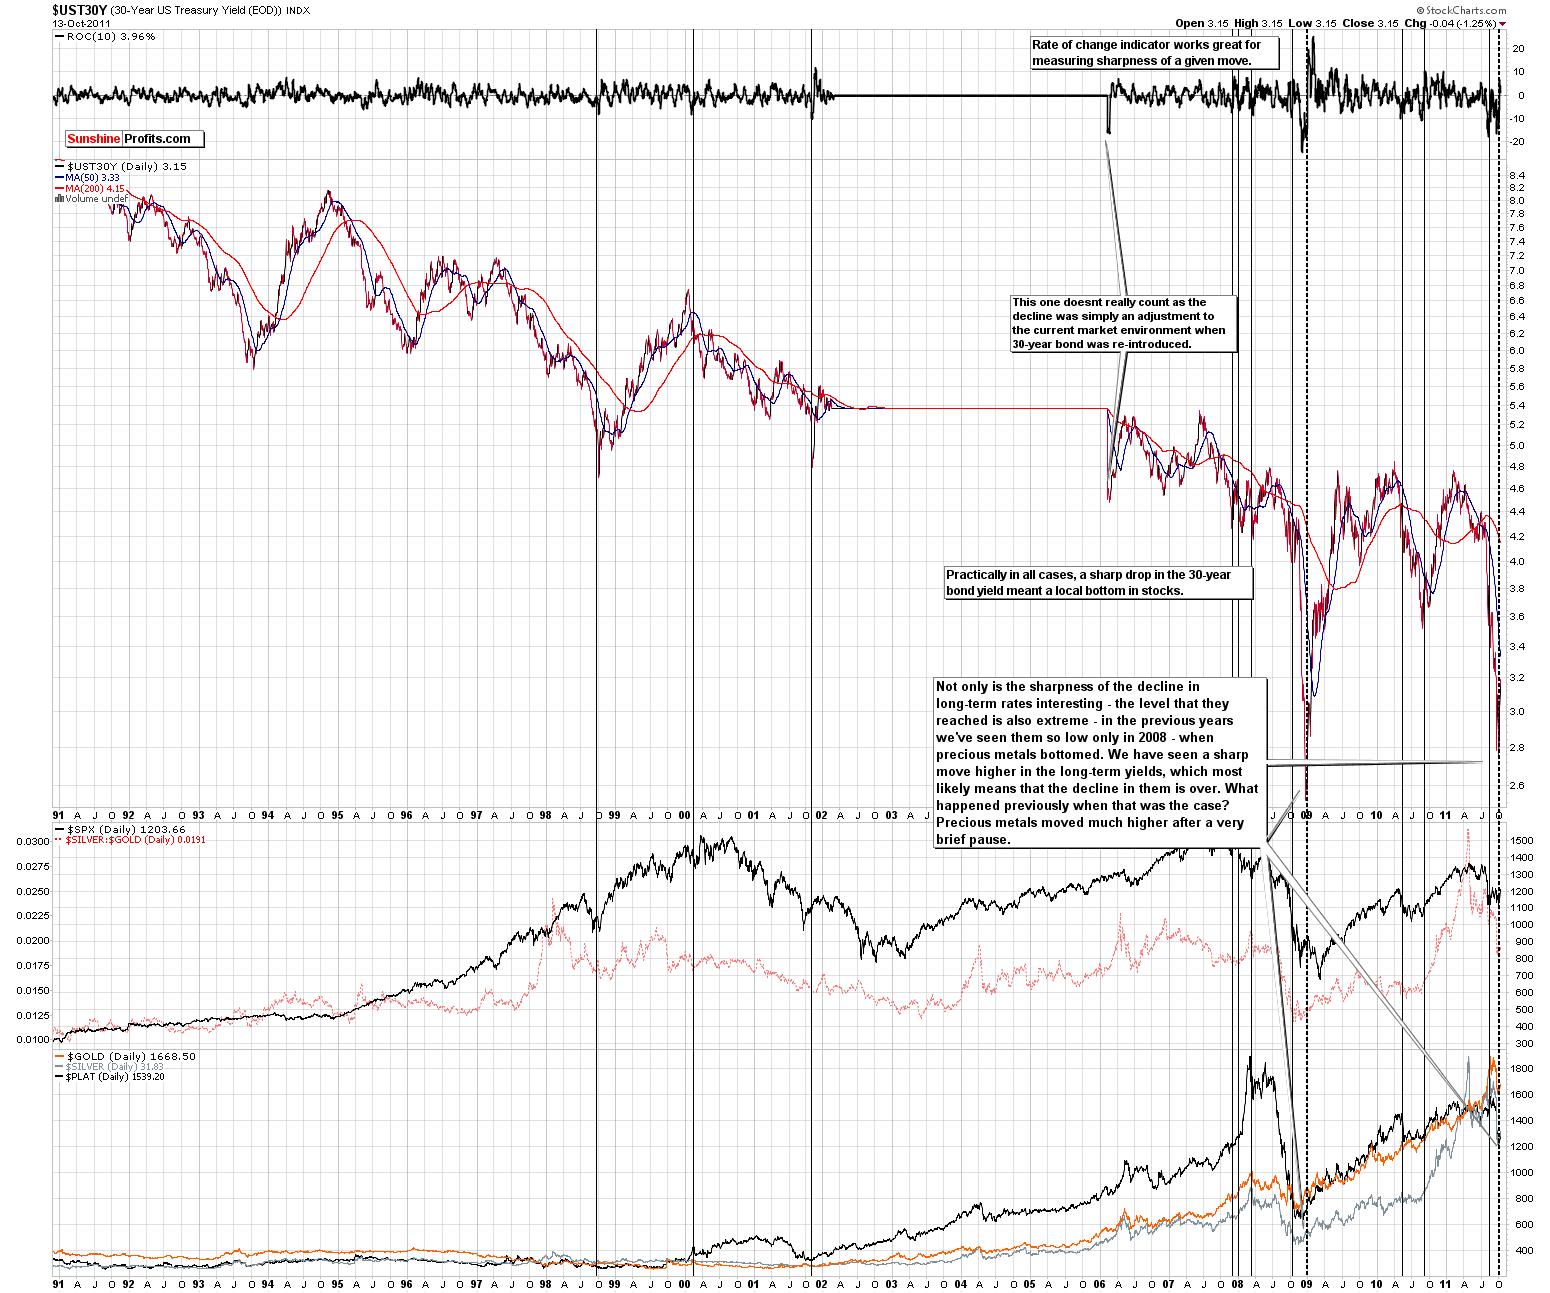
Once again, as we did several weeks ago, we're beginning with the 30-year US Treasury long-term interest rates chart (click on the chart to enlarge it). Rates have dropped sharply once again since we last discussed this topic. The long-term interest rate of U S Treasuries continues to be an important factor which often accompanies specific events in both the precious metals and the general stock market.
Currently the interest rates are close to the 2008 bottom and it's likely we have just seen a major bottom today as well. A sharp pullback has been seen in the long-term interest rate index over the past few weeks. Thursday's close was at 3.15 – clearly above the recent low (below 2.8) and it seems likely that a sharp move higher will be seen fairly soon (in the past, once there were no intermediate bottoms in extremely sharp declines, so it seems that this was the final one this time as well). What does this imply?
Back in 2008, the final bottom for interest rates was seen slightly after the bottom for precious metals but a bit ahead of the final lows for the general stock market. Precisely, just when we’ve seen the beginning of the move higher in the rates, metals paused after the final bottom, and resumed their rally very soon after that. This may very well be seen again and the implications, which combine both fundamental and technical perspectives, are bullish at this time.
Summing up, the bottom appears to be in for long-term interest rates. This means investors guessing this may be borrowing capital at very low rates in order to invest in higher yield instruments such as precious metals and stocks. It seems that the factor for low interest rates was supply-side meaning the Fed pledging not to raise the interest rates for a long time, and the current move is likely to be demand-driven – meaning that consumers/investors are taking advantage of the low rates by borrowing (and then spending / investing thus pushing prices higher). With higher demand for money comes its higher price – and that's what interest rates are.
This is bullish news for stocks and metals.
Euro - USD Indices
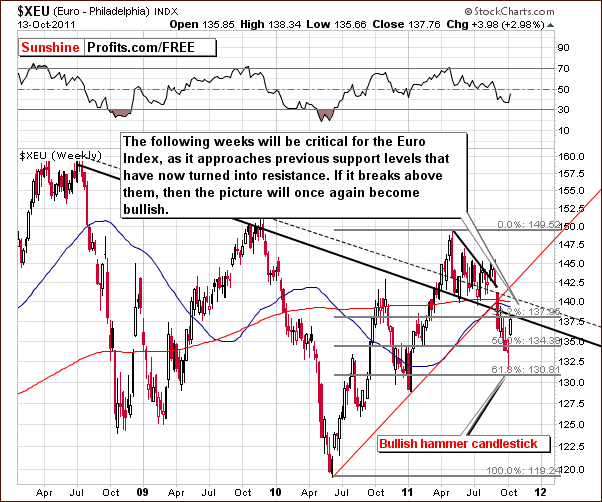
In this week’s long-term Euro Index chart, we see that the index moved quickly higher after forming a bullish hammer-reversal-candlestick-pattern. It is now at a point where two important resistance lines coincide. These are the Fibonacci retracement level and the long-term declining resistance line.
Will the Euro Index break out from here? It is impossible to tell at this time and there is certainly much euro-related tension present. If the index does move above the previous support line which it is now beneath, say to 141 or higher, and it stays for some time, this will be a bullish development. The implications for the dollar would be likewise bearish. The jury remains out at this time.
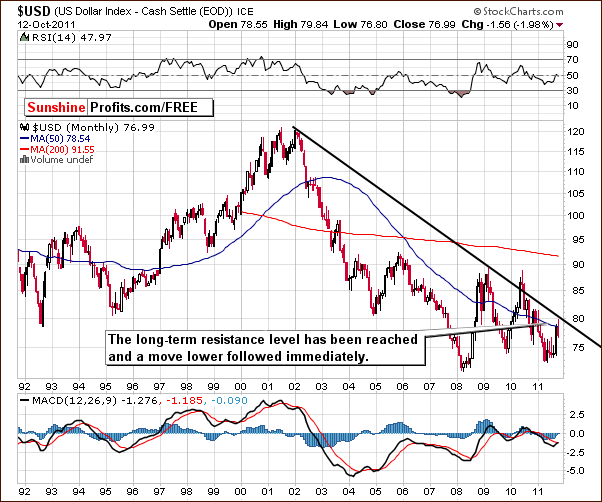
In the very long-term USD Index chart, a quick move lower was seen after the long-term resistance close to the 80 level was touched. At this point, the long-term trend remains down and the situation here is far less bullish than the short-term picture. What happens next will depend quite a lot on the situation in Europe and in how the markets react to the news of the following days.
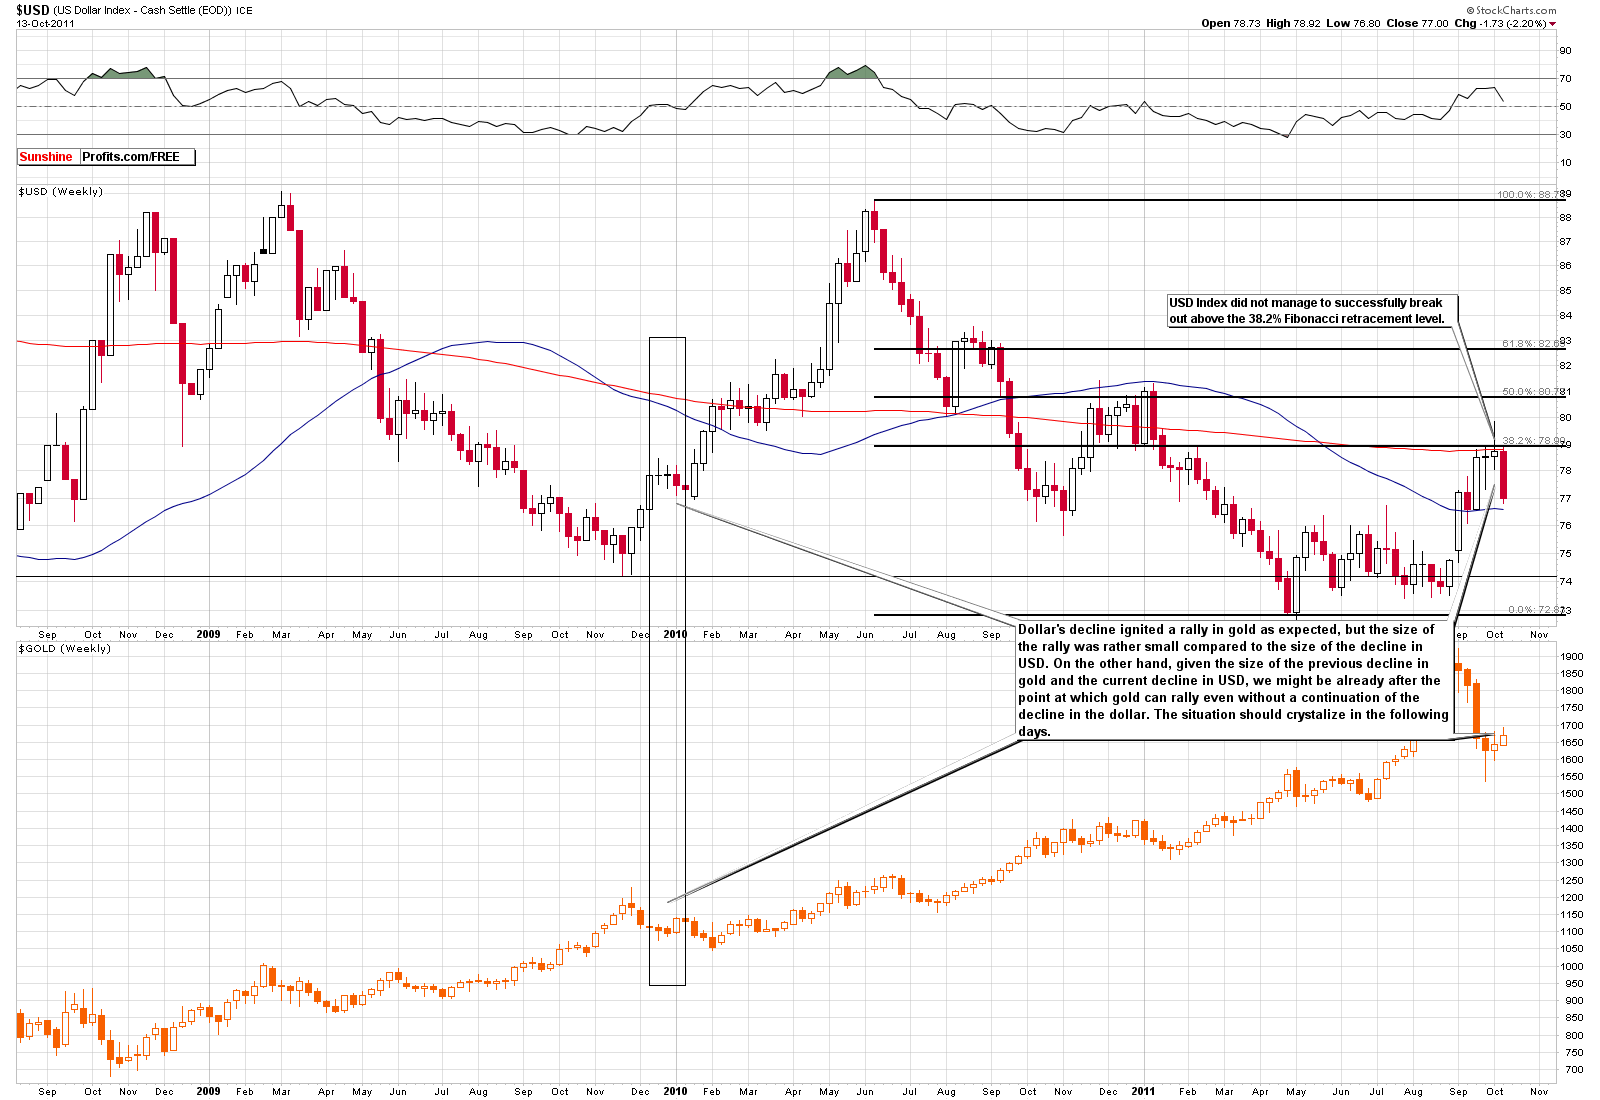
Once again we look at the implications for the dollar and for the price of gold as we compare them side-by-side (click on the chart to enlarge it). Last week the dollar declined and gold rallied but not to the extent that seemed to be in the cards. At this point, it's uncertain whether gold has simply stopped reacting to the dollar or whether its reaction is simply delayed.
The lack of clarity opens the possibility that we may not have seen the final bottom for gold. Also, there could be a point where gold and the dollar move higher together. At this time there are too many questions concerning the currency markets and it may be some time before the situation eventually crystallizes. We will keep you informed accordingly.
Note that when the USD Index rallied in December, gold did not respond immediately. The price of gold moved higher in the latter half of the USD Index rally. It is possible therefore, that we are seeing a similar situation today. It's likely that if the USD Index drops significantly, say to 76 or lower (much lower if euro breaks above the previously mentioned resistance levels), there will be a big reaction in gold's price.
Summing up, the Euro Index and USD Index are both in a rather uncertain territory and the strength of their influence on gold is questionable. Gold did rise in price this week but lacked the expected strength in its rally and many questions remain. The implications for precious metals are mixed at this time.
General Stock Market
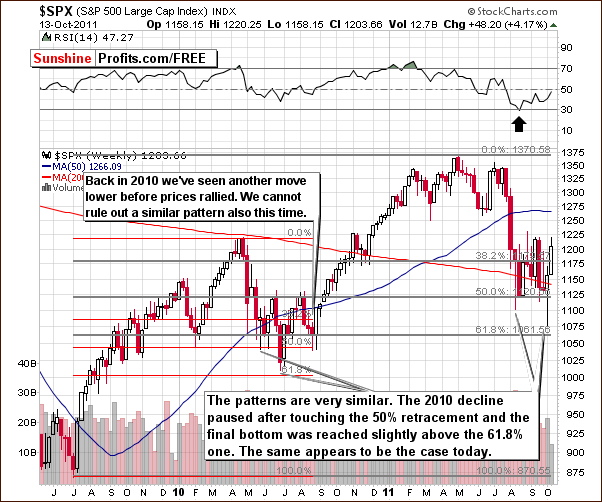
In the medium-term S&P 500 Index chart, we continue to see a significant analogy to 2010 trading patterns. There is a possibility that we may see another move lower before the bigger rally begins. This would be similar to what was seen in August of last year and may be seen once again if history repeats itself.
This would be in tune with 2008 as well when a sharp bounce in interest rates was seen. Back then, the bottom in interest rates followed the final bottom for precious metals and preceded the general stock market bottom. This is not our official prediction for stocks – it seems that the odds are 50/50 whether we will see a small decline before the continuation of the rally or not. Either way, higher stock values appear to be 60-70% probable in the coming months.
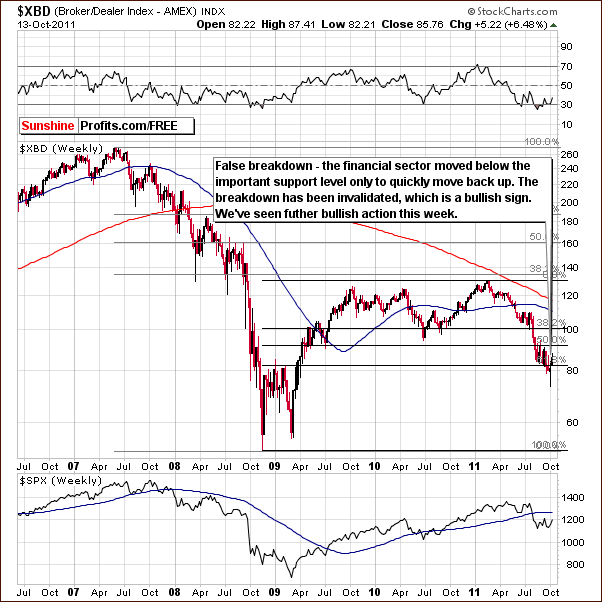
In the XBD Broker Dealer Index (financials) chart, we see a confirmation of the move above 80 and above the Fibonacci retracement level as well. This chart is a useful tool for identifying upcoming general stock market moves. Here, with the previous breakdown invalidated and the bottom likely being in, the implications are clearly bullish.
Summing up, the situation for stocks appears to be bullish for the medium term but the short-term situation is quite cloudy at this time. This is mainly due to the situation in the currency markets which are closely tied to the European financial crisis.
Correlation Matrix
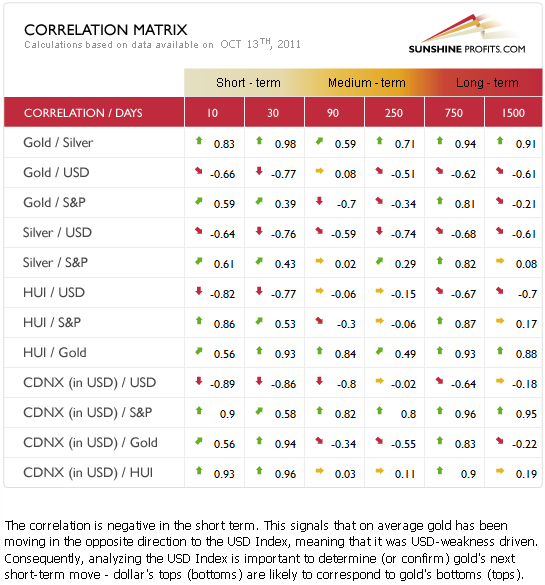
In this week's Correlation Matrix, the precious metals relationship with other markets has become quite a bit weaker (as seen in the 10-day column). The negative correlation with the dollar and the positive correlation with stocks remain in place but the coefficients are somewhat lower. It seems that the relationship between gold and the dollar in recent trading days may be wearing out. The tendency is only slightly visible, though.
The short-term picture for the general stock market and the overall condition in the currency markets lack clarity this week. It seems that investors would be wise to mainly focus on signals from the precious metals sector itself. The gold and silver markets are covered in detail in later sections of this update.
Gold
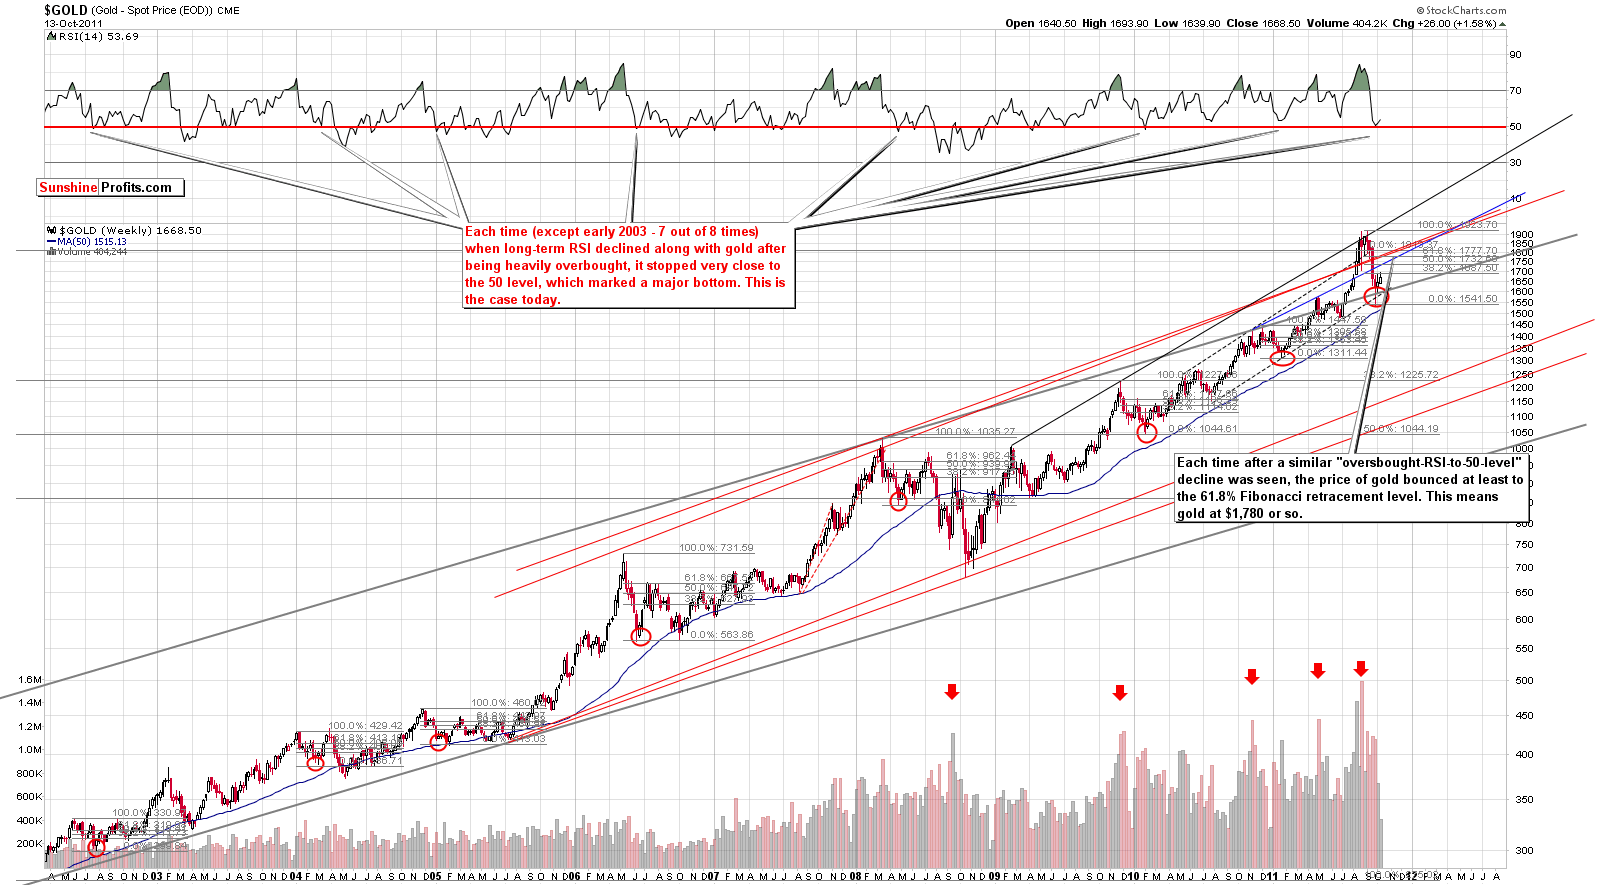
We begin our gold section once again with a look at the very long-term chart (please click the above chart to enlarge). The focal point in this week’s chart is the RSI section at the top of the chart. In the past two months, the RSI has dropped from overbought levels above 80 to the 50-level. This has typically been the bottom level over the past few years and it seems to be once again this time.
The average performance of gold after an above-mentioned bottom in the RSI is historically very strong. Every time over the past 8 years, gold's price has rebounded to at least the 61.8% Fibonacci retracement level. Sometimes the increase has been greater, sometimes even exceeding previous highs. We are presently not yet close to this level, which is in the $1,780 range. This is about $100 higher than Thursday's closing price level, so the upside potential here is significant.
In each case, the rebound in gold's price was very similar to the shape of the decline seen before the bottom. If this holds once again, the recent very sharp decline which is similar to one in 2006 could be followed by a very quick upswing to the 61.8% Fibonacci retracement level or higher. Therefore, a rather quick $100 move to the upside seems quite possible and with this information coming from the analysis of a very long-term chart, it is more reliable and significant.
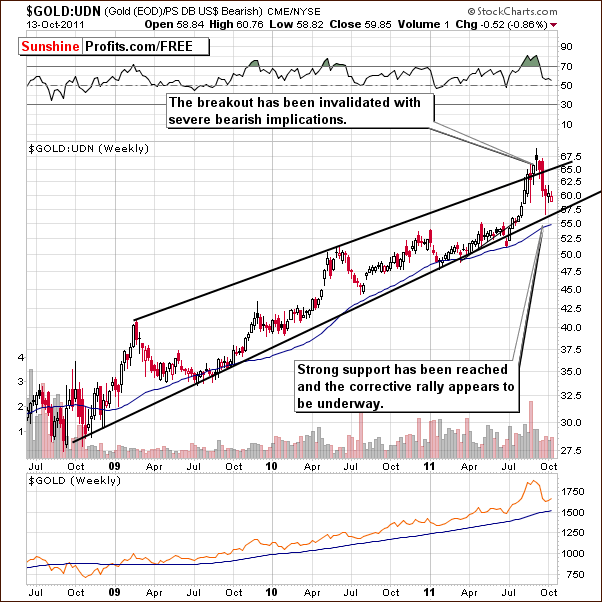
In this week's long-term chart for gold from a non-USD perspective, no significant rally has yet been seen. The recent breakout was invalidated and since that time strong support has been reached. A rally from here is more probable and there is plenty of room for such a rally to commence.
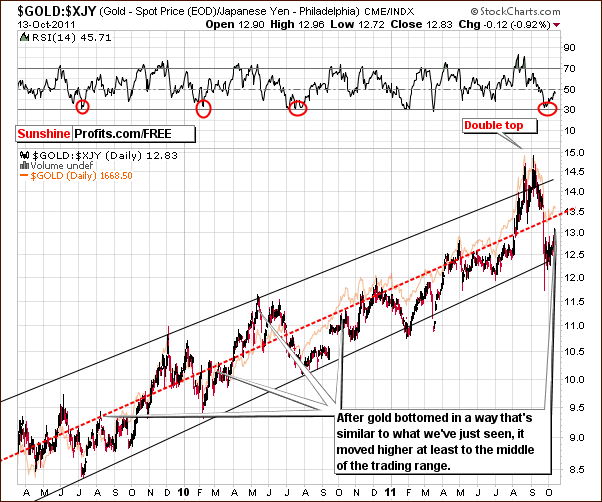
Looking at gold from the perspective of the Japanese yen, we see a graphical representation of points discussed in last week's Premium Update:
It appears that a rally is ahead and the only question appears to be whether the index will move to the mid-channel range or to the upper border of the trading channel.
As you can see clearly in this week's chart, when the bottom of the trading channel is reached, the index generally moves back to at least to the middle of the trading range. The implication here is clearly pointing to a rally in the coming days or weeks.
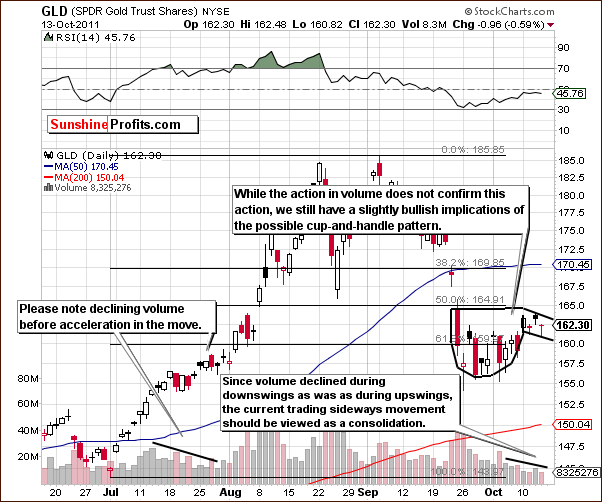
In the short-term GLD ETF chart this week, it appears that we are seeing a bullish cup-and-handle pattern. Some consolidation has been seen as it appears that a base is being built for a more powerful move to the upside. This is consistent with other indications pointing to a sharp rally (mentioned earlier in this section).
The low volume levels seen recently indicate that it's likely that investors are waiting for the move in either direction to begin before jumping in. This was also seen in July, when a period of low volume trading days was followed by a sharp rally on high volume.
Summing up, this week's charts collectively point to a bullish period ahead and a price move to the upside in the $100 range appears quite likely in the coming weeks.
Silver
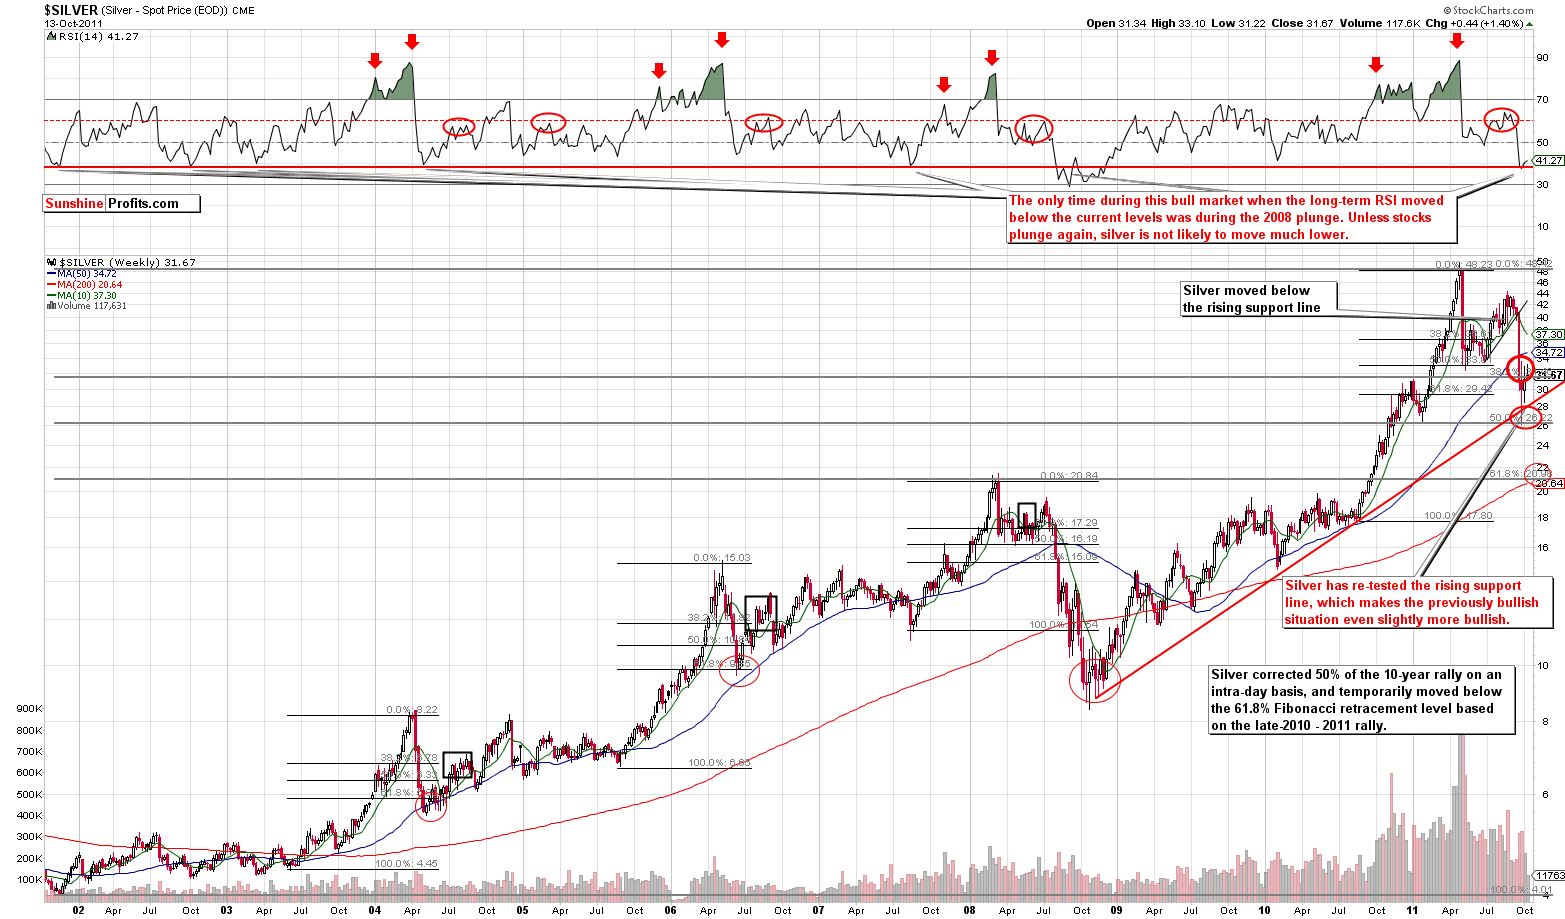
In the long term chart for silver (please click the above chart to enlarge), very little change was seen this week. Silver's price moved to the 38.2% Fibonacci retracement level based on the 2002–2011 rally. Silver's price pulled back after moving above this level. This is likely insignificant and nothing more than a verification of a move back above the 38.2% level. Such price action is not unusual.
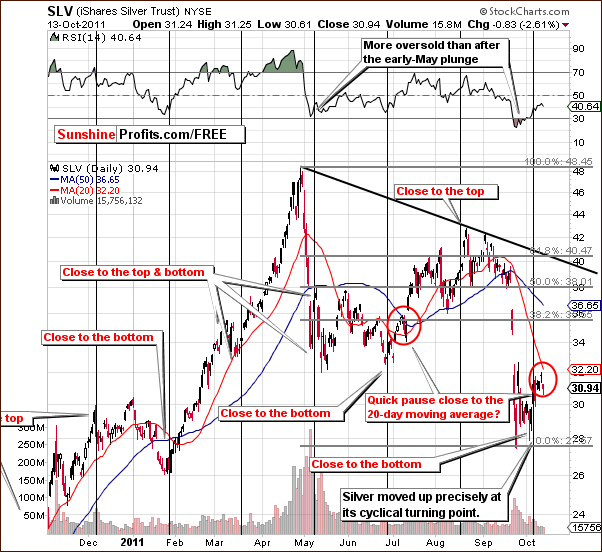
In the short-term SLV ETF chart this week, we see a move of interest as silver’s price declined on low volume indicating a period of consolidation. The price level is now close to the 20-day moving average and in the past, such moves following an early part of the rally have typically been meant a reversal to the upside after the bottom was (shortly) reached.
Thursday's price decline is not really of concern, and the situation is not bearish at this time.
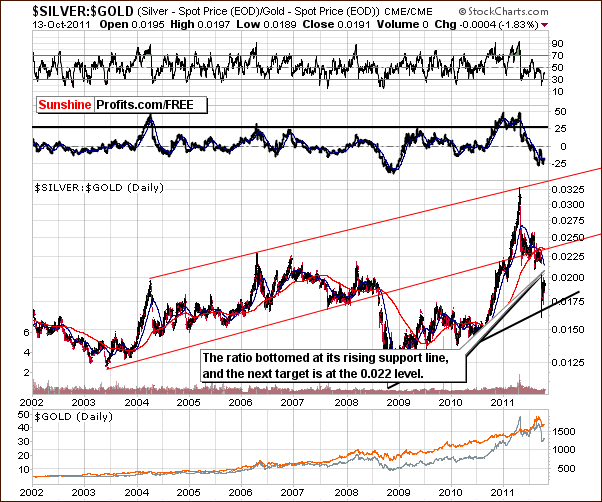
In the silver to gold ratio this week, we see a bottom developed after the rising support line was reached. Thursday's close was just under .02 and it appears that a rally from here is likely. The target level is around .022. If gold's price moves sharply higher, silver is likely to increase to a greater extent on a percentage basis. The next target level for SLV ETF is in the $38 -$40, based on the above ratio, medium-term declining resistance line and Fibonacci retracement levels visible on the SLV chart.
Summing up, the situation is positive for silver as it also is for gold. With a current target level of $40, more information will likely become available as silver move closer to this target (or the move higher is invalidated). We will keep you informed of all developments as warranted.
Platinum
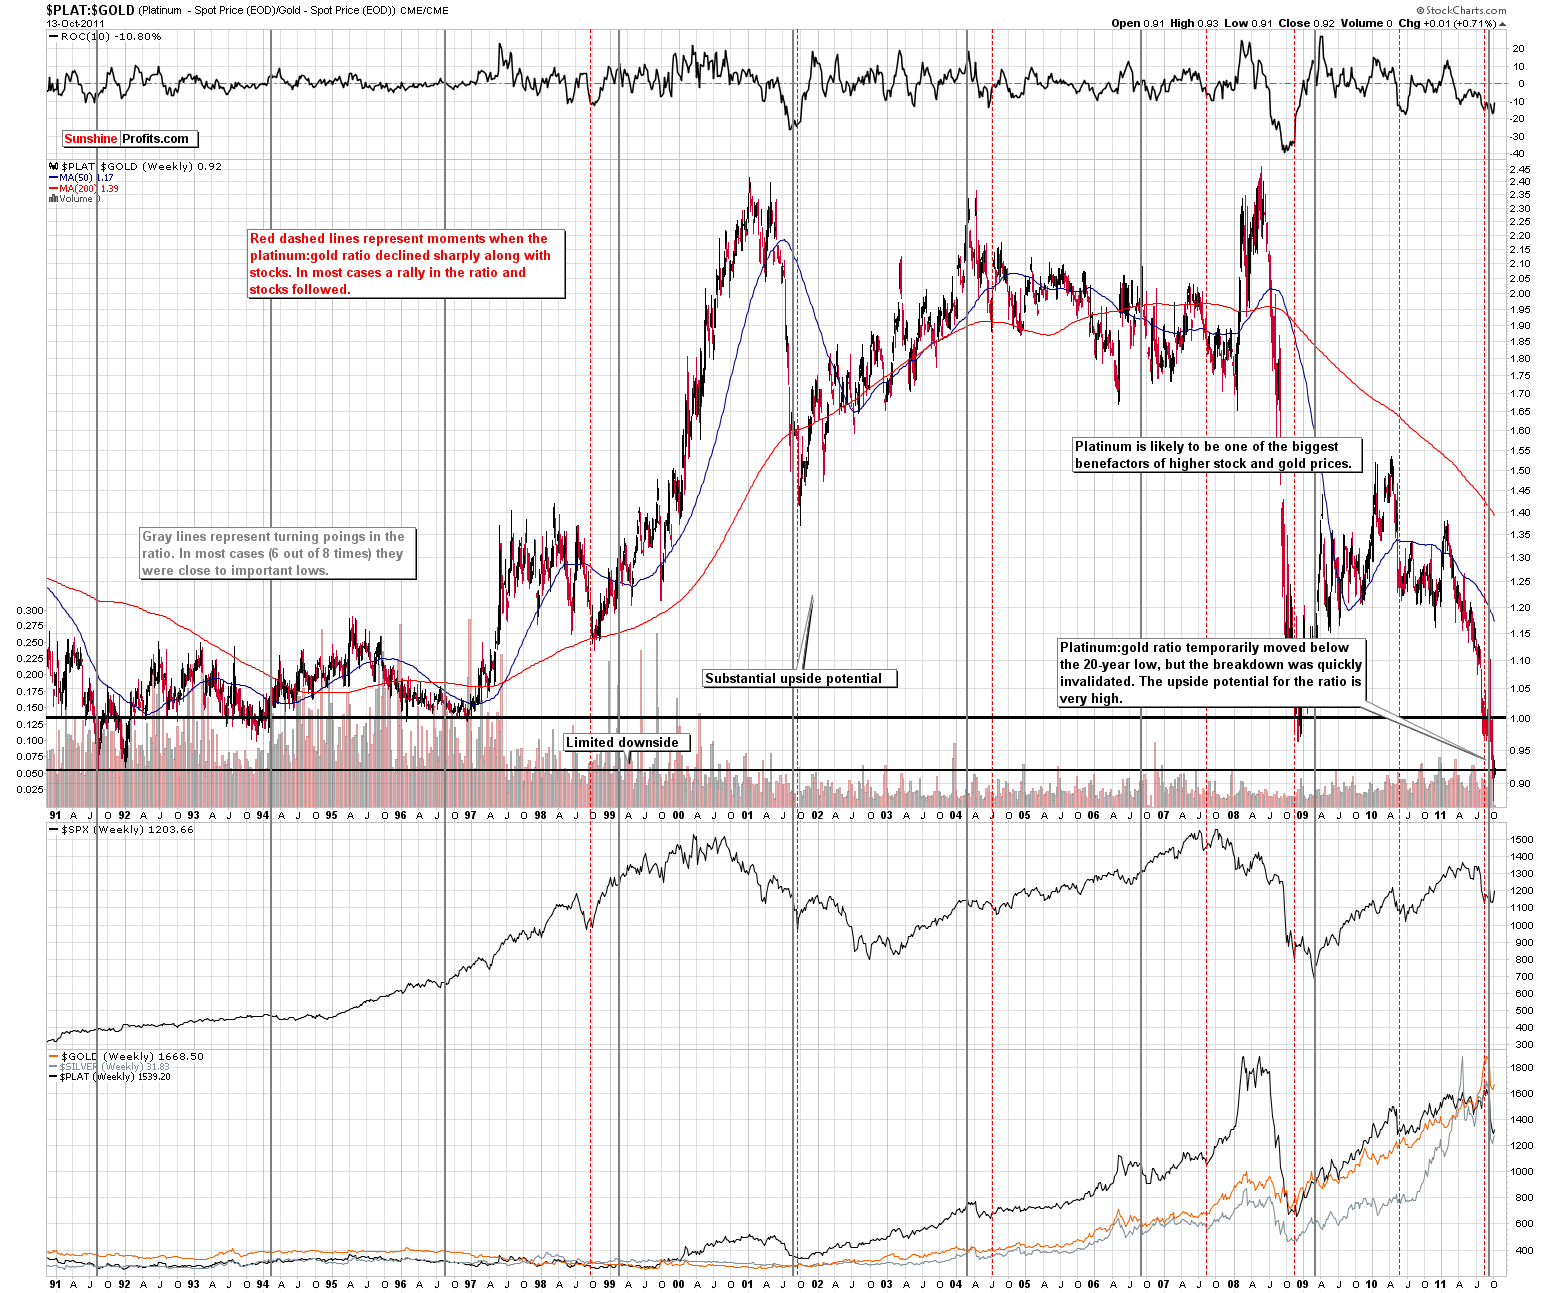
In the platinum to gold ratio chart (click on the chart to enlarge it), we indeed are at a major bottom at the present time. Keep in mind what we have said concerning long-term interest rates and the general stock market. In the past, bottoms were reached first in precious metals, then in interest rates, and lastly in the general stock market.
Platinum's price is still less than gold's and this has never held for long over the past 20 years. The ratio value is lower than 1 when platinum's price is less than gold's since platinum is in the numerator of the ratio. A quick look at the chart shows how rare an occurrence this is.
Analysis of the ratio level chart indicates that higher values are likely and the long-term cycles noted by vertical gray lines in the chart concur. Therefore, the situation remains very bullish for platinum.
Gold and Silver Mining Stocks
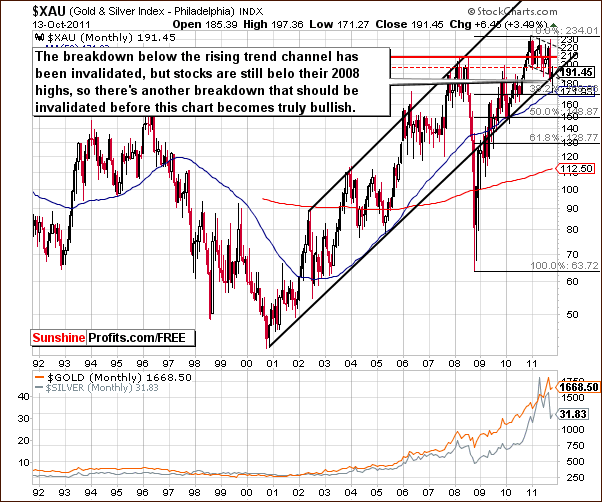
Only one thing has changed in this week's very long-term XAU gold and silver miner's index chart. Namely, the breakdown below the rising trend channel has been invalidated and the index level is now clearly above the lower border. The breakdown below the highs of 2008 has not yet been invalidated. If and when this is seen, a very bullish situation will be at hand.
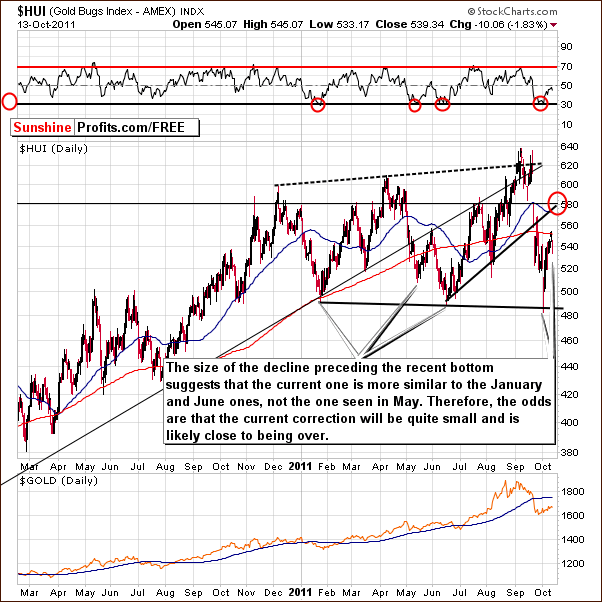
In this week's long-term HUI Index chart, we have seen a small pause in the rally. The question now is whether the next price move will be similar to the July and February upswings or the downturn in June. The current decline has been huge and should be considered for the April to June period rather than just April to May. The analogy best suited for the weeks ahead appears to be July and February as opposed to a comparison with June. Therefore, the decline is likely to be minor.
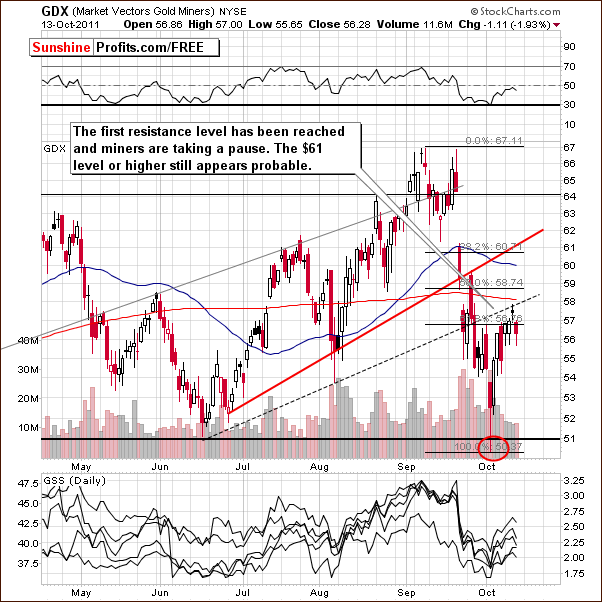
In this week's short-term GDX ETF chart, we have seen low volume levels coupled with a pause in the rally. This took place after the rising resistance level was reached and is therefore not a surprise. It is likely that this is not the final top for the current rally.
Summing up, the situation in mining stocks appears favorable based on the underlying metals and the self-similar pattern in the HUI Index chart. The influence of the general stock market should also eventually be positive although the short-term picture is presently unclear.
Letters from Subscribers
Q: I don't think I have much more stomach for this volatility in gold and silver prices. I haven't made much money in the last 2 months.
A: The recent volatility (HUI Index moving sharply from 540 to slightly above 480 and then back above 540) in the precious metals market caught many investors and experienced traders by surprise. When the HUI was below 490, we received e mails from worried subscribers who fretted if the decline would ever stop and if it was possible for mining stocks to rebound to previous levels, etc.
We thought it would be a good idea to give you information that can help during such times. After all, stress has impact on health, which is at least, if not more important than money. In short, there are two main things to keep in mind:
- Did the reasons for the investment change?
- Is the position size justified?
The first point is about focusing on the big picture and recalling what made you open a given position in the first place. Are these factors still in place? Did anything invalidate them? The price move may or may not invalidate a bullish or bearish picture, depending on the situation. For instance, if you were trying to invest for the long term, the odds are that a temporary downswing didn't change the long-term picture at all. If you thought higher prices are likely based on some B factor, and even though prices are lower the B factor is still in place (or even increases somehow), then the situation naturally stays bullish. Now, if price move had invalidated this B factor, the situation would likely cease to be bullish. So – again – the key question is, has anything changed? If yes, close the position. If not – don't. Either way, focus on the facts and factors that made you open your current position, not on the price move itself.
The second point means that you should only open a speculative position when you can afford to lose it. Remembering this rule should prevent you from being overly emotional over a given trade even if you don't implement the previous rule. With speculative trades, there's always the next train – even if you lose once, it doesn't really matter, because if your approach is right, and on average you make trades when the risk/reward ratio is favorable, then you will make money in the long run. If there is one thing beginning investors should focus on, it is learning to choose the right position size.
While the above is not related to any particular trade, nor to precious metals market, we believe that bringing this up should prove to be profitable not only in terms of financial gains, but also in terms of the stress levels associated with trading, just as important in our view.
Summary
The USD Index and the general stock market are both in uncertain times today. No clear signals are present with respect to the precious metals sector and, at this point, it appears best to look to the metals themselves for indicators.
Long-term interest rates suggest that higher values are ahead for the precious metals. A look at 2008 shows us that the bottoms occurred first in precious metals, next in interest rates, and lastly in the general stock market. We will continue to watch the situation in 2011 to see if this past pattern holds true.
Analysis of related charts and ratios suggest that platinum is likely to outperform gold for the long term. Its price is presently lower than gold's price and over the past 20 years, such a situation does not remain in place for long.
Gold has gone through a trading pattern recently which has been seen a number of times in the past. Sharply higher prices have followed in the most similar trading pattern (2006) but even if the move is not as sharp as it was back then, higher prices are still likely. The increase has always been at least to the 61.8% Fibonacci retracement level and this would mean a $100 rise in price from Thursday's close. The $1,780 target for gold could also bring silver to $38-$40 and the mining stocks much higher as well. Target level for the GDX ETF is $61.
There is a risk that the markets could turn south but this does not seem most probable. A continuation of the current precious metals rallies appears to be about 65% likely at this time.
Our next Premium Update is scheduled for Friday, October 21, 2011.
This completes this week's Premium Update.
Thank you for using the Premium Service. Have a great weekend and profitable week!
Przemyslaw Radomski

