
There are times when we need to have the courage of our convictions, even when we are losing money in the process. (That’s where the courage part comes in. Like Ernest Hemingway said: “Courage is grace under pressure.”) We are still bullish on the precious metals sector in both short- and long term. Although the whole sector moved lower again early this week, important support levels remained firm. Many of our Subscribers are probably concerned, as it is easy to get emotional at times of uncertainty. This is why we sent out a Market Alert on Tuesday saying that although mining stocks took a hit, we have not changed our mind about our long position. If the situation was very oversold before, now it is extremely oversold. We pointed out that the precious metals sector is forming a bottom. Such pullbacks are healthy as they indicate gold has much, much farther to go.
Corrections in a bull market are inevitable as death and taxes. Markets never go up in a straight line. By the time gold put in its most recent high on August 22 after its parabolic rise during August, it had logged a stunning 44% appreciation in calendar year 2011. And even after its recent fall, gold is still 22% higher than it was on its 2011 low, which took place on January 27. Does that mean that gold has further to fall, and that the tumble could be steep?
Let’s take a look at some of the forces impacting the economy and the precious metals market.
The news over the last few weeks, including worries about a possible major banking crisis could cripple the Eurozone economy as a whole, has sent global financial markets down heavily. Many around the world are worried that Europe is about to face a big bankruptcy or sudden default that could set off a new phase of panic in Europe and beyond. It's been nearly two years since the euro crisis began with concerns about the solvency of Greece. Since then it has been a slow-motion drain of confidence and credibility as Europe's leaders have been putting out fires one at a time.
Even in the European countries that are not in debt trouble, growth has ground to a standstill. In France, growth is now at zero. This causes investors to fly to cash while they wait for cheaper prices before re-entering the markets.
When the bad news hit in 2008, we saw a similar drop in prices. At that time gold plummeted from $1,200 to $1,000, a 20% drop, which somewhat equates to the fall from $1,910 to $1,590, or a 16.9% drop. In 2008, the precious metal prices slowly rose as buyers started to come in and it took over a year for prices to recover.
But conditions have changed since then. Central banks are now buyers, not sellers of gold. The Chinese gold market, insignificant in 2008, has grown and will soon overtake India. The newly emerging Chinese middle class is anxious to satisfy its appetite for gold and China's central bank is trying to play catch up with its gold reserves. The Chinese, experienced hyperinflation between 1947 and 1949 and some still remember that gold is the ultimate safe haven in times of hyperinflation.
Many people worry that a full-blown depression is just around the corner. The "Occupy Wall Street" movement just keeps growing with thousands of people, including representatives of several trade unions, marching through the streets of lower Manhattan in an escalation of the demonstrations that began last month.
In times of depression liquid cash becomes king and commodities fall. But today, if a full blown depression were to take place, there is risk of currency collapse which makes precious metals all the more attractive. Right now all currencies on the planet are backed by debt.
We have already discussed in past Premium Updates the effect in recent months of rises in margin requirements. The exchanges that offer margin accounts for metals futures contracts have made it significantly more expensive to hold those positions to maturity, causing forced liquidations of contracts. We have heard speculation this is being done deliberately to undermine confidence in gold as a safe haven asset.
As has happened in the past, the US dollar has gained strength which has put downward pressure on the price of precious metals. The strength of the dollar is not likely to stand the test of time, long term time, that is.
Also, there have been rumors that some major investors, including hedge funds, have liquidated large precious-metal positions in recent weeks. There was talk of George Soros doing it. Many of these investors may have decided to lock in profits to offset losses in other positions.
We believe that gold will continue rising in value over the coming years. Most of the people who are buying it for the long term are doing it to preserve their wealth. Those who have invested in precious metals for the long term are undoubtedly satisfied. They have outperformed all other asset classes for most of the past decade.
On another topic, we note with sadness the passing away of one of the most influential businessman of our time, Steven Jobs. He said in one of his speeches: "Your time is limited, so don't waste it living someone else's life. Don't be trapped by dogma — which is living with the results of other people's thinking. Don't let the noise of others' opinions drown out your own inner voice. And most important, have the courage to follow your heart and intuition. They somehow already know what you truly want to become. Everything else is secondary."
So, again, here is an admonition to follow the courage of our convictions.
To predict if in the near term the prices of precious metals will require much courage on our part, let's begin this week's technical part with the analysis of the Euro Index. We will start with the long-term chart (charts courtesy by http://stockcharts.com.)
Euro - USD Indices
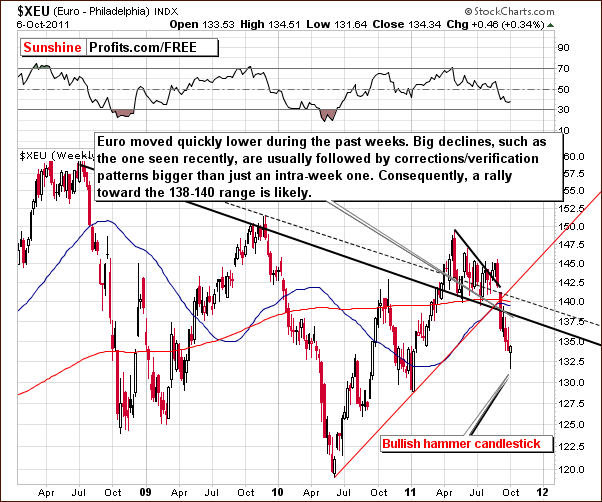
In this week's long-term Euro Index chart, the implications are generally unchanged this week. The index declined initially and then bounced back and is now possibly forming the bullish reverse hammer candlestick pattern. If the index level ends the week near Thursday's close (or at least above this week's opening price), this bullish pattern will be confirmed and the situation will be more bullish than we saw a week ago. A verification of the breakdown below key support level appears to be likely.
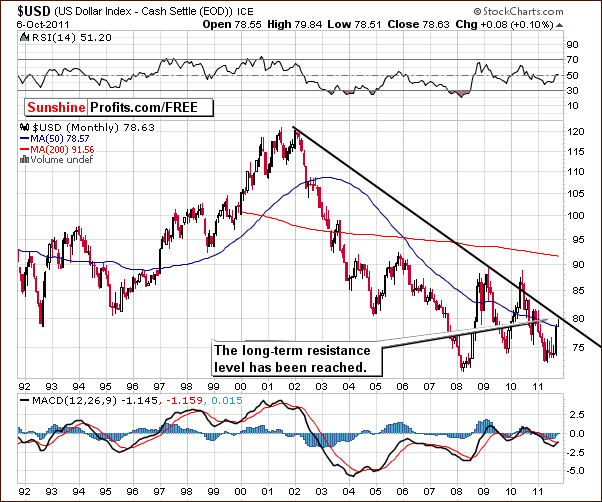
In the very long-term USD Index chart, we see that a bearish situation has developed at least for the short term. The long-term declining resistance level has been reached and at the same time index moved very close to the important 80 level that has provided support/resistance several times in the past. The long-term trend appears to be down and a quick decline is a possibility regardless of whether the resistance line is broken thereafter or not.
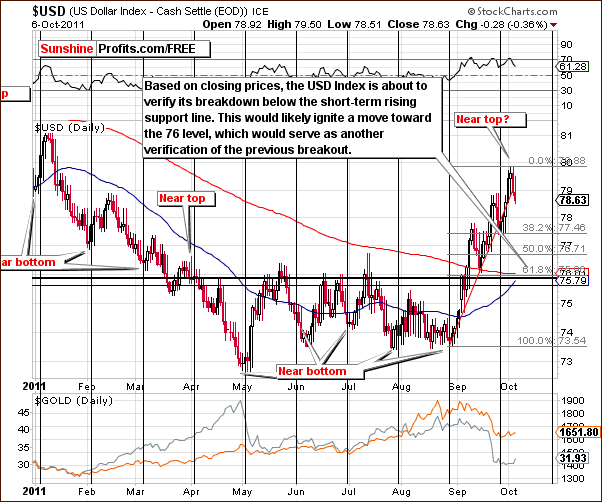
In the short-term USD Index chart this week, it appears that the index has reached a local top shortly after its cyclical turning point. Although index levels did not move lower this week, closing prices were at the low end of the day's trading range. The index has moved below its short-term rising support line and a verification of this move will likely result in further declines with a downside target level of 76.
Because gold and silver failed to move to new lows while the dollar was moving higher, we are seeing a positive divergence here and this is very bullish for the precious metals sector. More details on this topic will be further clarified in the following USD-Gold chart.
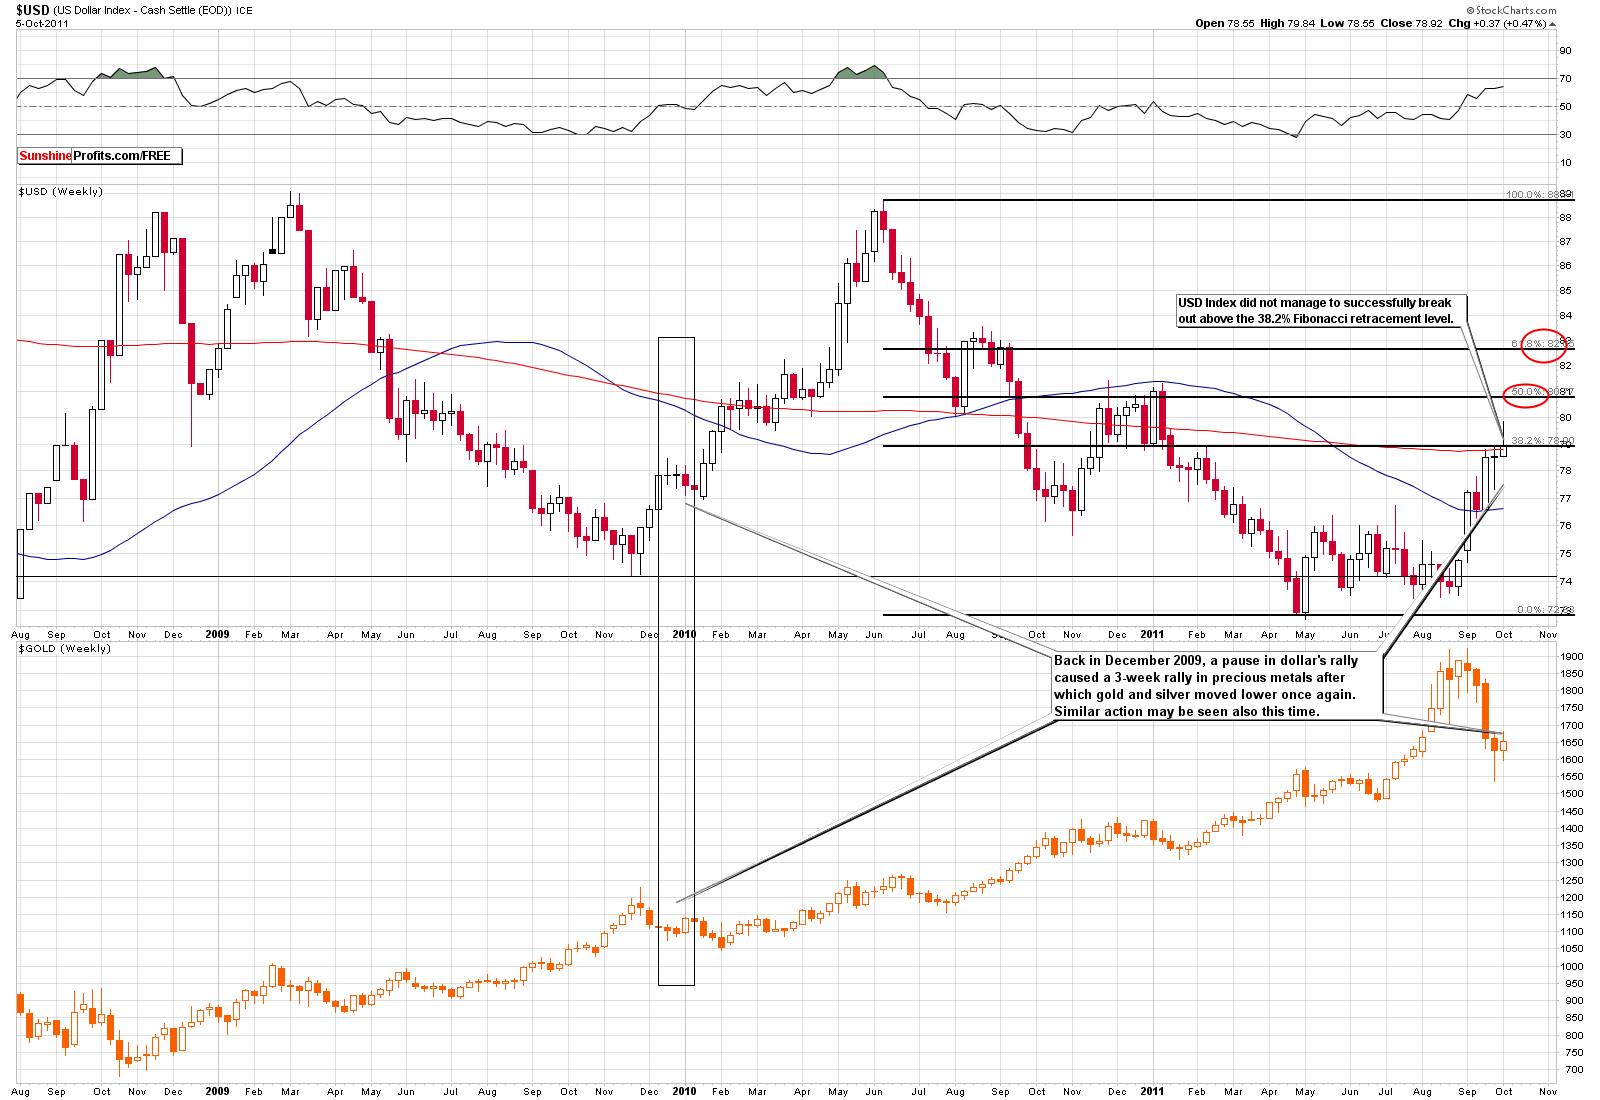
In the USD and Gold chart comparison (please click the above chart to enlarge), we see that this week's price action was similar to what was seen and discussed in last week's Premium Update. We stated that:
We expect to see a consolidation for the USD Index similar to what was seen late in 2009 and in early 2010. The correction was not very big at that time and it was quickly followed by higher index levels. A repetition of this trading pattern could ignite a rally in the precious metals sector much like what was seen late in 2009.
In the coming days, a pause in the USD Index with a decline possibly to follow will most probably have a positive influence on gold. The dollar moved temporarily above key resistance levels this week and then quickly reversed, thus invalidating the breakout. The move above the 38.2% Fibonacci retracement level has not been verified and a short-term decline is likely before the rally continues. This has bullish implications for gold.
Summing up, a decline in the USD Index appears to be in the cards and this has bullish implications for the entire precious metals sector.
General Stock Market
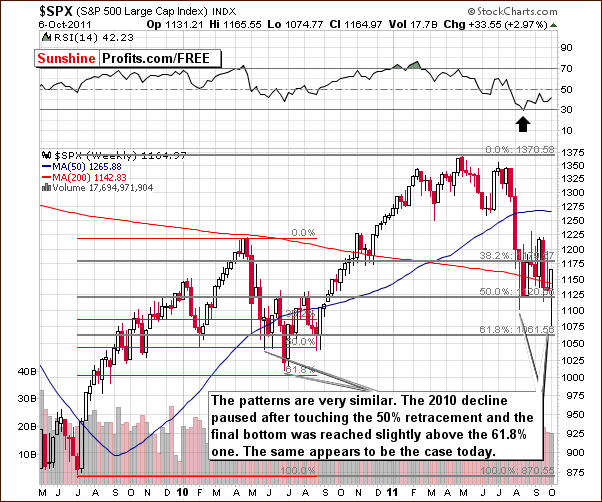
In the medium-term S&P 500 Index chart, we see what can be described as a self-similar pattern. Looking back at mid-2010, we see that the shape and size of declines in the index are very similar to where we are today.
Last year, the initial correction was to a point close to the 50% retracement level, and after a bounce back, the final bottom was seen slightly above the 61.8% retracement. It appears we may see this once again and if history is to repeat itself, we are likely to see significantly higher stock prices soon.
Another point worth mentioning is that unless stocks move below 1125 today (Friday), the weekly action will create a reversal hammer candlestick, which at the same time will be an invalidation of the early-week breakdown. The implications would be bullish.
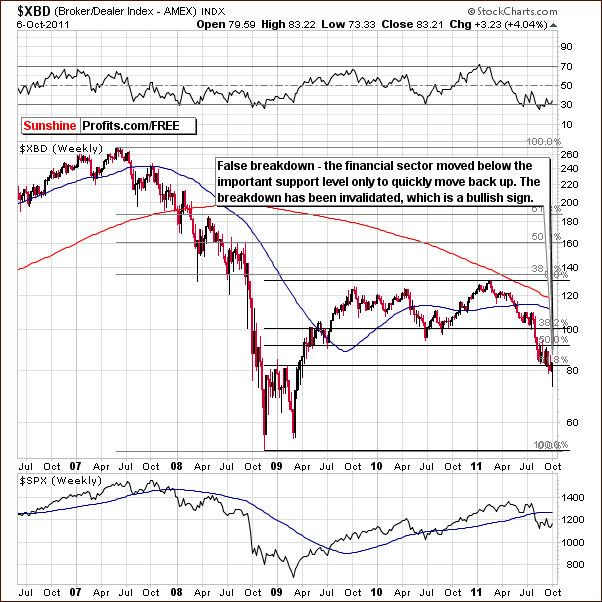
In the XBD Broker Dealer Index (proxy for the financial sector) chart this week, we see a confirmation of the bullish outlook for stocks. An early week decline back to an important support level close to 80 was followed by a quick reversal and the index has now moved above 83. Time will tell whether that was an invalidation of the breakdown or its verification (another move up would support the invalidation theory and a big move lower would confirm the invalidation one), however at this point the invalidation appears more likely to be the case.
Summing up, even though the week started off poorly with declining stock prices, the situation quickly reversed and the outlook is now bullish for the short term. In fact, based on the shape of the decline and its similarity to last year's pattern, the situation is more bullish than in the previous weeks.
Correlations
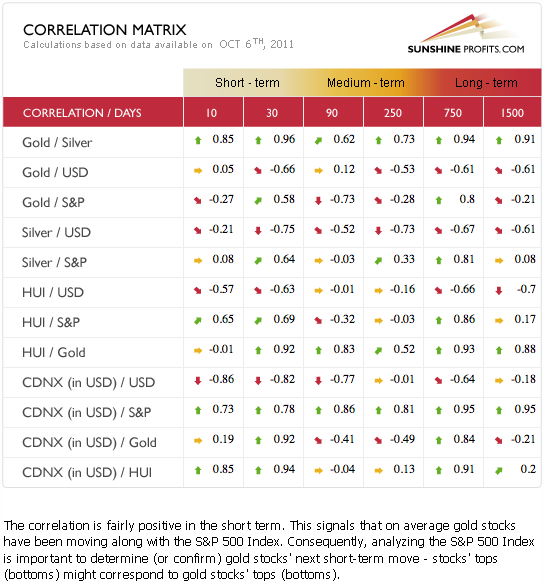
In this week's Correlation Matrix we see a return to the “normal situation” in the short-term (30 trading days) column.
The correlation coefficients are negative between the USD Index and the whole precious metals sector, thus confirming that a decline in USD would ignite a rally in the precious metals sector.
The situation is more interesting in case of the correlation coefficients between the main stock indices (here represented by the S&P 500) and the precious metals sector. In this case we see that the correlation is stronger (especially recently) in case of mining stocks, and not so strong in case of gold (silver being somewhere in the middle). Earlier this week we've seen a big drop in mining stocks and we received a few questions about the very weak (temporarily) performance of the mining stocks. The point is that they were general-stock-market-driven which used to be a bearish factor in the past weeks. The situation now appears to be changing in favor of stocks, so the influence on miners should also be positive in the following weeks. We will move to this topic once again in the following part of this update.
Gold
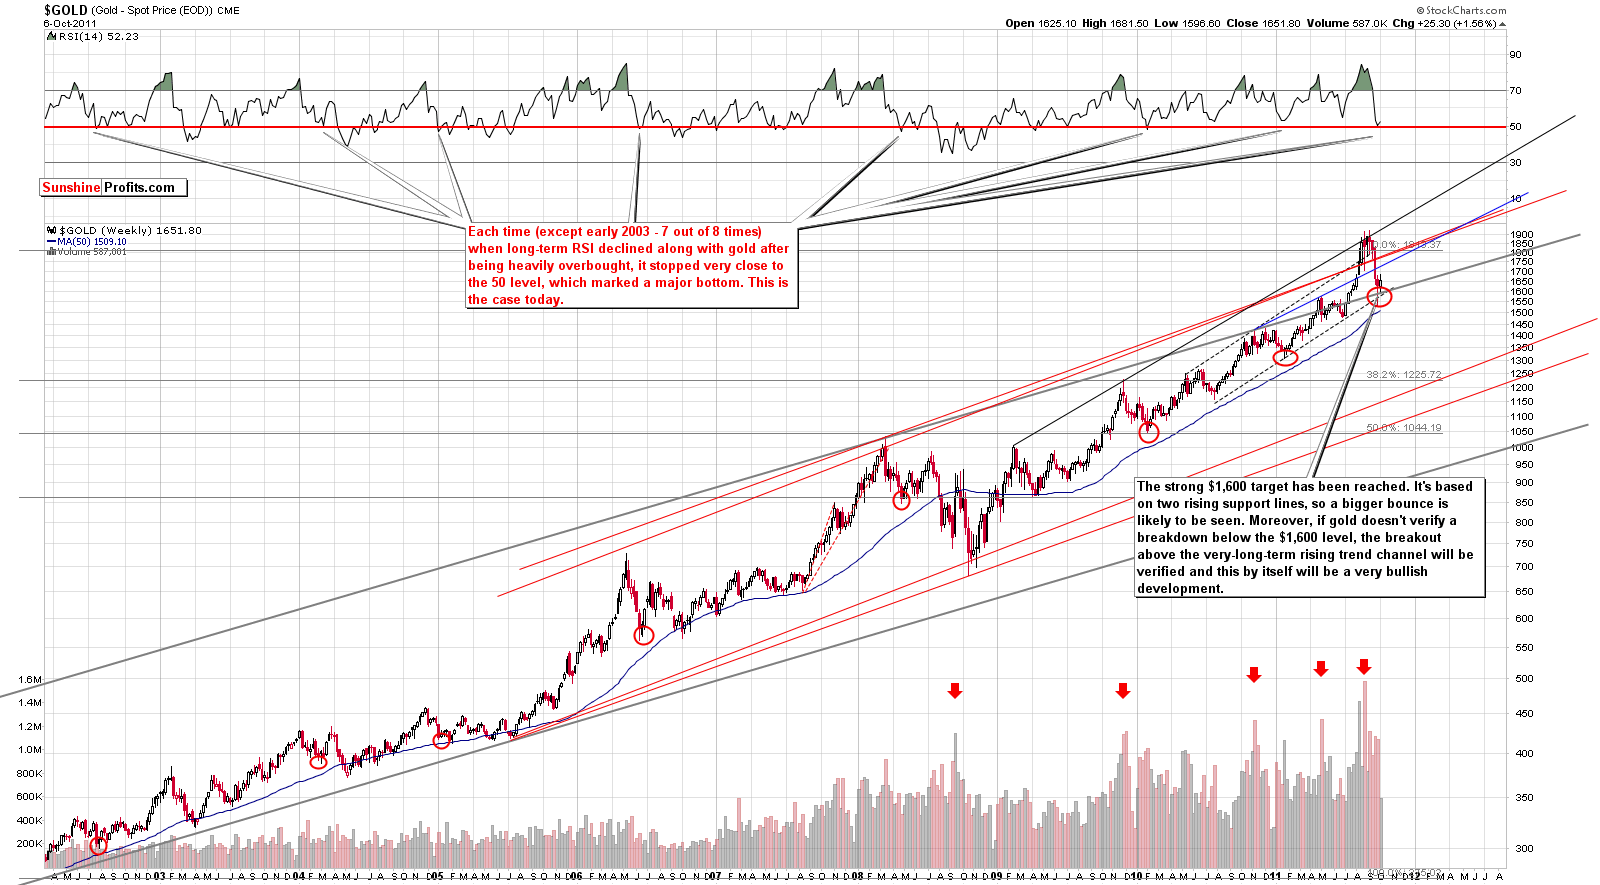
We begin this week's gold section with a look at the very long-term chart (please click the above chart to enlarge). The week began with sharp declines in gold prices but prices soon reversed and rallied strongly later in the week. RSI levels also moved slightly higher.
The early week declines tested the support level and since it held, the situation remains bullish. Actually, since there have now been two verifications of this support level, the situation is slightly more bullish than it was before. Other than the decline and subsequent bounce, little else has changed in the gold market this week.
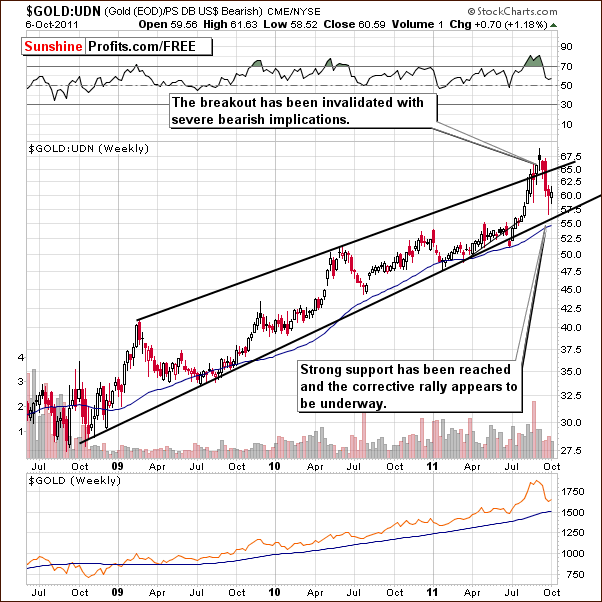
In this week's long-term chart for gold from a non-USD perspective, index levels did not decline significantly early in the week although gold's price did. This is due to the early week rally in the USD Index, which pretty much canceled out the decline from a non-USD perspective. The recent breakout here has been invalidated and with a strong support in place, the index is likely to rally from here.
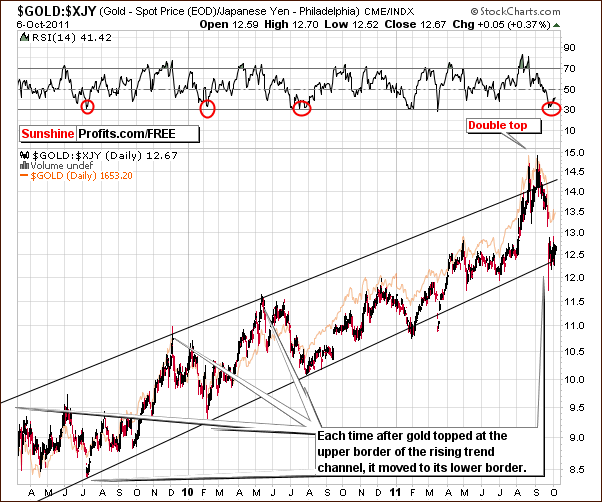
Looking at gold from the perspective of the Japanese yen, we see the usual price action along the lower border of the trading channel of the chart. It appears that a rally is ahead and the only question appears to be whether the index will move to the mid-channel range or to the upper border of the trading channel. There appears to be about a 50-50 likelihood of either move at this point.
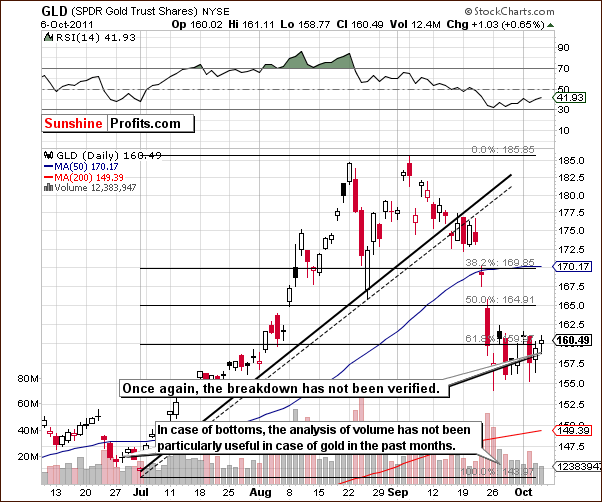
In the short-term GLD ETF chart this week, once again we see another attempt to move significantly below the 61.8% Fibonacci retracement level. A quick reversal invalidated the breakdown and prices are now back above the 61.8% Fibonacci retracement level. While volume levels during daily upswings have not been significant, this is generally not of concern near market bottoms. It is however, an important factor for local tops in the GLD ETF.
Summing up, the situation remains bullish for the yellow metal although there were some scary moments earlier in the week. It appears that we have been through a slight period of price correction and the outlook from here is bullish.
Silver
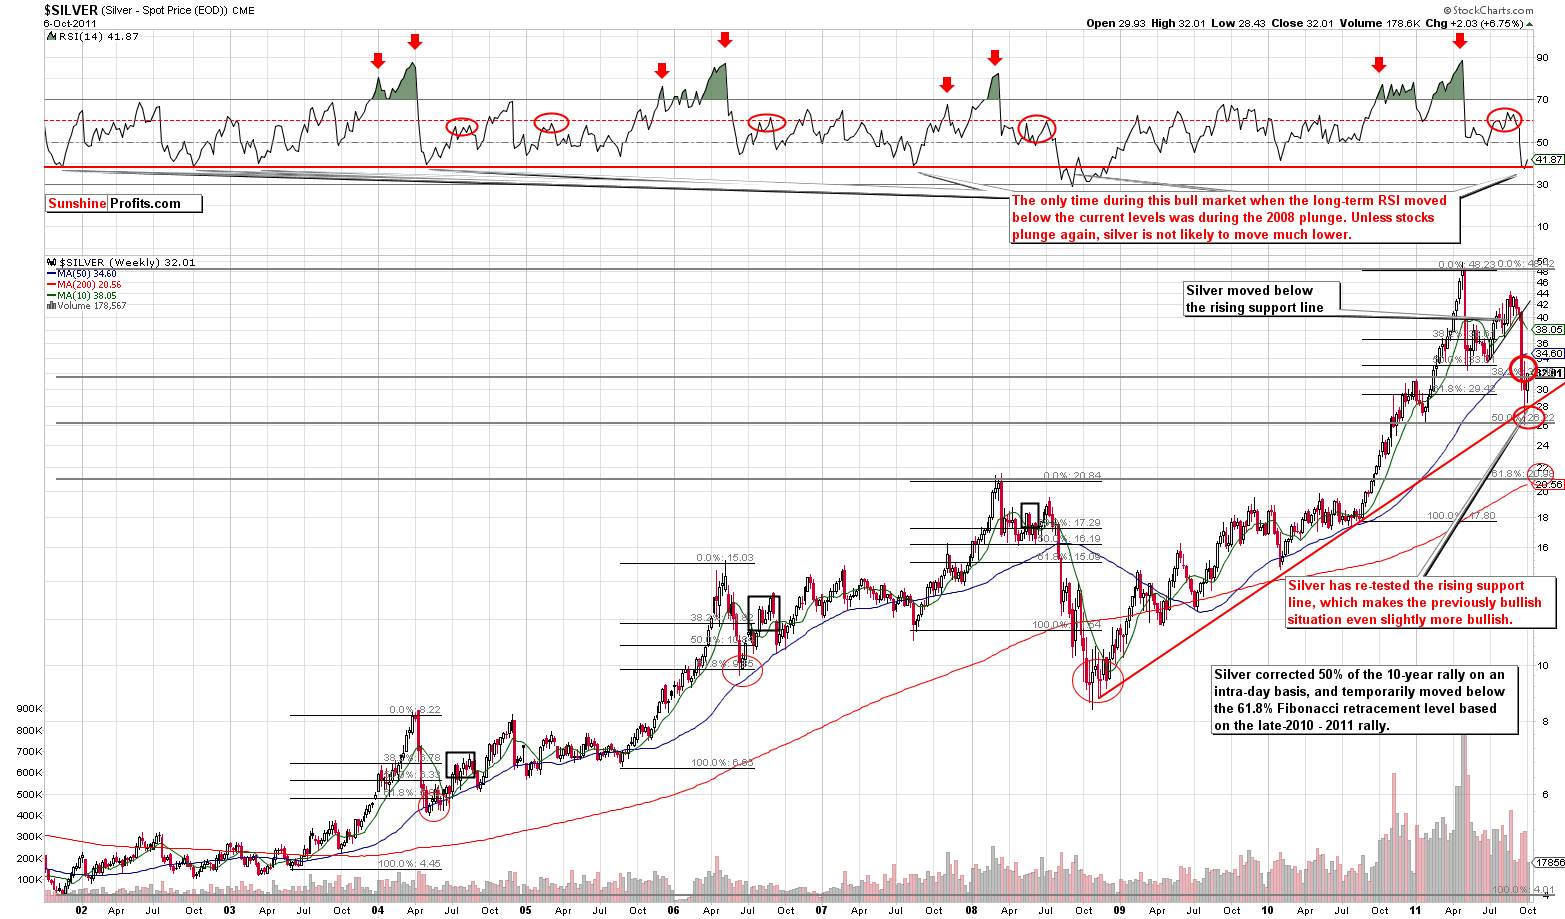
In this week's long term chart for silver (please click the above chart to enlarge), we see a situation quite similar to what was previously discussed for gold. Another verification of an important support line has been seen as the red rising support line in our chart was retested. Prices then moved slightly higher as did RSI levels. It appears that this will continue and the outlook is therefore bullish.

In the short-term SLV ETF chart this week, we are right at the cyclical turning point. With prices having declined recently, it appears that the bounce to the upside that has just started could very well be the beginning of a rally with a likely initial (!) target level of $34. This appears valid based on the 20-day moving average which is now in play. By “initial” above we mean that silver may rally much higher, but it may pause close to this level. Unless it is accompanied by some significantly bearish events, we will not view this level being reached as a topping signal.
Summing up, the outlook for silver is also bullish as a rally appears quite likely following the cyclical turning point now at hand. This is further supported by points made earlier and supported by our currency and stock market charts.
Platinum
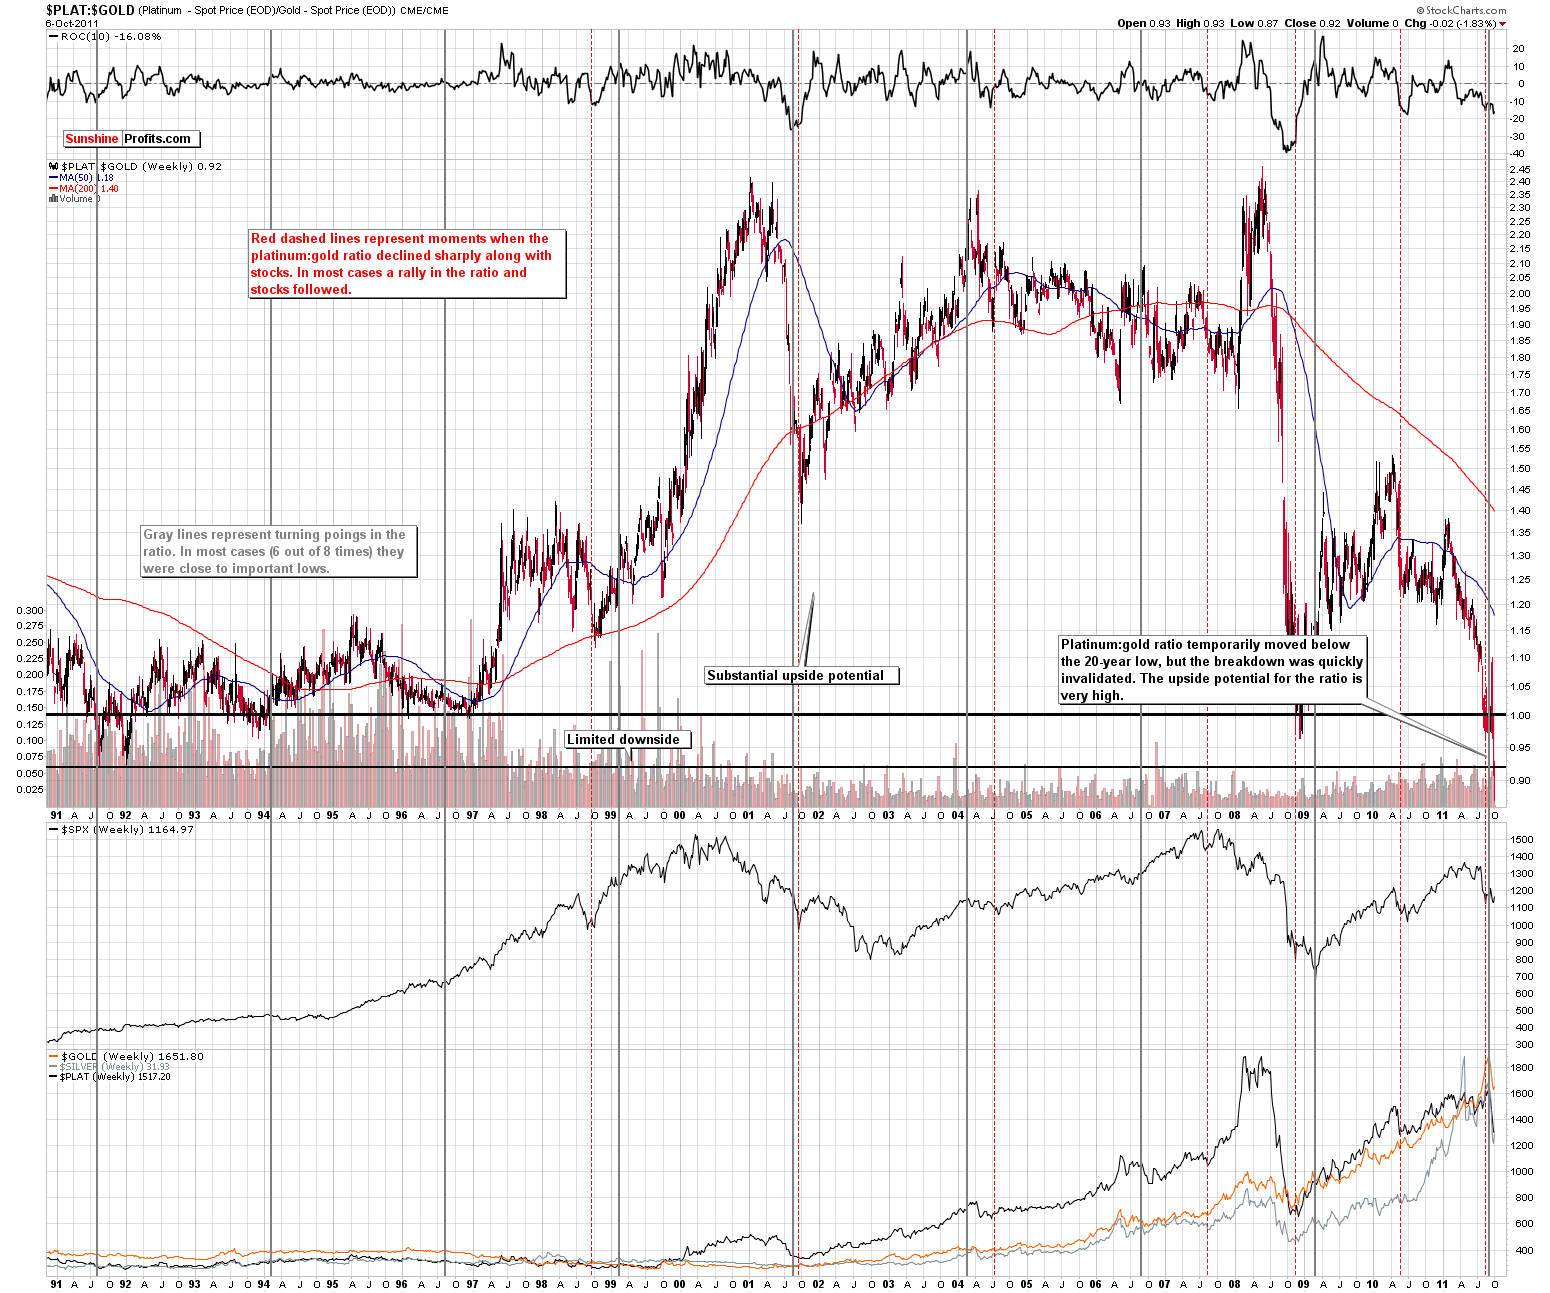
In the platinum to gold ratio chart (please click on the chart to enlarge it), we see that a recent move brought the ratio below its 20-year low and was followed by a quick reversal to the upside. This invalidated the breakdown of the ratio and the outlook is bullish. The upside potential here is very high especially when compared to the apparent low risk of further declines.
Gold and Silver Mining Stocks
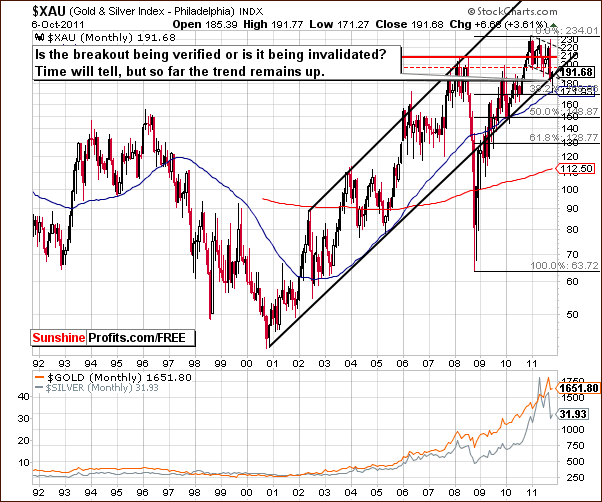
This week's very long-term XAU Gold and Silver Index moved sharply lower early in the week to a level below the long-term rising trend channel. The 38.2% Fibonacci retracement level based on the 2008-2010 rally has been reached and this coincides with the 50-week moving average as well.
With these two support lines in play, it seems that gold, silver and gold and silver mining stocks will likely rally, especially that the XAU Index is now once again slightly above its rising support line. The recent breakout could be confirmed or invalidated in the days ahead. The bullish confirmation of the recent breakout appears more likely, though.
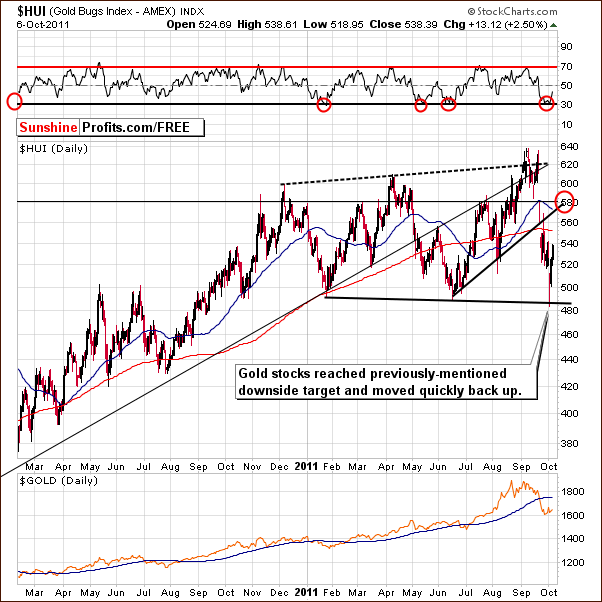
In this week's long-term HUI Index chart, gold stocks are seen to have reached the lower target level we mentioned in the September 16th, 2011 Premium Update, close to the 500 level. A very quick reversal has been seen in the past few days and the upside target level appears to be around 580. The previous bottom was also confirmed by RSI levels. The outlook appears bullish from here.
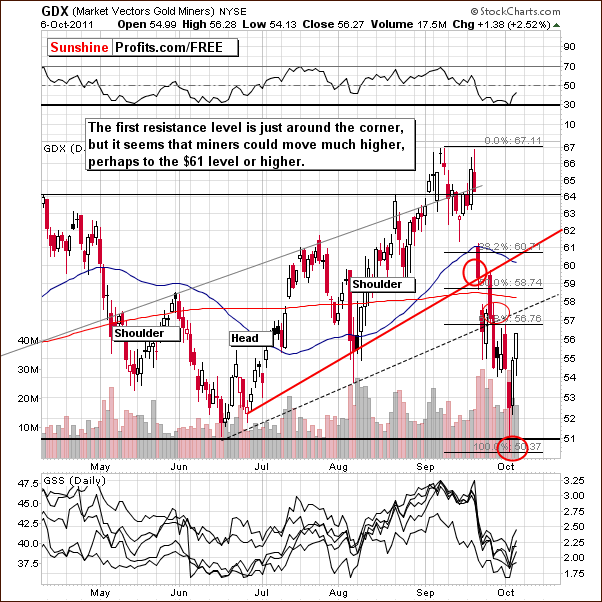
The short-term GDX ETF chart shows similar price action this week. A few resistance lines are being approached at this time and the closest is around $57. It appears that this initial resistance will be broken and a likely upside target level of $60.70 seems more reasonable.
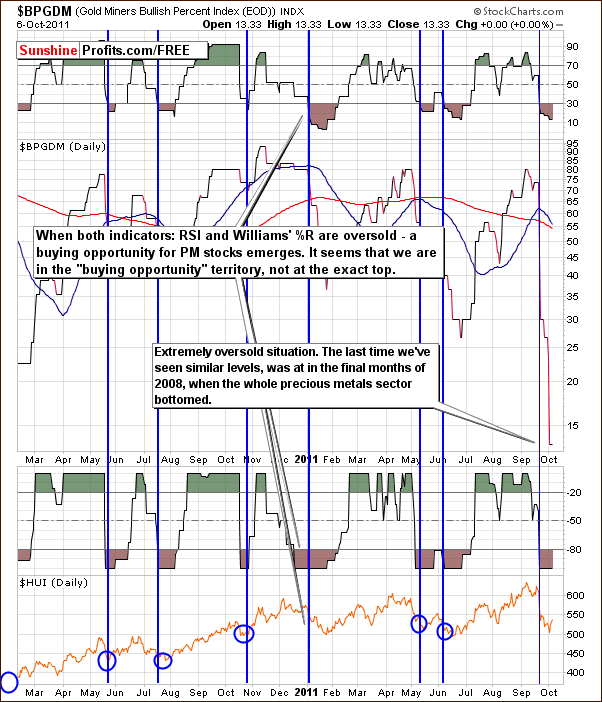
In this week's Gold Miner's Bullish Percent Index chart, index values moved lower again this week. Recall that in last week's Premium Update, we stated the following:
When both the RSI level and Williams' %R are oversold, a buying opportunity presents itself. This was indicated a few days ago and a look to the past shows that this tool is quite reliable.
With the extremely oversold conditions now present, all signs point to a very bullish period ahead. In fact, the current index levels here have not been seen since the end of 2008 when the whole precious metals sector had reached a major bottom. This bullish outlook is consistent with the signals given by nearly all of this week's charts and analyses.
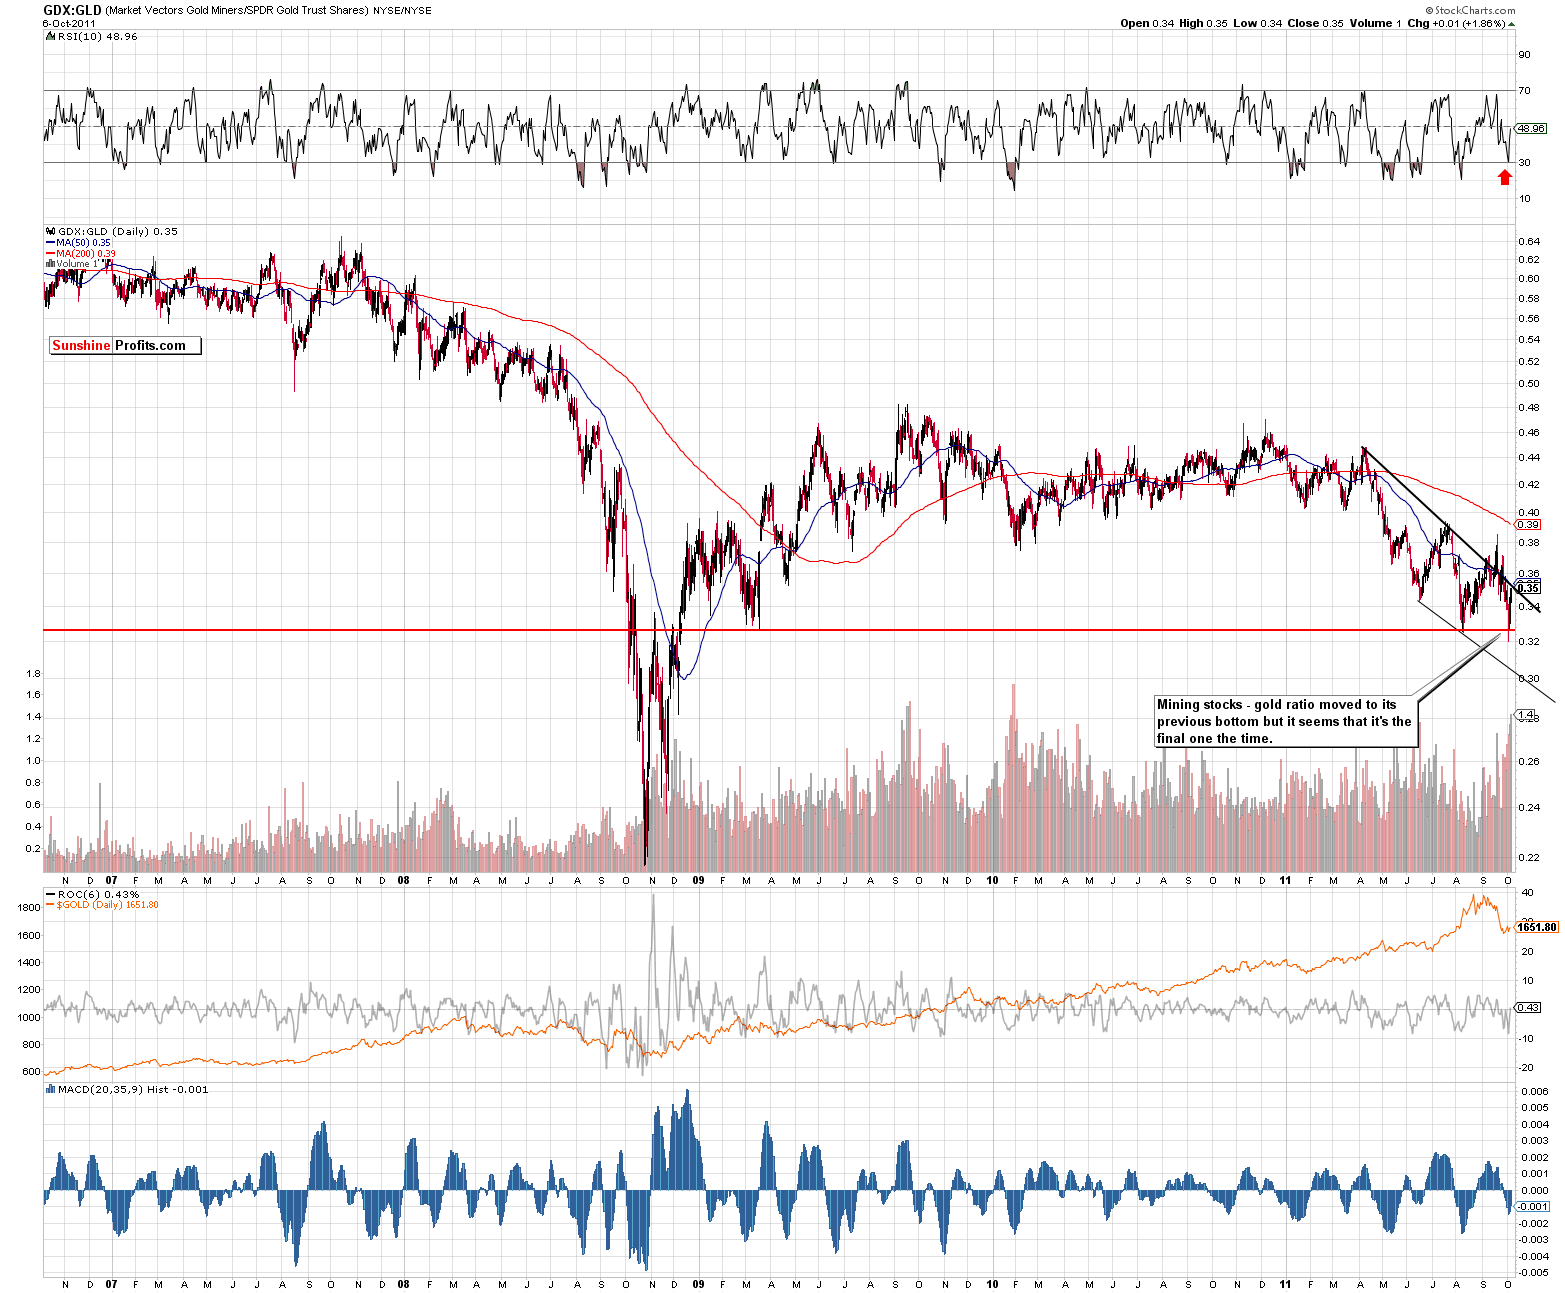
In the GDX:GLD ratio chart (click on the chart to enlarge it) this week, we can see how the miners performed against gold. This week, the ratio touched and moved to the previous lows and quickly bounced back. In fact, we mentioned the 0.31-0.32 as the possible target for this ratio in the September 16h, 2011 Premium Update. It was not likely recently, however a decline to this particular level followed by a rebound is not something overly surprising.
The mining stocks have been on an extremely scary and volatile ride of late but their recent price action has not been a complete surprise. Although we would not say this was a most likely option, it was one which we knew was possible. Now that the support level has been reached, the odds of a subsequent rally are likely increased once the ratio breaks out above the declining trend channel and the move is verified. The situation therefore appears to be quite bullish at this time.
Summing up, the situation in mining stocks has become bullish and it appears that higher prices will likely be seen very soon.
Letters from Subscribers
Q: A German poll over the weekend shows more than 70% of Germans oppose any more transfer of German wealth to nations with debt problems. I have read a report that there is a good chance that Germany might leave the euro and go back to the Deutsche Mark in the near future. What is your take on this?
A: Overall, we agree with author's main point that "the world is about to experience deeper stagflation". However, we doubt that one of the first steps in that direction will be Germany stepping out of the Eurozone and at the same time encouraging other countries to continue using euro as currency.
That action - in our view - would ignite a massive drop in the value of euro, possibly resulting in the immediate destruction of the currency, not to mention the immense economic turbulence in Europe that would shortly follow. The cost of this financial, economic and political havoc would be much more than the cost of a solution in which the euro depreciates over time, and we think that Europe will strive for this solution (if one can call inflation or hyperinflation "a solution"). Will the euro survive at all (for more than 5 years)? Time will tell - we give it about 40% probability.
Summary
The situation in the USD Index appears to be negative for the short term, and conversely, the euro is showing first signs of strength. The currency market influences will likely be positive upon the precious metals at least for the short term.
The outlook for the general stock market is bullish and this is somewhat confirmed by the financial sector as well. It seems likely that the price action ahead will continue to reflect what was seen in mid-2010 and higher stock prices appear to be in the cards.
The precious metals sector appears destined for higher prices as well. The influence of the currency markets and the general stock market will likely be positive, at least for the short term. The charts for gold, silver and the gold and silver mining stocks have confirmed this as all are pointing to higher metals prices in the weeks ahead. The same is the case with silver's current cyclical turning point.
Last week, there were many signals from our indicators which are still in play. This keeps us bullish on precious metals for the short- and long term at this time. The strength of the influence of the USD Index is significant and has a highly negative correlation with the precious metals sector. The stock market is positively correlated with metals and will likely lead them higher.
We will continue to monitor these currency, stock, and precious metals markets and keep you abreast of all significant developments in the coming days.
Our next Premium Update is scheduled for Friday, October 14, 2011.
This completes this week's Premium Update.
Thank you for using the Premium Service. Have a great weekend and profitable week!
Przemyslaw Radomski

