
It must be amazing to wake up in the morning and know that what you utter that day will move markets. Ben Bernanke sent a strong signal this week that despite weaker economic data, the US Federal Reserve is not planning to loosen monetary policy. He said that the recovery “appears to be proceeding at a moderate pace”, in other words, no QE3, at least not for now. Wall Street turned south, the 10-year Treasury yield eased back under 3 per cent and gold futures fell.
In the last Premium Update, before we knew what Bernanke planned to say, we said that it was a good idea to close long speculative positions in gold.
The risk/reward ratio is no longer favorable for speculative long positions in gold. It is possible that the current contra-trend rally could continue for a few days or so but we believe it is not worth betting on at this time.
We heard this on the Jay Leno show this week: “President Obama said today he's not concerned about a double-dip recession. He's more concerned the recovery we're in is not creating enough jobs. In fact, do you know what you call a recovery that isn't creating enough jobs? A recession.
Mark your calendars. On June 30th the Fed will end its second round of quantitative easing, the money supply will tighten. It is the flood of money pumped out by the Fed that has propped up the stock market for the past three years. What will happen when the dollar pump shuts off? It seems plain common sense that the stock markets will go down. It also makes sense that when markets will plummet to where it really hurts; the politicians will demand a new round of QE. We find it difficult, if not impossible to believe that there will not be QE3 in the future.
Keep in mind that more than 60 per cent of the Treasury debt held by the public will mature within four years. This means that over the next four years the U.S. Treasury must either repay or refinance more than $1 trillion in existing debt each year. (This is without taking into consideration additional deficit spending of at least $1.5 trillion.) The U.S. will have to double the amount of Treasury bonds from the level currently.
Certainly the Fed cannot allow the Treasury's borrowing costs to increase or the dollar to strengthen. These are just some of reasons we believe that QE3 is on the horizon.
Much of Bernanke’s speech was dedicated to inflation and commodity prices. He tried to make the point that commodity prices are unlikely to continue rising and that the rise to date was not due to the Fed’s loose monetary policy.
Meanwhile the data for May are beginning to arrive and are even worse than April's. They are marked by a collapse in payroll-employment gains; a higher unemployment rate; manufacturers' reports of slower orders and production; weak chain-store sales; and a sharp drop in consumer confidence.
So for all the Keynesian quantitative easing we got a bigger deficit without economic growth.
The U.S. is the world's largest debtor. As a whole, Americans owe a total of nearly $56 trillion (almost 400% of GDP). That's federal, state, municipal, corporate, and private (mortgages and student loans) debts. The debt service on the total obligation is $3.6 trillion a year. This is roughly the same amount of money as the federal government's entire budget. When the U.S. government reports its debt, it does not include payment that it is required to make to seniors, veterans and retired employee. If those were included, the US debt would be far a larger number than the already humongous number the government does publish.
An important point to keep in mind is that for the last nine months the Fed has been purchasing 70% of all the debt issued by the U.S. Treasury. What will happen when the Fed stops buying? That’s a no brainer—prices of treasuries will fall and benchmark interest rates will rise. On the one hand it is likely that the price of gold will fall because of rising interest rates, but on the other hand, it could rise as fear sends investors to look for a safe haven even if it does not pay interest. Bill Gross, who runs the world's largest bond fund, is shorting U.S. government debt. Need we say more?
It’s only a matter of time before the Fed will have to turn on the presses again sending a message to America’s creditors that they will be repaid in devalued fiat currency. All around the world, more and more central banks are selling dollars and buying gold. Apparently they have come to the conclusion that U.S. credit is not that reliable and that the value of the dollar is likely to decline. We have come to that conclusion long ago and have been recommending long-term positions in precious metals.
In past newsletters we have made it no secret that our view is more in line with the Austrian view of economics than the Keynesian. The Austrians believe that the best thing for the Fed and government to do during a slump is to get out of the way. The following is from a recent Ludwig Von Mises Institute article:
Let interest rates signal the actual state of savings and investment demand, and let prices — including the price of labor — fall in order to clear markets. Malinvestments were made during the boom years, and they need to be liquidated. People who made entrepreneurial errors need to suffer the consequences of those decisions. If the politicians really want to "do something," they should cut spending and taxes, returning those resources back to the private sector, which is already on the ropes.
In desperate times it’s good to hold physical gold and silver.
Speaking of desperate times, we read an article in The New York Times about Iraqi men so desperate that they spend their days scrounging the Bagdad sewer system for flakes of gold.
Several times a month, the men descend as far as 15 feet into the dark to search for gold bits that have been washed down the drain by craftsmen cleaning up after a day of etching and molding jewelry. Holding a flashlight and wearing a mask to help cover the stench, they comb through the thick muck, reaching in with their bare hands to pluck out glints of gold. On a good day, the men say they collect enough to earn about $20. Talk about trickle-down economics. This is as sad as a story we read about women in India who sweep the streets near the gold shops hoping to gather enough gold dust to be able to feed their family.
Meanwhile, we were informed that some silver buyers are willing to pay approximately $7 over the spot price for Silver Eagles and Canadian Maple Leafs for immediate delivery. The investment demand is clearly strong from individual (small) buyers, but does it mean that markets will move up soon? Let’s move to this week’s chart analysis to find out more. We will begin this technical part with the analysis of the Euro Index. We will start with the long-term chart (charts courtesy by http://stockcharts.com.)
Euro - USD Indices
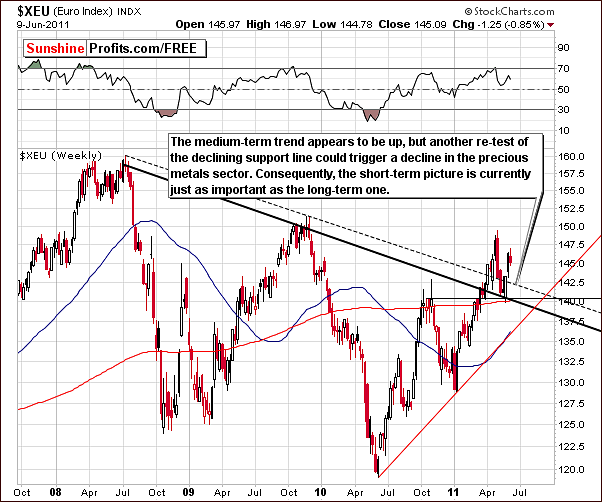
We begin this week with the long-term Euro Index chart where we have seen a continuation of the trend to higher index levels. However, based on the price action seen in current week, there may be a slight pause underway which perhaps will be followed by a retest of the declining support line. A move below this level could be followed by additional declines to yet another support level.
The implications for gold, silver and gold and silver mining stocks are the same as was seen in previous declines of the Euro Index where the precious metals sector generally declined as well. It is important at this time for all precious metals Investors to keep an eye on the decline of the euro for these reasons.
Additional implication is that currently the analysis of the short-term chart (below) is just no less important than the analysis of the long-term one (above).
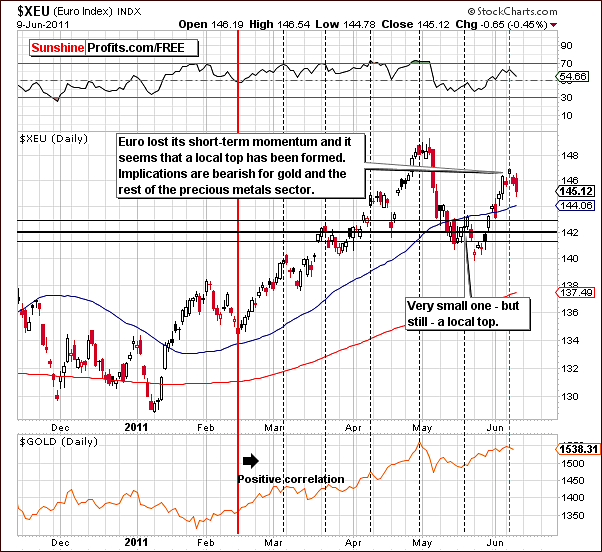
In this week’s short-term Euro Index chart, we can clearly see the important short-term cycles which generally have had profound impacts not only upon currencies but also upon gold. The chart suggests that the local top was in a few days ago and this will likely lead to lower Euro Index levels and lower gold prices in the days ahead. Note that these short-term cyclical tendencies have been particularly reliable on a short-term basis, but if we are, in fact, on the verge of a bigger downward move, this could very well be the trigger for it.
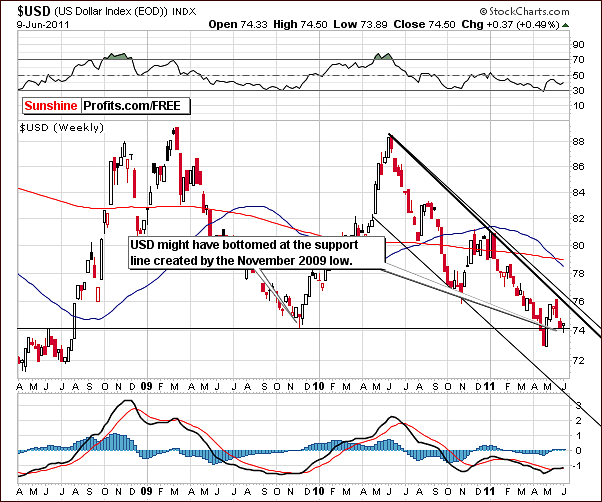
In this week’s long-term USD Index chart, we see that index levels recently moved below the 2009 lows and then reversed direction. It is possible that we could see a local bottom at or near Thursday’s closing level as there is a support line here created by the 2009 November low.
Fundamentally speaking, the situation favors a short-term rally. The markets are digesting news that we won’t see QE3 soon and that the supply of the USD will be at least somewhat limited. On the other hand problems within the EU make many market participants believe that EU will monetize its debt either directly or indirectly (without calling it such). Combining these two points provides us with a short- / medium-term bullish picture for the USD Index (recall that the EUR:USD exchange rate is the most important part of the USD Index).
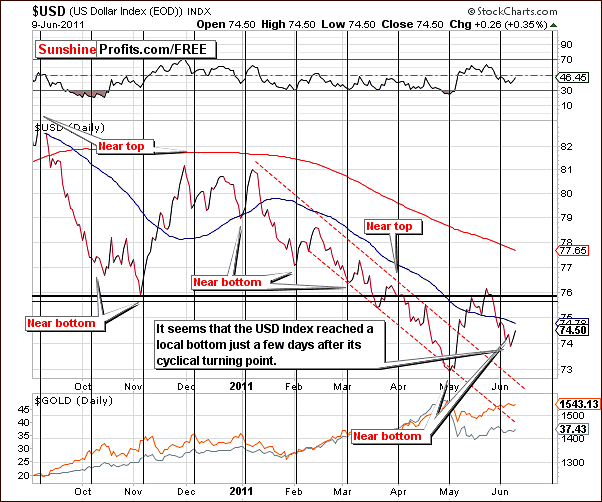
In the short-term USD Index chart, we see the cyclical turning points, which are represented by the vertical lines in our chart. It’s important to note here that these have medium-term magnitude with respect to index level trends. Presently, the USD Index is close to a local bottom and this is consistent with points made earlier.
The USD Index is therefore likely to move higher from here. It is unclear at this time whether the level of previous highs will be reached and/or surpassed (based on the strong support in Euro). Whatever the situation, generally speaking, higher USD Index values will likely have a negative impact upon gold, silver and gold and silver mining stocks and the signals from this chart also support this short-term outlook.
Summing up, the risk of higher USD Index levels is quite significant and would impact the precious metals sector in a negative way. It appears that this is a factor that must be watched closely in the days ahead and caution is warranted with respect to speculative long positions anywhere in the precious metals sector.
General Stock Market
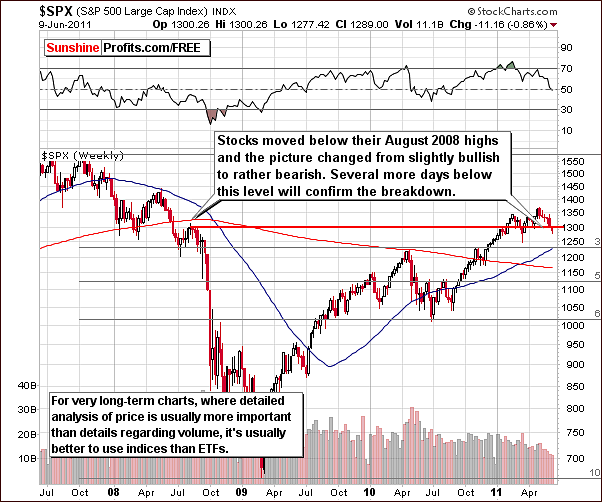
In the long-term general stock market chart this week, we have seen a decisive move downward. Stocks are now below the level of the August, 2008 highs and the outlook has quickly changed from slightly bullish to rather bearish. If price levels remain down for a few more days, this breakdown will be verified and the sentiment will then be even more bearish.
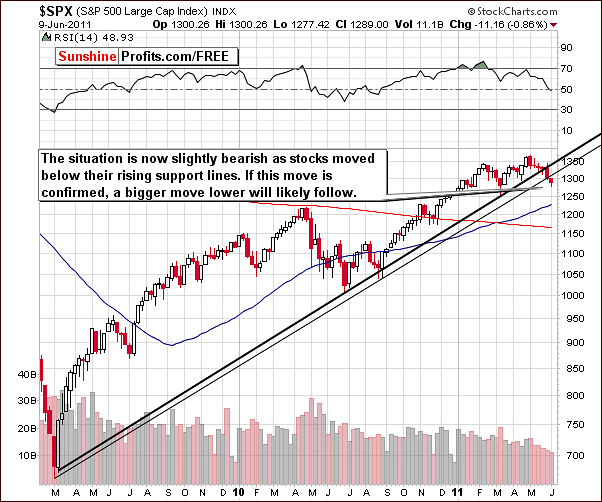
In the medium-term S&P 500 chart this week, we see that stocks are presently below both rising medium-term support lines. The first breakdown has been verified and the second could be verified although this has not yet been seen. Such a verification of a second breakdown (not moving back above the support/resistance lines in the following days) will clearly be a bearish development and will probably lead to even lower stock prices soon thereafter.
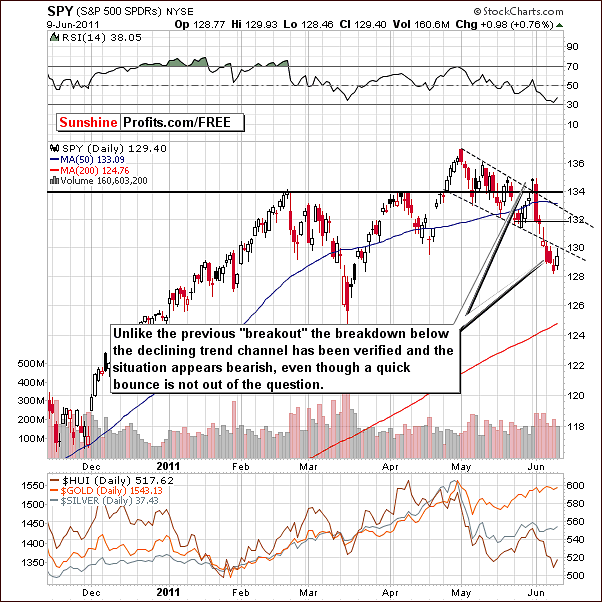
In this week’s short-term chart, the situation also appears bearish. The key bearish point is that the breakdown below the declining trend channel has been verified (unlike the previous breakout) on Thursday as price moved back to its lower border and then declined once again.
Therefore, stocks are quite likely to decline from here although higher prices could be seen for a day or two. This does not appear to be worth betting on however.
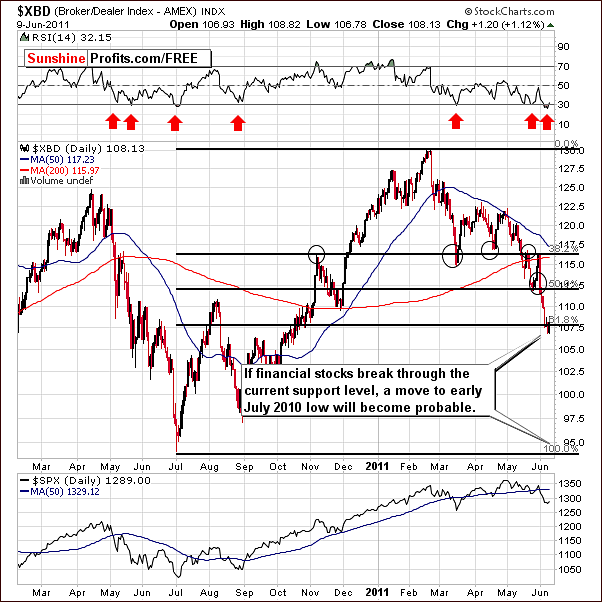
Once again we have included the chart featuring the XBD Broker-Dealer Index and this week we see that the financials have moved to yet another support level.
On a side note, for some time now, this index has shown how perfectly support and resistance levels created by Fibonacci retracement levels can work. In the past few weeks we’ve seen turnarounds at 38.2% and 50% retracements.
Presently a support level (61.8% retracement) has been reached and the RSI level suggests that a temporary turnaround is likely. This was seen several weeks ago (in late May) and could be seen once again but – like back then – could be followed by a continuation of the decline. The next support level corresponds to the level of 2010 lows and is more than 10% below current index levels. Naturally, this would have negative implications for the whole general stock market.
Summing up, the situation in the stock market is now rather bearish and the longer stocks remain down, the more bearish the outlook becomes as breakdowns become verified. A move higher above key resistance levels on strong volume is needed to change the outlook from its present bearish manifestation.
Correlation Matrix
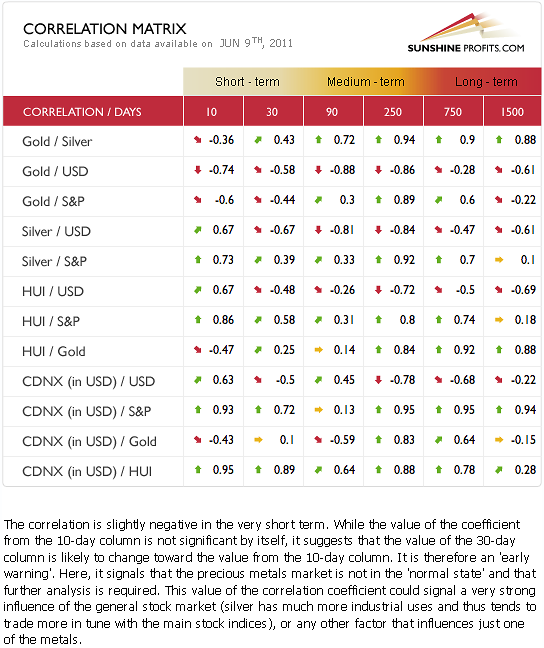
In this week’s Correlation Matrix, we see that the dollar is negatively correlated with gold, silver and gold and silver mining stocks in the short term. With the situation currently bullish for the USD Index the implications are bearish for the precious metals sector.
In the 90-day medium-term column, we see a rather weak correlation between stocks and precious metals. The 250-day column however, shows very strong positive correlations, which indicates major medium-term moves. With the medium-term outlook bearish for stocks in general, the impact on the precious metals sector makes the medium-term situation in gold, silver and mining stocks rather bearish as well.
One final point is noted here with respect to the 10-day column in our matrix. In the past 2 weeks gold and silver have been on average moving in opposite directions, which is something very unusual that suggests caution. Silver and gold are showing an opposite correlation with stocks. Silver has been moving with the general stock market (positive correlation) while gold has been moving in the opposite direction (negative correlation). This is likely due to silver’s industrial uses, which appear to be strongly influencing silver’s current price trends. It is unusual to see the yellow and white metals move in opposite directions but such is the case today.
Summing up, the situation in currencies and stocks does not bode well for Gold and Silver Bulls. Let’s take a look at the metals themselves to check if the situation really is that bad as the above analysis might suggest.
Gold
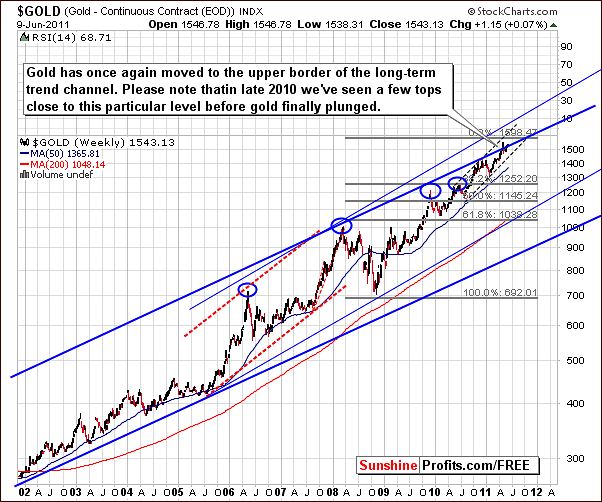
In the very long-term chart for gold this week, very little has changed and we have seen yet another attempt to move above the rising trend channel. This will probably not succeed and will likely be quite similar to what was seen in late 2010. At that time, a period of sideways price movement near the upper border of the trading channel was followed by declining prices.
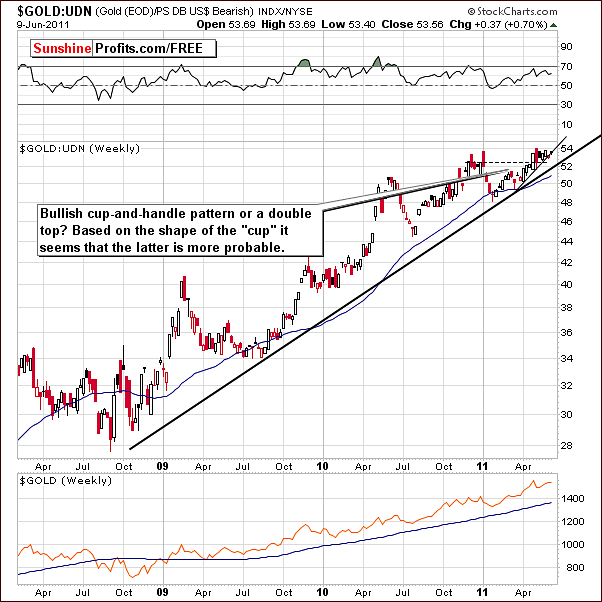
In gold’s long-term chart from a non-USD perspective, recall that last week in our Premium Update June 2nd, 2011 we mentioned the possibility of a cup-and-handle pattern formation. Now – given other charts mentioned this week, and also the ones that will follow - it seems more probable that the recent move up was actually a double top rather than the cup-and-handle pattern.
This chart is neutral at best this week. Please note that Thursday’s rally was necessary just to keep gold above its short-term support line. If a breakdown below this level is seen and verified, the subsequent decline could be significant.
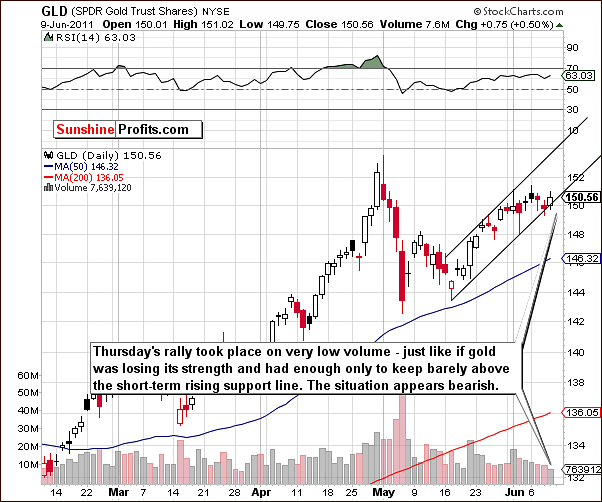
In this week’s short term GLD ETF chart, we see that gold has moved rather insignificantly higher in the past week. On Thursday, gold’s price moved up 0.5% on very low volume. This very low volume during a rally normally indicates that buying power is drying up. It seems that this interpretation is correct at this time, as it’s being seen after a few-week rally. It could be a sign that many will be exiting the market soon which will lead to lower prices.
We have seen no evidence of a strong bounce from the support line now in play. There was a rather weak attempt with insignificant success to move higher. It does not appear that prices will hold within the rising trend channel with insignificant buying power and it seems that this contra-trend rally is coming to an end. Please note that another move up on low volume would be a bearish signal, not a bullish one.
Summing up, the outlook overall is bearish for gold with numerous signs pointing to lower prices and few, if any which could be read as signs to the contrary.
Silver
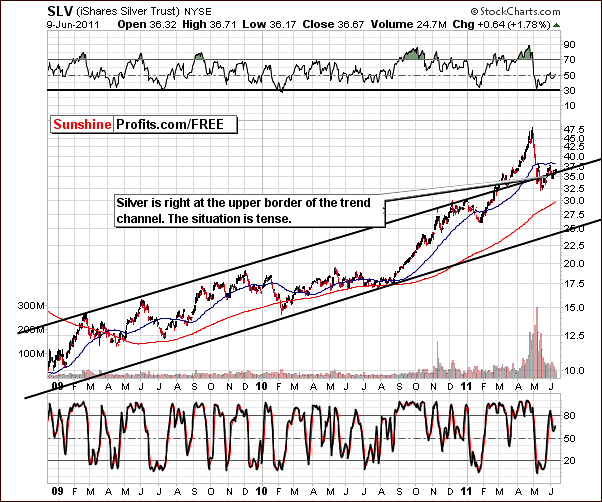
In this week’s medium-term chart for silver, the medium-term support/resistance line is very much in play. The situation remains tense and it seems that whichever way silver’s price breaks from here is likely to be followed by a serious move in that direction. The likely scenario is for prices to decline.
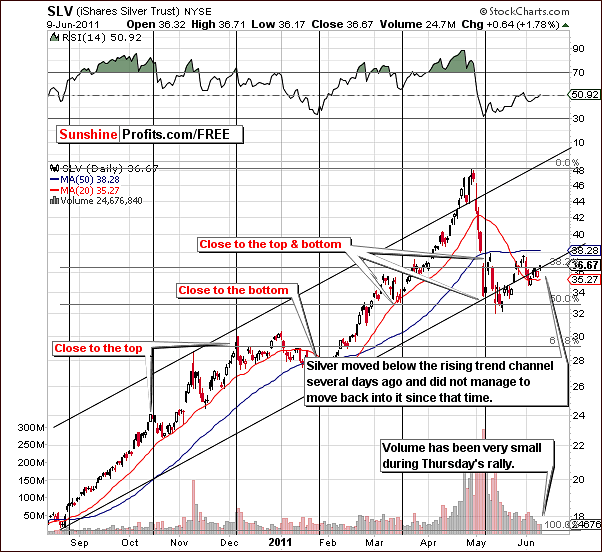
In the short-term SLV ETF chart this week, we see silver’s price currently at the 38.2% Fibonacci retracement level based on the September-May rally. This coincides with the lower border of the rising trend channel. The white metal’s price moved below the channel and failed to move back into it. As these attempts continued, volume levels declined. It appears that the bulls are running out of strength at this point and Thursday’s low volume level supports this statement. Lower prices are quite probable in the short term at least.
Summing up, the signals for silver are consistent for what has been seen for gold and the bearish outlook here confirms the view for the entire precious metals sector thus far.
Gold and Silver Mining Stocks
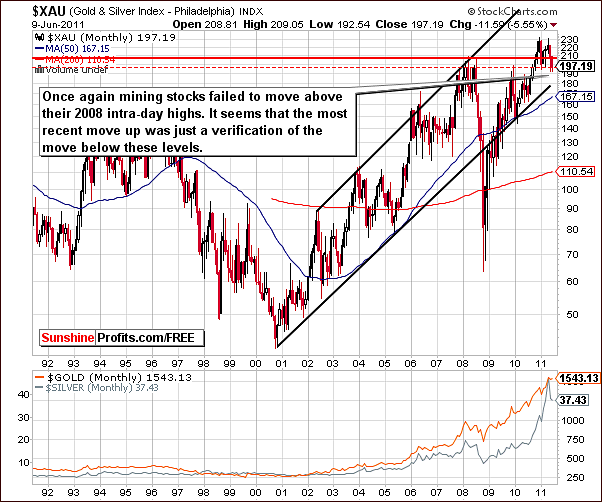
In the very long-term XAU gold and silver mining stocks index chart this week, we see a move below the level of the 2008 intra-day highs down to the level of monthly closing prices. It appears that the previous upswing was just a verification of the breakdown below the 2008 intra-day highs. Since May index levels have declined, moved back to the level of 2008 highs after having bottomed at highs based on monthly closing prices, and then declined again. In sum, it seems that the move below 2008 intra-day highs has just been confirmed, which is very bearish news for the whole sector.
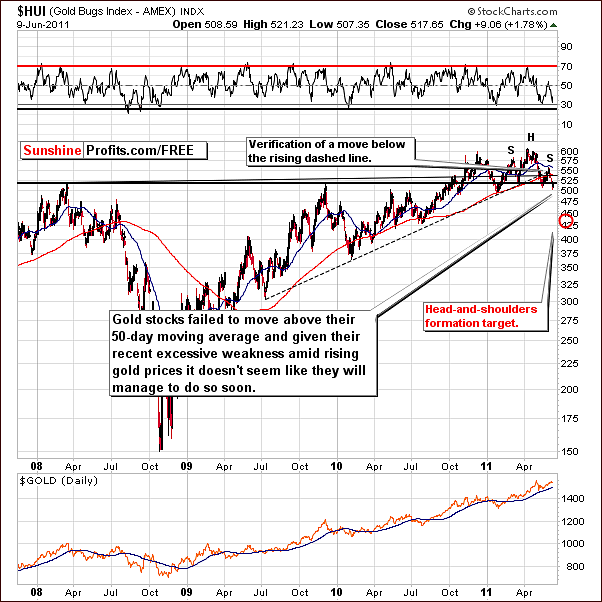
In this week’s HUI Index (gold stocks) chart, the signs are even more bearish. Once of the key support level has been broken and the move has been verified. Namely, the rising dotted line in our chart provided support numerous times in the past but has been broken and this breakdown was verified as resistance several days ago.
Moreover, gold stocks appear to be completing the bearish head-and-shoulders pattern and if the index level moves below the level of previous lows, the completion of this pattern could lead to a considerable decline in the HUI Gold Bugs Index. It appears that the index could in fact move below the 450 level, which has not happened for nearly a year. Naturally, that would have profound negative effects for the underlying metals as well.
This formation should not be ignored. The RSI level is consistent with local bottoms in the past so it would not be surprising to see a one to two day rally similar to Thursday’s move before the eventual decline is seen. This contra-trend move doesn’t appear worth betting on at this time.
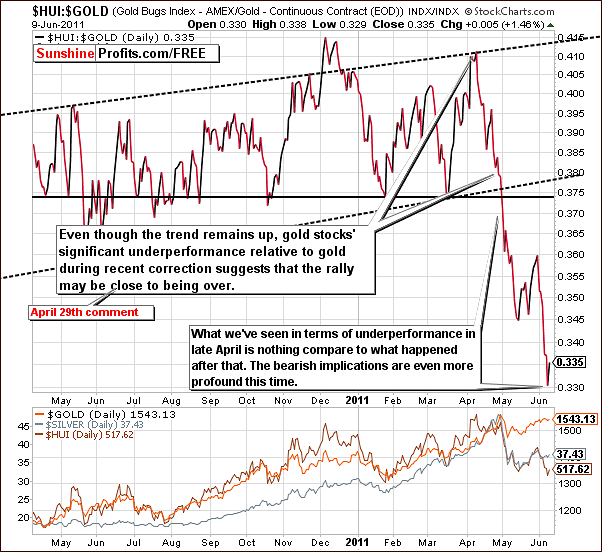
Our final mining chart shows the ratio of gold stocks to gold itself. In our Premium Update, April 29, 2011, we discussed the underperformance of gold stocks and suggested that the rally was close to being over. At that time we stated the following
We can clearly see the underperformance of gold’s stocks in recent days without using this ratio, but a look at the chart of the ratio shows that the gold mining stocks underperformance is significant. Investors with holdings in gold at this time should be concerned with its medium-term rally in light of the poor performance seen recently for gold mining stocks. Again, it appears that the end of this rally is close.
The patterns seen at that time were actually less profound than what we have seen since. This seems to infer that another move lower for precious metals is likely just around the corner. Declines could begin in just a few days.
Summing up, the situation for gold and silver mining stocks appears bearish overall as well as individually even without negative influences from gold and silver. It seems that if the head-and-shoulders pattern is completed in the HUI Gold Stocks Index chart, the whole precious metals sector could decline significantly in the following weeks.
Sunshine Profits’ Indicators
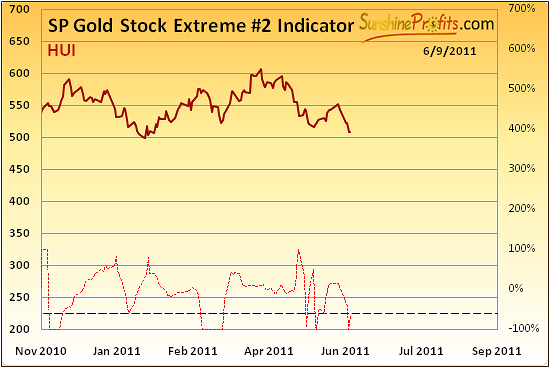
The Gold Stock Extreme #2 Indicator has flashed a signal based on Wednesday’s closing prices. However, this is not the version of the indicator that has been 100% accurate since 2008 (the #1 version is). It is a bit less reliable, so we do not view this as an invalidation of our previous analysis. It is possible that a 1-3 day rally could be seen, and, in fact, may be underway and more than half-way completed already.
Juniors
As stated in the Key Principles section, the list of top juniors will be updated approximately every 4 weeks, so this is the Update that should contain the revised version of the list.
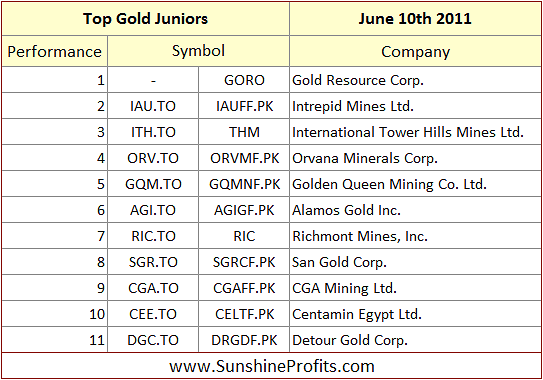
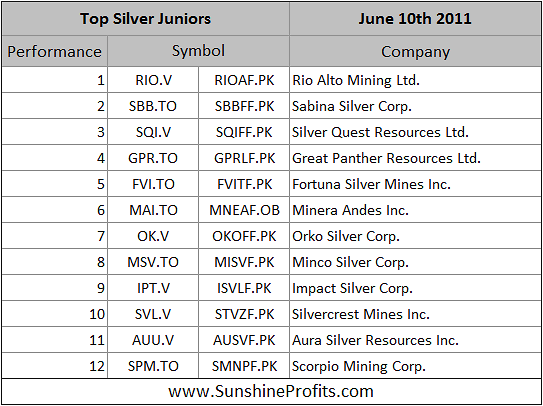
Generally, there was no significant changes as far as our preference regarding juniors are concerned, so it seems that one would not have to change their junior portfolio based on this month’s ranking. Please note that we have not been favoring junior over senior since a few months now as juniors move on average very similarly to big senior stocks, so we don’t view taking additional junior-related risk as justified. In fact, it doesn’t seem like being heavily invested in any of these sectors is a good idea right now, as you will read in a few moments in the summary of this report.
Letters from Subscribers
We received this question earlier this week and would like to share the answer with our Subscribers as we consider it to be of most importance at this market juncture.
Do you see a sharp pullback coming for commodities in general over the summer months? Do you feel that an ETF like SMN (ProShares UltraShort Basic Materials) may be a good hedge at this time with general stock market poised for a decline (that might take commodities with it)?
As far as the likelihood of the decline is concerned, we've already covered this topic in this update, but in short – yes, we believe that the commodities move lower during the summer months.
Generally, if one wants to bet on lower prices of commodities / precious metals in the short run (or hedge your long-term investments) the SMN ETF sounds like a good way to do it. Here are some additional ETFs worth considering. Which one you choose depends on your individual risk preferences (in most cases using leveraged vehicles: DZZ and ZSL with smaller amount of capital appears to be a good idea).
- SPMT ETFS Short Precious Metals ETF
- PTD E-TRACS CMCI Short Platinum ETN
- DZZ PowerShares DB Gold Double Short ETN (leveraged)
- ZSL ProShares UltraShort Silver ETF (leveraged)
- GLL ProShares UltraShort Gold ETF (leveraged)
- DGZ PowerShares DB Gold Short ETN
- HBD Horizons BetaPro COMEX Gold Bullion Bear Plus ETF (leveraged)
- HZD COMEX Silver Bear Plus ETF (leveraged)
- SBUL ETFS Short Gold ETF
- SPLA ETFS Short Platinum ETF
- SSIL ETFS Short Silver ETF
Summary
The USD Index has become bullish at least for the short term and the Euro Index conversely appears to be in a period of decline. The general stock market has declined recently, and the outlook has changed from slightly bullish to rather bearish especially for the medium term. These changes reflect the fundamental news of no QE3 that some market participants were counting on.
The currency markets and stocks in general are therefore likely to impact the precious metals sector negatively. In addition, the seasonal tendencies for gold, silver and gold and silver mining stocks are bearish at this time as well.
We would expect the precious metals to decline in the coming weeks and enter a period which could be termed the “summer doldrums”. This appears likely to last through the month of August but this is simply our best guess at this time. The exact timing is truly unknown. The problems surrounding the coming significant declines do, however, appear to be quite profound, as the decline could take gold $100 lower, silver $10 lower and HUI Index 70 points lower. These are not our precise predictions as we will provide those if the decline does indeed materialize; we provide them to illustrate that the decline could be quite important.
The price-volume action for both gold and silver suggests that extreme caution is necessary. The signals are bearish at this time especially combined with the excessive underperformance of gold stocks relative to gold. It seems that the rally has (almost?) run out of steam and another decline will soon be seen.
The most important implication here is related to long-term holdings. It seems that given all of the above, it would be a good idea at this time to sell or (preferably) hedge approximately 50% of your long-term precious metals investments. Generally, this number should be adjusted for your risk preferences – more risk-averse investors should sell/hedge less (perhaps 1/3) and more risk-tolerant investors can sell/hedge more (perhaps 2/3).
There have simply been too many bearish signals in place and, for this reason, this move seems appropriate in our view. We will continue, as always, to watch the developments of all markets and suggest alternative actions when we feel these will lead to greater profits with favorable risk/reward ratios. That is especially the case right now, as generally, the risk with long-term precious metals investments is to be out of the market.
Speculators may wish to take advantage of the current situation as well. A small portion of ones speculative capital could be used to bet on lower prices on the precious metals sector. At this point, the risk/reward ratio for price declines is quite favorable, even though a one to two day rally may be seen first. If these moves take place on low volume, they will serve as an additional confirmation of the points made in this update.
Our next Premium Update is scheduled for Friday, June 17, 2011.
This completes this week's Premium Update.
Thank you for using the Premium Service. Have a great weekend and profitable week!
Sincerely,
Przemyslaw Radomski

