
We’re back from our one week vacation (Italy, in case you were wondering) ready to get back on the thrilling roller coaster ride of the investment world. Today, the roller coaster metaphor seems apt to many investors who are up one minute on the “Vertical Velocity” (Bush Gardens), riding the “Silver Streak” (Canada’s Wonderland), or getting crushed in the “Avalanche” (Six Flags Over Texas.)
In the past few weeks we have sent you Market Alerts telling you when to get on the ride, and equally important, when to get off.
Although we had described the fall in precious metals prices, we can understand the shock for those who had gotten used to the idea that gold prices only go in one direction—up. A good metaphor here would be gold taking the stairs to go up, but the elevator to do down. Last Friday it was more like gold falling headlong down the elevator shaft with the worse one day drop in five years. It definitely got ugly, but that’s normal. It’s part of the game, part of the ride. Investors fled to the U.S. (fiat) dollar and to U.S. Treasuries (that just got downgraded last month by Standard & Poor’s.) Go figure! They have to settle their debt in dollars. The sharp decline was difficult to digest especially since we had come off a period in August where it seemed that gold could do no wrong. It shot up when markets plummeted, and shot up when markets soared.
So just how far did gold fall? The high earlier in the month was $1,920 and on Monday morning gold touched $1,530, almost a $400 drop. Let’s keep in mind that at the beginning of July gold was at $1,480, so even at the drop we were higher than we were at the beginning of July. Gold is still up about 14% YTD.
Last week, investors suffered an average market decline of 6.5% in the equity portion of their investments, the largest fall since the dark days of October 2008, with $1 trillion of paper wealth evaporating in the process. Speaking of October 2008, it was then that gold prices tumbled 18% as turmoil in global financial markets led to losses in global equity and commodity markets. The precious metal rallied 23% in the next two months.
So why did precious metals take such a fall? As our correlation matrix showed, over the past few weeks gold had decoupled from stock markets and every time stock markets sold off, gold would rise as investors would seek it out as a safe haven. However, the Chicago Mercantile Exchange (CME) began raising the amount of margin it required to buy a gold future with three raises since July. In total, margins have risen by $5, 400. (You had to put more money down to invest.) If you recall, the same thing happened with silver when it went parabolic in the spring. The CME raised margin requirements four times, amounting to an 84% hike.At that time silver also sold off. Then again, historically, margin hikes are known to be much more important for silver than they are for gold, so it seems there must have been more to the bearish case than just margin hikes.
Another factor influencing the drop was selling by investors to meet margin calls on other losses, or by investors anxious to lock in some profits and gold and silver is where the profits were to be found. This effect was particularly strong since gold moved so high recently and so many momentum players were aboard. It is important to remember that violent sell-offs in equity and other asset markets can spill over into precious metals, but after an initial selling wave, gold tends to disassociate itself and rebound.
The plunge brought the “Gold Bubble” crowd out of the wood work and with much joy, glee and self-satisfaction they proclaimed that they were right all along and the gold “bubble” is over.
They have said this every time that precious metals corrected.
“But after the wild ride that the price of gold has seen during the past month, its credibility as a haven is almost laughable. What good is fire insurance that disappears the moment your house actually catches fire,” asked Charles Lewis Sizemore in an article in Marketwatch titled “Gold, Is it time to call the top?”.
He writes: “Still, the short-term case for gold is questionable at best, and the long-term case even worse. We might have seen the high-water mark in the price of gold for the next 30 years. Or, this simply could be a much-needed correction in a much longer secular bull market. Only time will tell.”
It’s a good thing Mr. Sizemore left himself an out by bringing up the point that this could be a “much-needed correction.” He writes: “Investors should use last week’s gold-price plunge to get a little perspective — and maybe a little humility too. Gold is not a safe haven. It’s not even an investment. It’s a high-risk speculation that’s had a great run. And that run, if it hasn’t already, will come to an end.”
There is no doubt that like everything else, the bull run in gold will eventually come to an end, but we’re still a long way off. We see the sharp decline as an opportunity rather than a warning. It is a good time, for those who wished all along that they had bought gold, to do it on dips. Nothing that has taken place over the past weeks lessens our long-term optimism about gold. The same fundamentals are still in place. The situation in Europe continues to deteriorate daily. Greece is on the cusp of default and larger EU members look sure to follow. Meanwhile, political gridlock is the situation in Washington and QE III is coming, and with it, further decline in the purchasing power of the dollar (not necessarily right away, of course). The Swiss National Bank just instituted a peg with the Euro to slow down inflows of global investors seeking a safe haven – costing franc holders 25% of their position in the course of a week. Central banks are still buyers and not sellers of gold.
So to see what kind of a roller coaster ride we can anticipate in the near future, we will now take you to this week's technical part. We will start with analysis of the long-term interest rates (charts courtesy by http://stockcharts.com.)
Long-term US Treasury Interest Rates
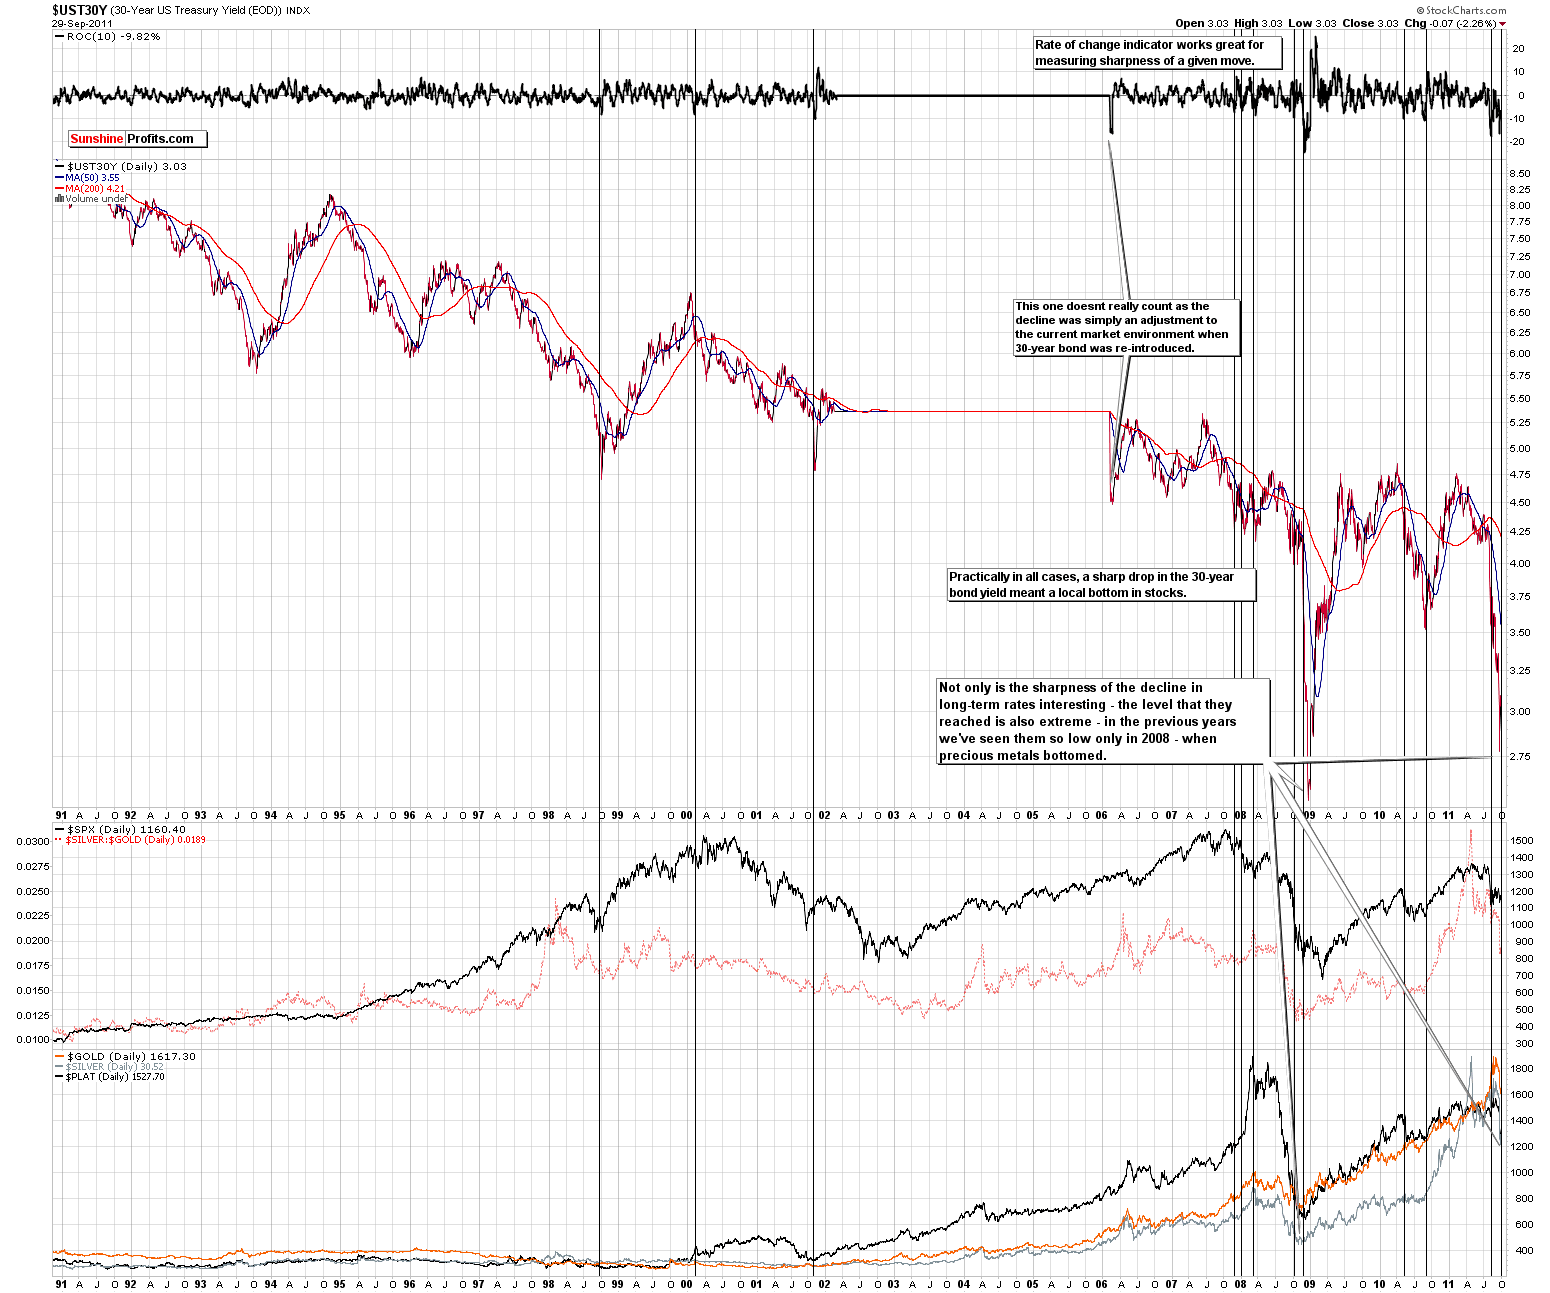
Before we begin our usual Premium Update sections this week, we would like to comment on the 30-year US Treasury long-term interest rates (please click on the above chart to enlarge it). This subject has been discussed on several past occasions, and we have stated that sharp declines in long-term interest rates often coincide not only with stock market bottoms, but also with bottoms in the precious metals sector. We also have explained that precious metals may not be at a bottom when stocks bottomed since these two markets were negatively correlated. In recent weeks we have seen gold and silver rally and then quickly reverse and decline sharply.
In recent weeks, long-term interest rates have declined, and it appears that we have seen or are very close to seeing the final bottoms for stocks and precious metals (this time the negative short-term correlation between the two is no longer present). The magnitude of the declines seen recently in long-term yields compares to only one period in the past 20 years, that being late 2008. At that time when the precious metals sector bottomed, stocks had not reached their final bottom but were close to it.
With this big picture in mind, we now will begin this week’s regular sections.
Euro - USD Indices
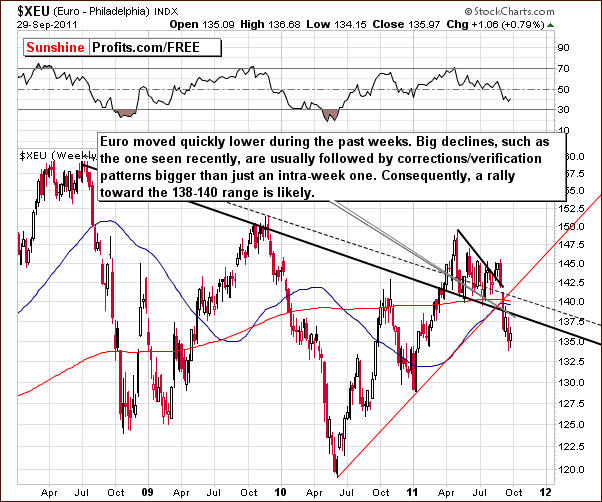
In this week’s long-term Euro Index chart, we clearly see that drastic declines have taken place in the past few weeks following a failed breakout attempt. Now the Index has paused and the breakdown below several support levels is likely to be verified. These levels will then provide resistance.
The intraday pullback that we’ve seen a few weeks ago does not appear to be enough to cool the emotions of Investors and Traders given the size of the previous decline. It seems likely that the index will retest the previous support levels and a rally to the 138 to 140 trading range is possible.
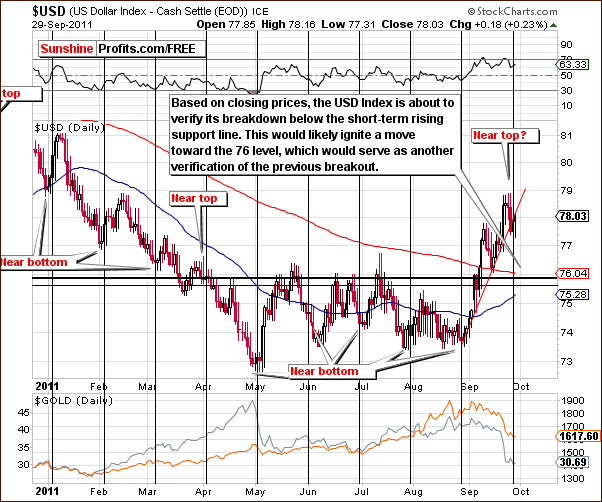
In the short-term USD Index chart, we see that a consolidation has begun and lower values will likely be seen over the next week or so. This appears particularly likely if we study the cyclical tendencies of this index. With a turning point in play, the suggestion is that the dollar will likely move lower for a short period of time before moving higher once again.
Concerning the rising short-term support level, we see a breakdown which is now being verified. Again, if and when this verification is complete, further declines could be seen for a short time with a likely downside target level close to 76. A continuation of the rally then appears probable.
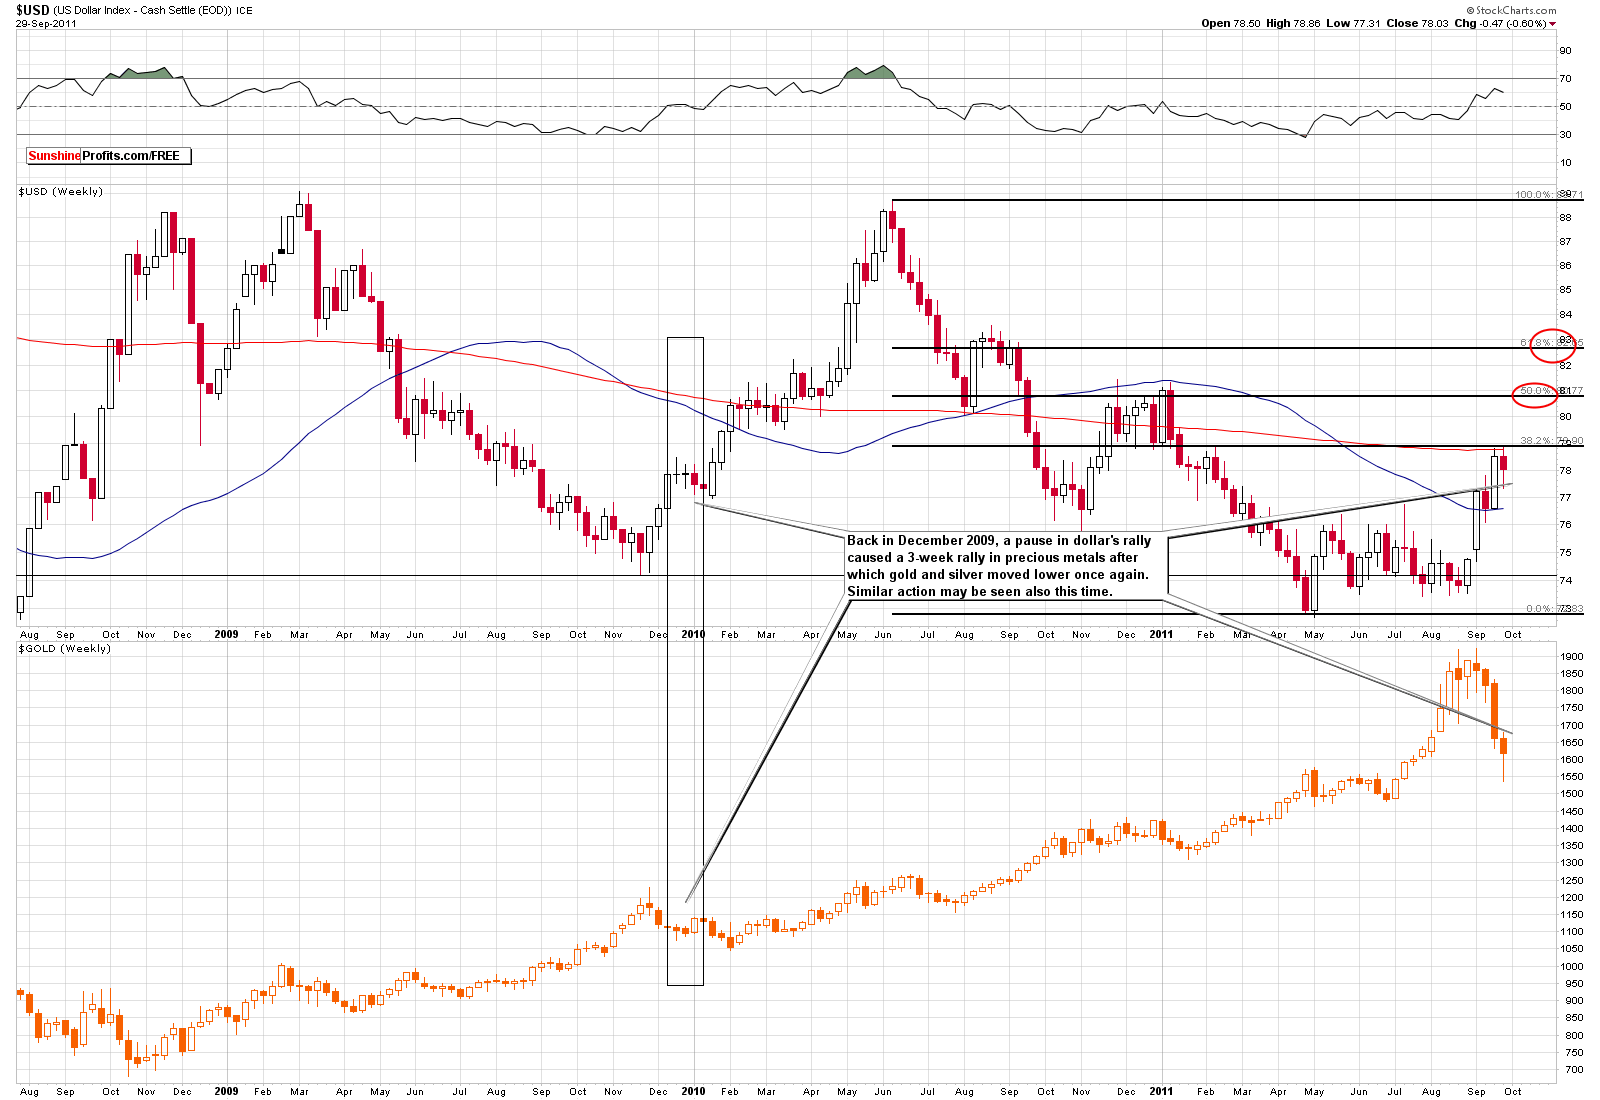
So what are the implications for the dollar and for the price of gold? We expect to see a consolidation for the USD Index similar to what was seen late in 2009 and in early 2010 (please click on the above chart to enlarge it). The correction was not very big at that time and it was quickly followed by higher index levels. A repetition of this trading pattern could ignite a rally in the precious metals sector much like what was seen late in 2009.
As seen above, the 2009 breakout in the USD Index was seen accompanied by declining gold prices. The dollar then declined and gold prices moved higher. Sometime later, while the dollar was still rallying, gold prices also reversed and began their own rally. Finally, gold prices once again moved lower.
Even though this trading pattern was seen previously, it will not necessary be followed exactly this time around. Based on this chart, a short-term rally appears likely for the yellow metal, and it remains to be seen whether or not new lows for gold will follow after that. More on this topic will be discussed in later sections of this week’s Premium Update.
Summing up, the short-term trend for the dollar appears to be up although a quick correction is likely to be seen first. The latter will likely have positive implications across the precious metals sector.
General Stock Market
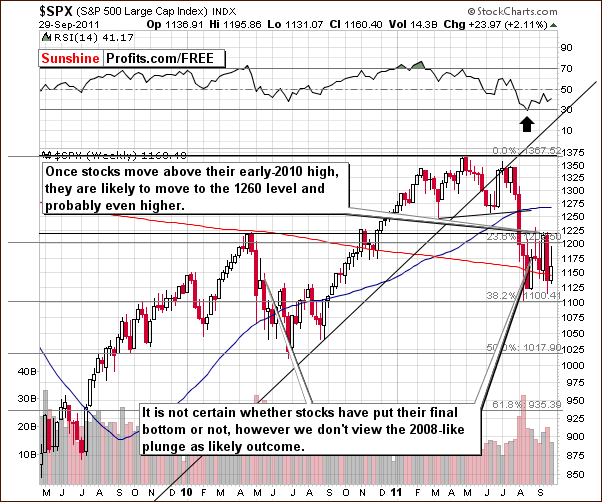
In the medium-term S&P 500 Index chart, the situation remains unchanged. For the past few weeks, we’ve seen the main stock indices basically trade sideways and at this time it is uncertain if the final bottom is in. This does appear likely to be the case, but even if it’s not, additional declines from here will not likely be major.
Summing up, the situation appears slightly more bullish for stocks than not.
Correlation Matrix
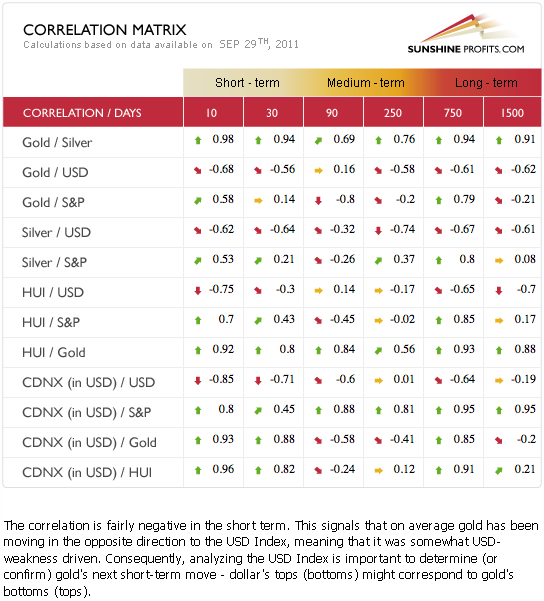
In this week’s Correlation Matrix, we can see that stocks do not appear to have much influence on the precious metals sector in the short term anymore. The long-term impact of the USD Index with respect to gold, silver and the gold mining stocks is beginning to be seen in the short term section as well. This tendency is visible in the coefficient values. Consequently, what we stated in the currency section this week is quite important for precious metals Investors and has bullish implications for the sector overall.
Gold
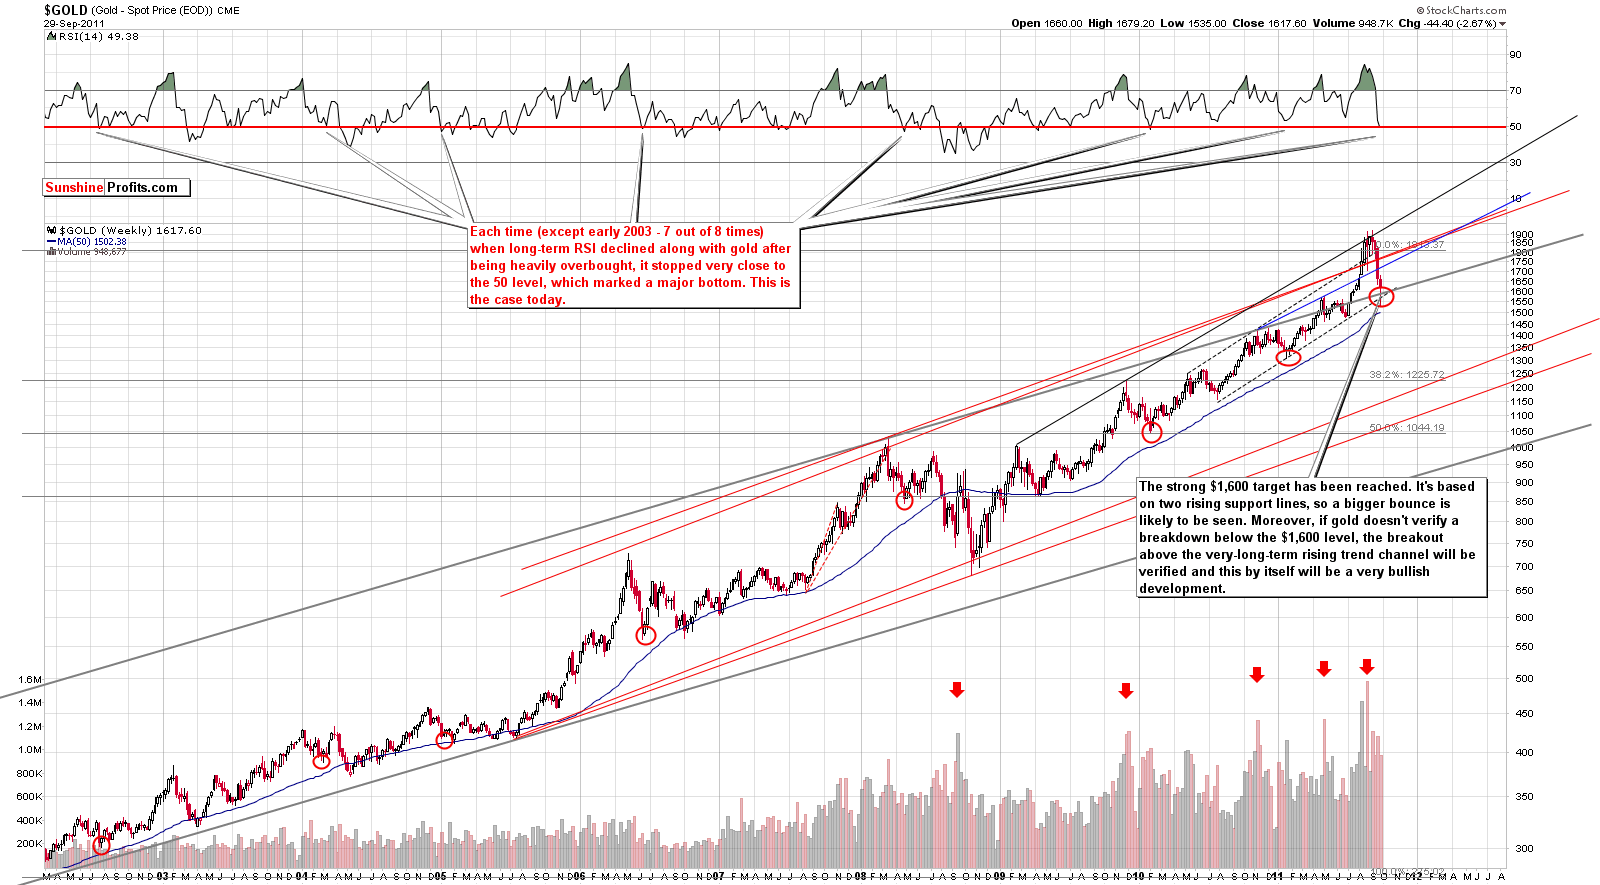
We begin our gold section with a look at the very long-term chart (please click the above chart to enlarge). Gold plunged very dramatically, but stopped close to the $1,600 target level. This level is based on two rising support lines. Clearly significant levels have been reached in both price and the RSI indicator (as seen in the upper part of the chart).
The long-term RSI, which is based on weekly closing prices, moved to the 50-level after being previously extremely overbought. Similar price actions where previously oversold RSI declined along gold prices have been seen eight times previously during this bull market. In seven of the eight times, gold’s decline stopped when the RSI reached the 50-level and a sizable rally soon followed. Each of these important local bottoms has been marked with a red ellipse in our chart. In some cases, the bottom was final but even when an additional decline was seen a short time later, significant rallies ensued. The RSI is close to the 50 level and it appears likely that gold will rally from here.
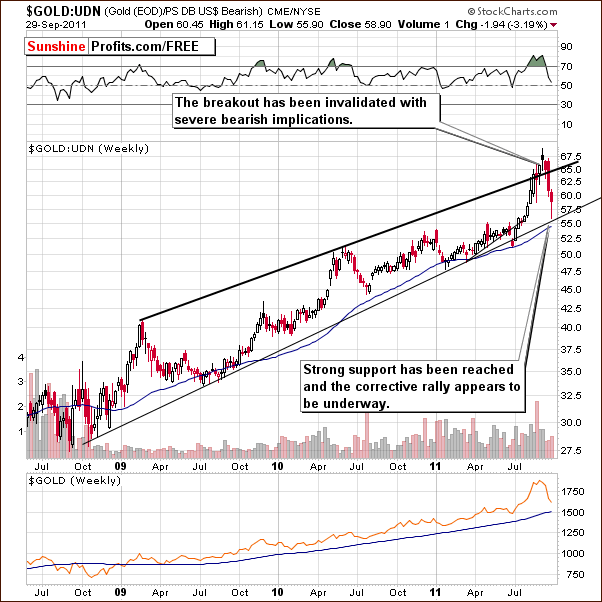
In this week’s long-term chart for gold from a non-USD perspective, we also see that a strong support line has been reached. The previous breakout above the resistance line created by previous tops has been invalidated, but the technical damage has already been done and it seems that a rally from here is quite probable.
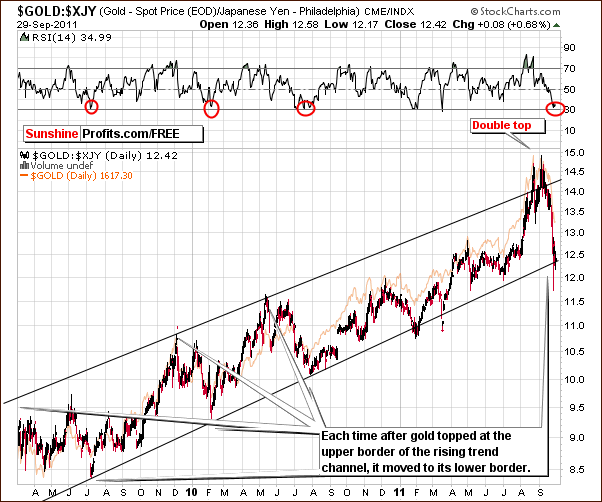
Looking at gold from the perspective of the Japanese yen, we also see RSI levels now oversold. In our last previous Premium Update, we stated the following:
With previous double tops normally spaced a bit farther apart than this last one, it seems that a sharper decline could be seen here as compared to the ones seen late last year and in April-May of this year.
Now we have indeed seen a decline that was much sharper than in the past. Each time the upper border of the trading channel was surpassed, index levels quickly moved to the lower border and this marked an important bottom from the USD perspective as well. Such has been the case once again, as the index moved below the lower border of the trend channel and quickly reversed. It is now right at this level. Similar price action patterns have been seen in the past and a rally generally has followed. The implications are bullish for gold.
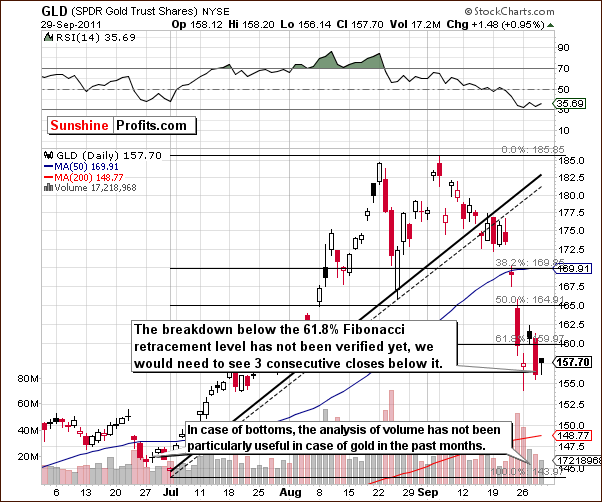
In the short-term GLD ETF chart this week, we see a confirmation of the breakdown below the rising support lines followed by a plunge and a reverse candlestick pattern on considerable volume (earlier this week). The low volume levels seen lately on upswings in price are not overly bearish as gold prices often move higher on low volume following bottoms. An example of this can be seen in late June.
The breakdown below the 61.8% Fibonacci retracement level is bearish but has not yet been verified. Three consecutive days of closing prices below this level are needed for verification. Tuesday’s move back above this level invalidated the current breakdown. Even if the breakdown is eventually verified here, it is of limited significance since long-term charts are much more important than those illustrating short-term price moves.
Summing up, based on multiple long-term factors, charts and the RSI indicator, it appears that we are close to or have already seen a major bottom in gold.
Silver
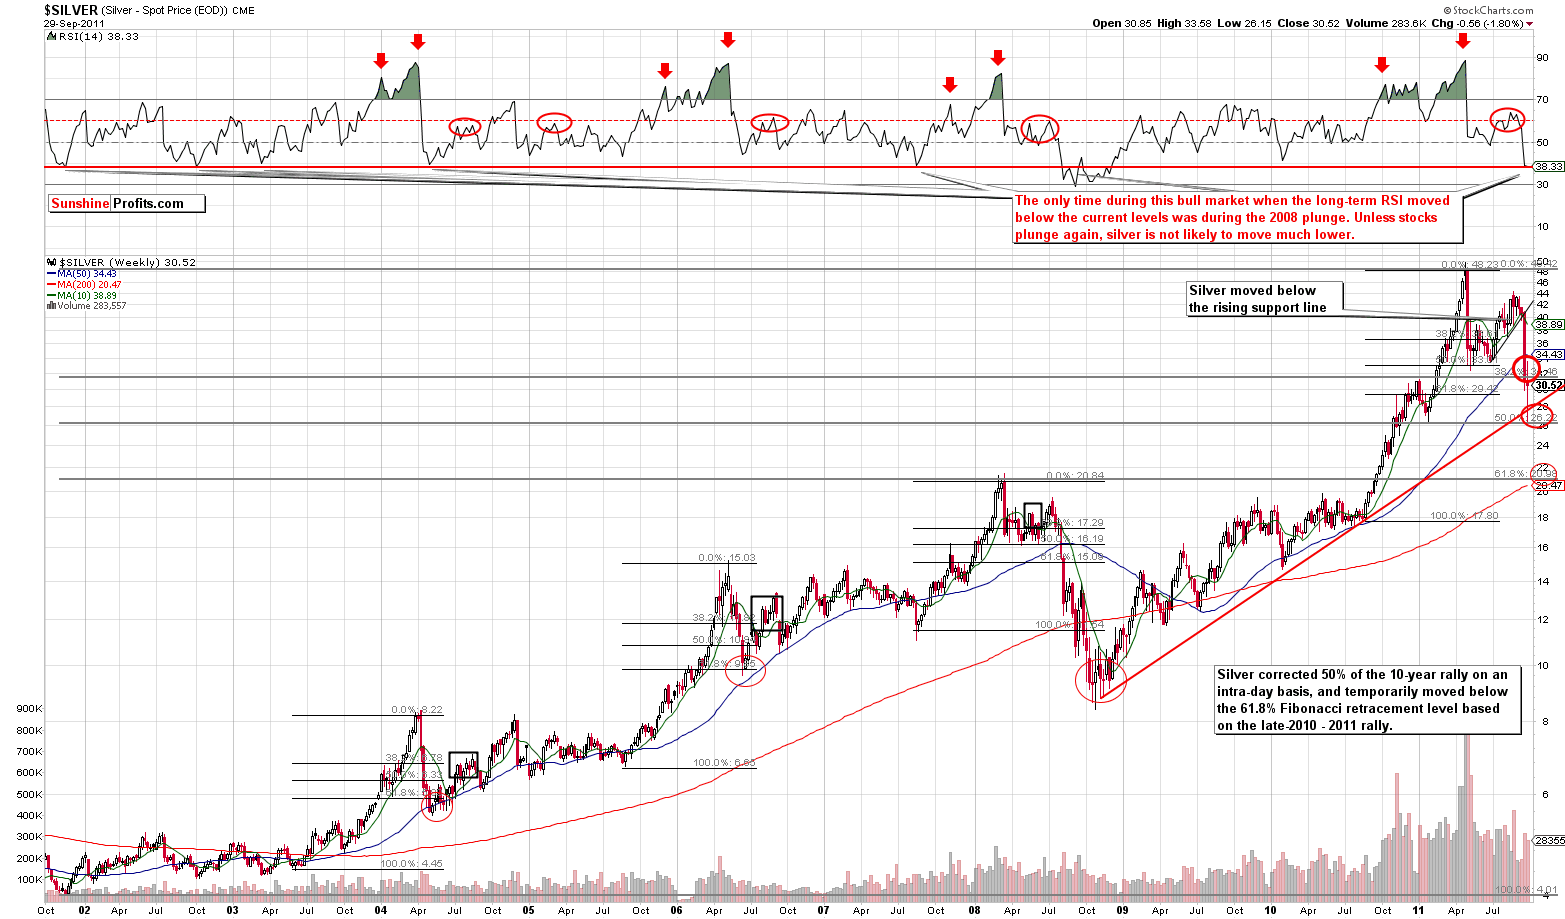
In this week’s long term chart for silver (please click the above chart to enlarge), we see price patterns which are somewhat different than those of gold. However, implications of the RSI indicator analysis prove to be quite similar. In this case, the critical support is close to 38 level (as compare to gold’s RSI 50 level). In the past, major bottoms for the white metal have coincided with this particular RSI level, except for the 2008 decline. At that time however, stocks around the world were truly plunging and such is not the case today. Although the general stock market has seen declines recently, these are not nearly as severe as the ones seen three years ago.
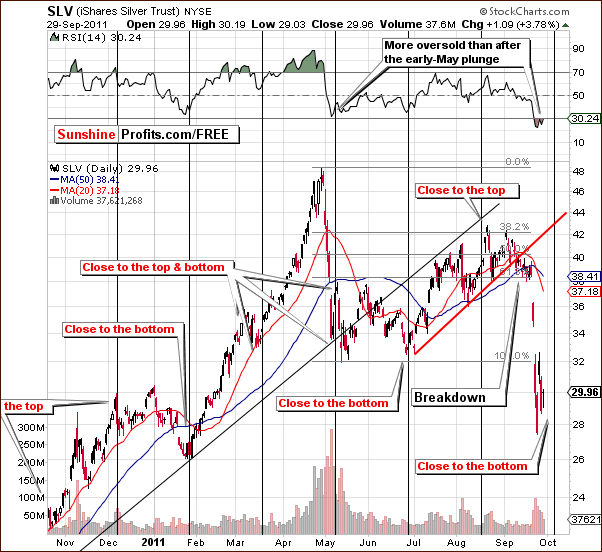
In the short-term SLV ETF chart this week, we see that the situation is now more oversold on a temporary basis than was the case right after the early-May plunge. Holding long positions appears to be justified at this time. Silver is approaching another cyclical turning point and with the recent price declines, it seems likely that a local bottom has been reached or soon will be. Even if a double bottom develops, higher prices still appear probable in the days or weeks ahead.
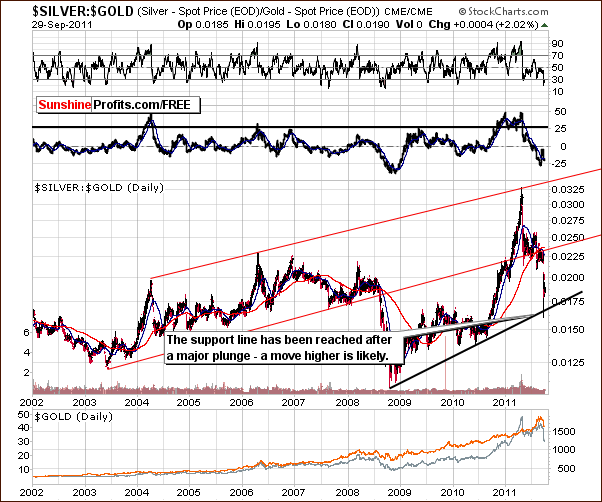
A look at the ratio of silver to gold reveals a plunge here as well. Several weeks ago we mentioned that the ratio had broken below the rising trend channel and it appeared best to move part of long-term silver capital to the sidelines. The ratio has truly plunged now and we have in fact seen levels similar to those at the beginning of 2002. The support level has been reached and after a significant slide and at least a bounce appears likely.
Looking at the RSI and ROC (rate of change) indicators across the past ten years, we see that other than the exception case of 2008, the ratio has rarely been this oversold.
Summing up, the situation for silver is similar to that of gold, that is, bullish with a rally quite probable in the near term. If we haven’t seen a major bottom yet, the cyclical turning point will likely coincide with it.
Platinum
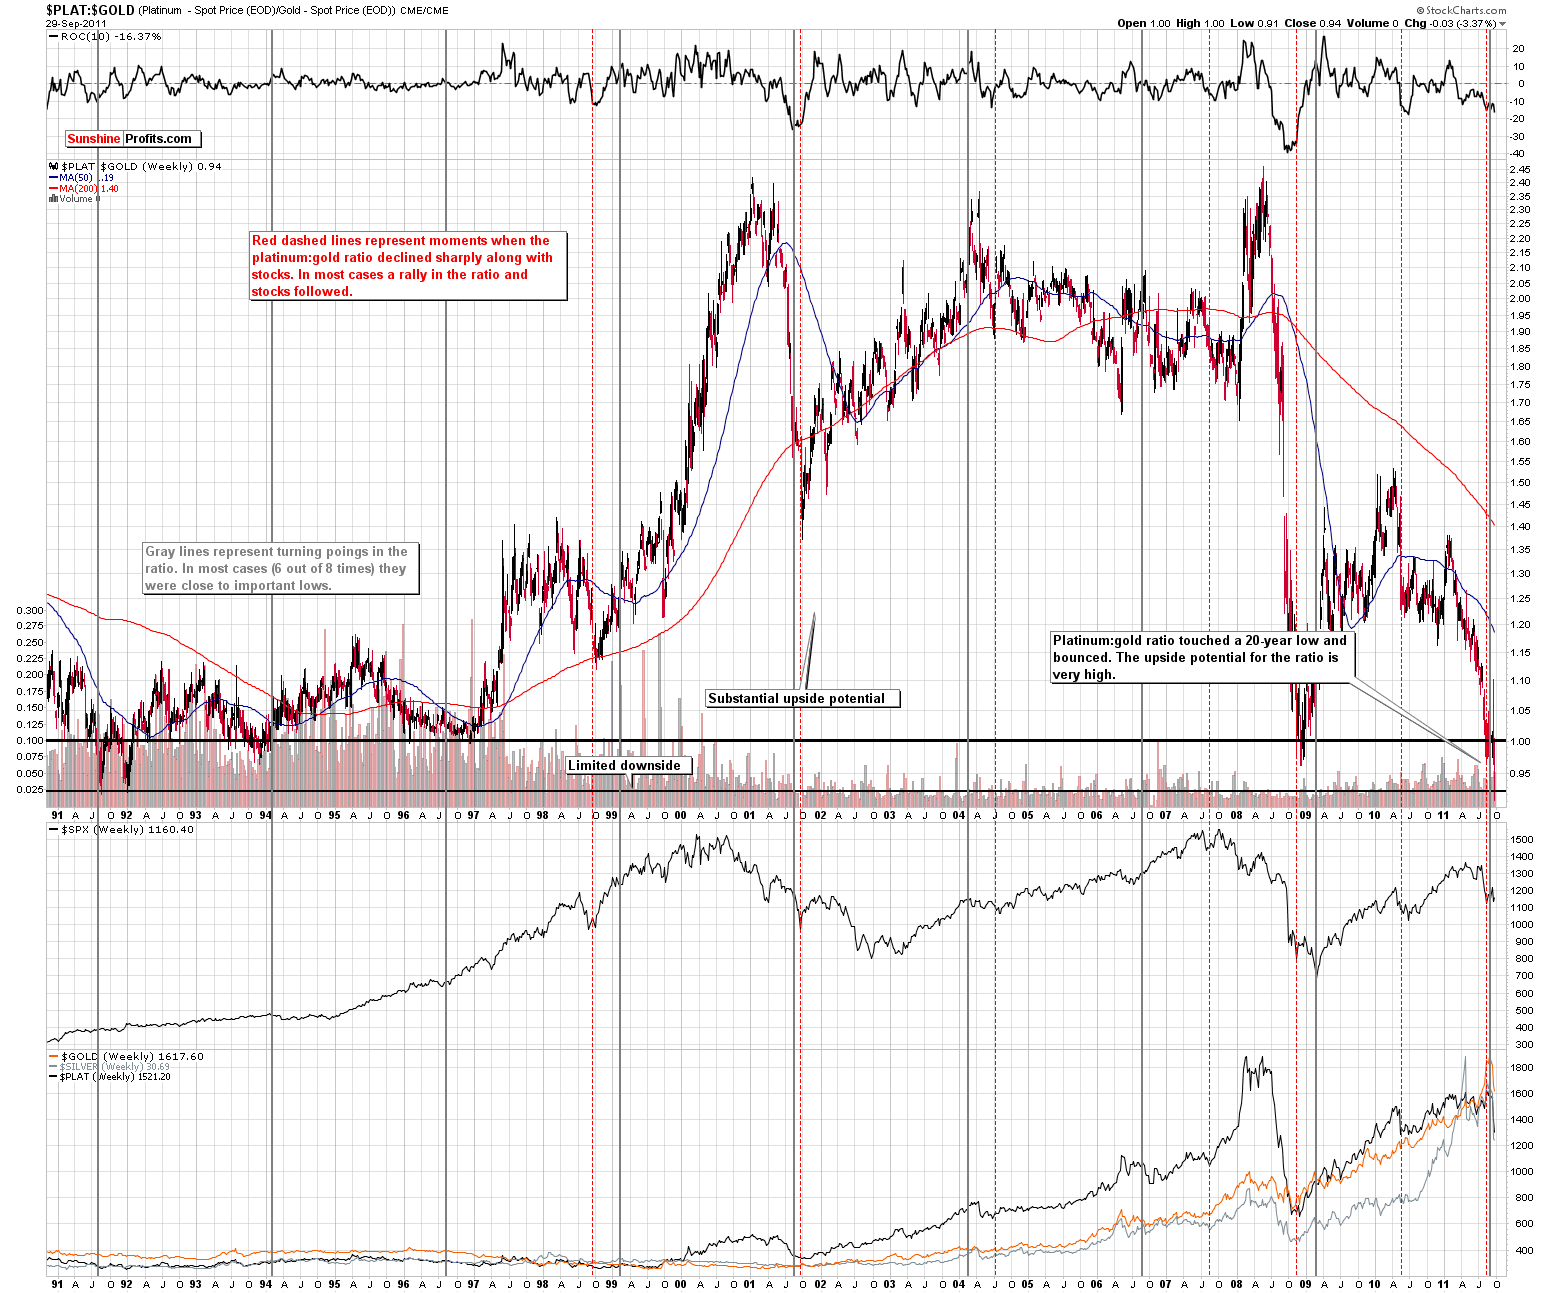
In the Platinum to Gold Ratio chart (please click the above chart to enlarge), we see the impact of lower platinum prices. We use this ratio to help answer the question, “Is platinum investment more favorable than gold at this time?” This does indeed to be the case.
The ratio briefly touched its ultimate support level at 0.91, a 20+ year low. Soon thereafter it moved a bit higher. At this time the upside potential is enormous, while the downside is almost non-existent. Combined with the situations in gold, stock market and long-term interest rates, this appears to be a very bullish combination for platinum. The black line in our chart shows how platinum’s price moved higher after its 2008 big bottom decline and it then outperformed gold for more than a one year period.
Summing up, platinum remains a buy at this time as well.
Gold and Silver Mining Stocks
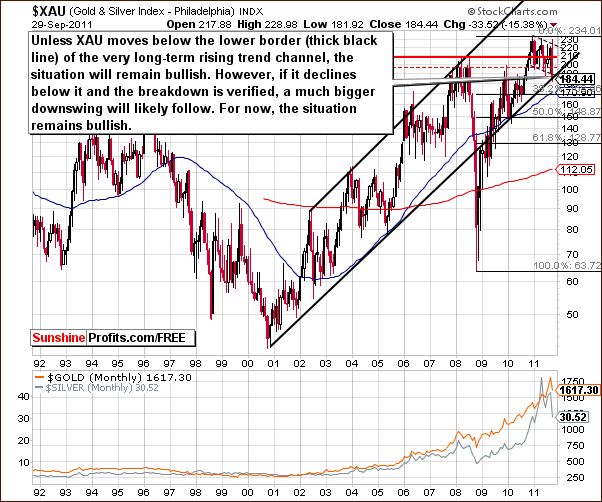
This week’s very long-term XAU Gold and Silver Miners' Index is at a critical level. The very long-term and short-term support lines are both in play and this is a very strong combination. A rapid rally or a least a significant bounce appears likely from here. Even if we see a breakdown below the current levels, then, a bounce to the current levels (as a verification) is quite probable so even if the decline continues, it seems that there will be another opportunity to exit the position. Still, a rally is likely to be seen soon, not a decline.
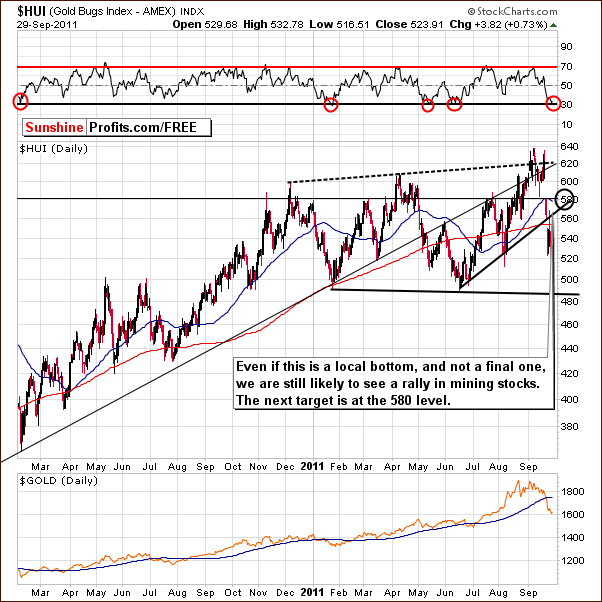
In this week’s long-term HUI Index chart, RSI levels are flashing a buy signal at this time. Based on previous local highs, our initial target level for a probable rally is 580. This could be higher if, in fact, a major bottom has been reached. The index could move to the 600-level and even exceed its previous highs which are close to the 640 level – given rallying gold prices. This is only a possibility at this time and whether or not such a move can truly take place remains to be seen.
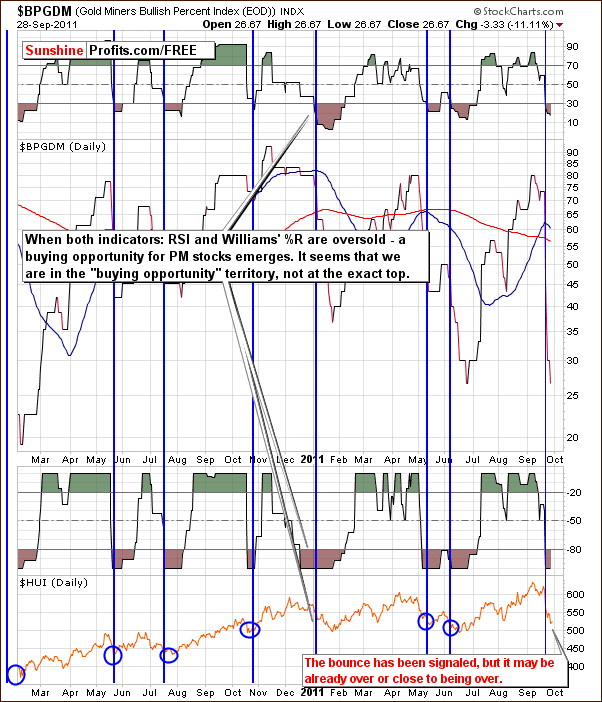
In this week’s Gold Miner’s Bullish Percent Index chart, we see that a significant decline has taken place. When both the RSI level and Williams’ %R are oversold, a buying opportunity presents itself. This was indicated a few days ago and a look to the past shows that this tool is quite reliable.
Summing up, the situation in mining stocks is quite bullish at this time, very much as is the case for the underlying metals.
Sunshine Profits Indicators
This week has been very rich in signals from our indicators, which by itself suggests that we are close to a bottom. Let’s take a look at each of them.
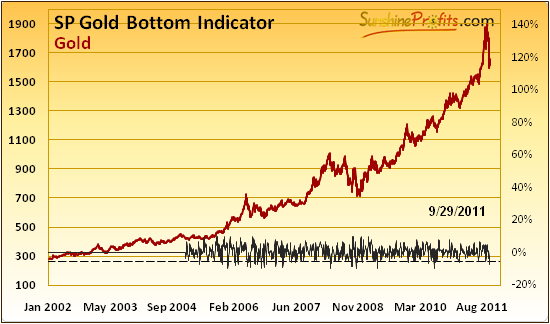
The SP Gold Bottom Indicator moved below the lower dashed line, which is a major long-term buy signal.
The three previous times when we've seen a buy signal (signal line crosses the horizontal dashed line at the bottom of the chart) from this indicator are: 8/26/2011 (right after an important bottom, after which prices rallied over $200), 6/29/2011 (close to $1,500, a few days before a major bottom) and 1/24/2011 (below $1,350, a few days before a major bottom).
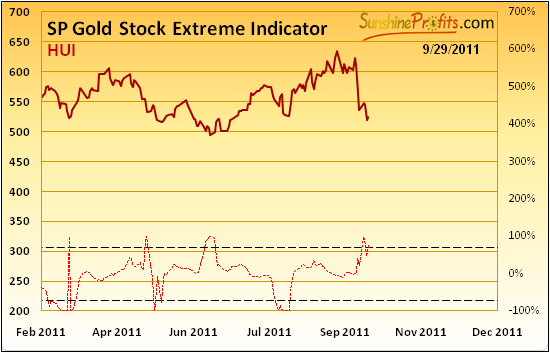
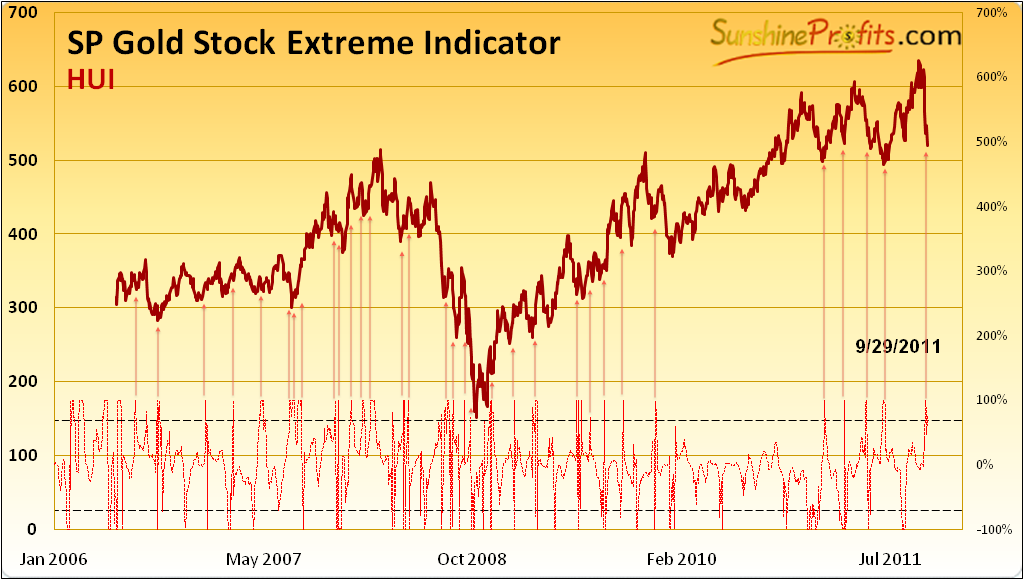
The SP Gold Stock Extreme Indicator moved above the upper dashed line, which was very close to a local bottom each time (!) since 2008 and in most cases before this date. As we can see, not each and every bottom was indicated, but when we have actually seen SP Gold Stock Extreme Indicator flashing a buy signal, each time a short-term rally followed. What we have seen right now is a very strong buy signal.
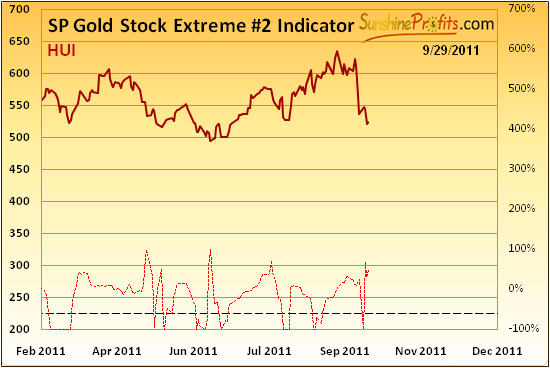
Our second SP Gold Stock Extreme Indicator (the same algorithm, but with different set of parameters) flashed an extreme reading as well which further supports the bullish case.
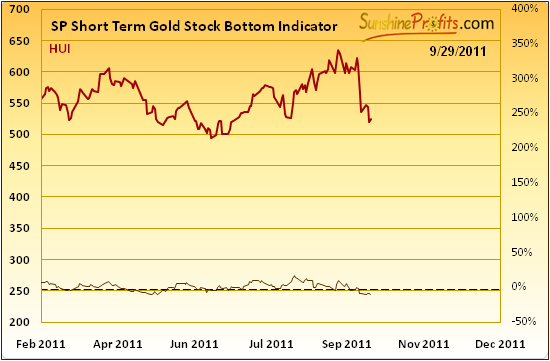
If that was not enough, even the SP Short Term Gold Stock Bottom Indicator flashed a buy signal this week. As a reminder, the buy signal is generated when this indicator is below the horizontal dashed line and starts to rise.
Summing up, the bullish case is well confirmed from both short- and long-term perspective.
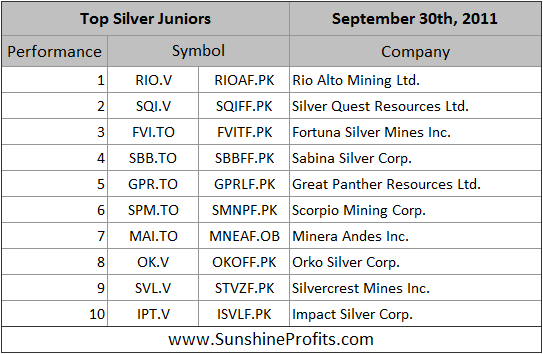
Juniors
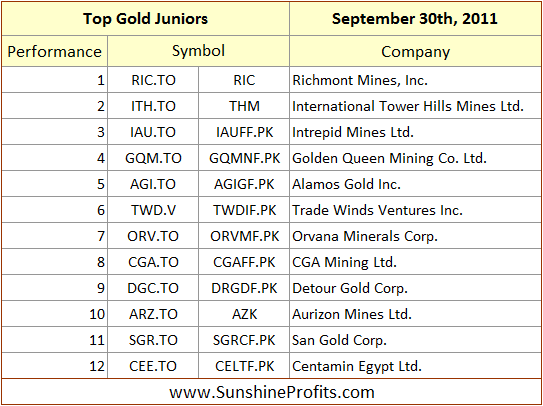
As stated in the Key Principles section, the list of top juniors will be updated approximately every 4 weeks, so this is the Update that should contain the revised version of the list. However, before moving on to the rankings, let’s take a look at the whole sector.
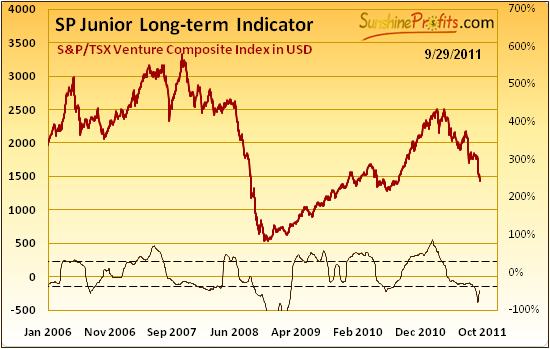
Recently, our SP Long-term Junior Indicator flashed a buy signal – as a reminder, it flashes buy signal when it moves below the lower dashed line and starts to rise and it flashes a sell signal when the indicator is above the upper dashed line and starts to decline. In this case, we’ve seen the former and it the outlook for juniors becomes bullish once again.
The situation in the long-term interest rates, stock market (note that juniors are highly positively correlated with main stock indices stocks) and the rest of the precious metals market is positive as well.
Let’s take a look how juniors performed compared to the senior producers.
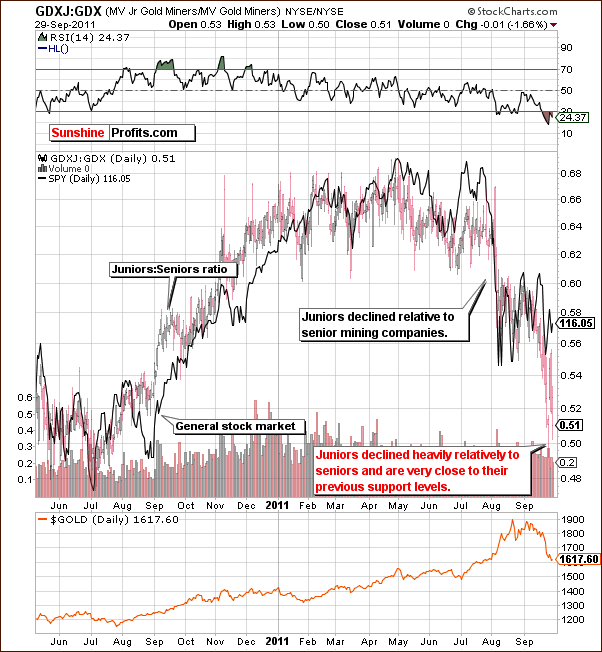
In the September 2nd, 2011 Premium Update we wrote that at [that] point [was] not certain that the bottom on the above chart is already in. Once the bottom in the featured GDXJ:GDX ratio is in, and the ratio rallies, it will mean that bigger gains (or smaller losses) will be associated with investing in the junior mining companies rather than in the big senior miners.
We believe that we have either seen a bottom in the ratio, or that we are very close to the bottom. The ratio moved very close to its previous lows and the RSI is signaling an extremely oversold condition. The bullish case is therefore confirmed.
Please note that the SP Long-term Junior Indicator previously flashed a sell signal for juniors in January, when the ratio was close 0.65 (30% higher than 0.5 level that was just reached), so by simply following it, one would have saved a significant amount of their mining-stock capital.
Since it’s time to get back into the junior sector, we decided to provide you with our top junior rankings one week ahead of our normal schedule (we usually post them every first Friday of the month).
Letters from Subscribers
Q: It seems like silver is following an extended 2008 crash over nearly five and a half months taking it down ultimately more than 50% from peak to trough -perhaps as low as the low 20s. Does this seem plausible?
A: While our lowest target for silver is around the $21 level, it doesn't seem likely that it will be reached. Right now we view such a possibility at about 35% or so.
Q: I have a very simple question that has to do with understanding your viewpoint.As I write this, gold has broken significantly below 1600.Is this kind of move something you anticipated when you suggested there might be a "pullback"?
A: Yes, moving a bit below the previous low was not out of the question. "Was it likely to move as low?" - No.
Q: Given everything going on, what are the chances that gold will go down another 200, 300, or whatever and stays there for years or keeps going down? That's the real issue these days. In the end, if metals stay in a bull phase, then you have the right idea of trying not to time the bottom, and simply getting in at a significant pullback.
A: At this point there are no signs suggesting that the bull market is over and it's not very probable that gold moves a few hundred dollars lower and stays there for years (say for 3+ years). It would take gold well above $5,000 to just match the 1980 high in real terms (taking unchanged inflation numbers into account) and we're not even halfway there.
There's still a possibility of a big decline prior to another big rally – as was the case in the 70's, but so far we have no confirmation of that. At this point, we see the probability of this happening soon at about 20%. Silver declined to one of the target areas and gold moved lower as well, but the uptrend continues in both cases.
And right now it seems that this is the case, so I believe most of one's capital should be invested. As far as speculative capital is concerned, we also think that betting on higher prices is justified but for reasons that are different - several buy signals emerged and we're right after a significant decline.
Q: Can you please comment on the usefulness and accuracy of point and figures charts. Do you use them?
A: We didn't find them particularly useful for the precious metals market and we don't use them directly. We use them indirectly in the form of the Gold Miner's Bullish Percent Index that we feature from time to time. This index is based on the point & figure chart for gold stocks. Precisely, we don't use this index alone, but rather RSI and Williams' %R that are based on it.
Q: We see a good range in intraday trading, how could we benefit from that huge range, what are your thoughts?
A: Whether or not to engage in day-trading (opening and closing a position several times per day) is mostly a question of one's expertise (we don't recommend day-trading for beginning investors/traders or those who tend to get emotional about their trades), risk preferences (very risk-averse investors/traders should generally stick to longer time-frames), and the time that one can dedicate to the market (day-traders should follow the market really closely for the whole session and be able to act quickly).
So, day-trading is not recommended for most investors/traders, and we generally don't provide day-trading signals. What matters is not only the size of the intra-day price swings but also their predictability and at this point our tools are not adjusted for these types of trades and thus we seldom suggest extremely short-term trades. This may (and likely will) change in the following months after we introduce a new website (it's in the final stage of development) - at some point we plan to introduce an additional service dedicated to day-traders.
Q: It would be very handy to know the timing on these indicators which you have mentioned below. You said Long Term for the junior indicator - does that mean greater than 3 mths hence one should see good results but immediately better to hold off buying? Reason is I bought some juniors based on this but find them quite underwater after one day! With the SP Bottom indicator signaling does it mean specifically a new lower low won't be reached? Or just that in the long term (greater than 3 mths) there will be good results from buying at this level.
What would be the timing on the other 2 Extreme Indicators you mentioned.
When you send out an alert such as this I feel it's important to add more info on this timing issue.
A: The best way to estimate the size of the move of any indicator (including our own) is to simply take a look at the chart and see what happened previously when analogous signals flashed. As the name of the SP Long-term Junior Indicator suggests, it provides long-term signals – we expect not to see a sell signal for at least several months. It does not mean that the price of juniors won’t go lower on the next day or even next week. It means that one average buying at this level was a good idea, and since we are talking about the long-term capital here, timing the exact bottom is not advised. So, yes, it is likely, that in the long term (greater than 3 months) there will be good results from buying at this level.
The above-mentioned methodology can be applied to other indicators (i.a. Extreme Indicators) as well. In this case, we are looking for at least a 1-3 week rally that’s visible from the long-term perspective. We encourage you to review the Premium Charts section on our website and click on the medium term charts to enlarge them. You will find the SP Gold Stock Extreme Indicator also below (click to enlarge):
As far as providing additional details in Market Alerts is concerned, in most cases we’re trying to provide only the most relevant details in each of them because we want to send it to you as soon as possible. Market Alerts are sent when something urgent happens and since that is the case you should be notified immediately. We will try to provide more details when the timing is less than critical, but it will not be possible each and every time.
Summary
The situation in the USD Index is rather bearish in the very short-term and this has positive implication for the precious metals sector. No change was seen in the general stock market this week and although the situation is unclear, it appears more bullish than not. Although a final bottom may not yet have been reached, it seems that declines from here will be quite small if seen at all. Higher prices are likely sooner rather than later.
The major implications upon the precious metals sector at this time come from the USD Index. Based on this week’s correlation readings, the situation is positive for precious metals in both the short term. The long term situation is positive as well, as it’s supported by numerous fundamental factors and also factors seen in this week’s charts. Gold and silver are at support levels after big declines and a rally is likely in both markets.
The bullish sentiment here is further supported by the long-term RSI levels of gold, silver and the HUI Index. Buy signals are apparent from these charts and these buy signals are major and significant. Furthermore, we have seen buy signals from several Sunshine Profits Indicators and the Gold Miner’s Bullish Percent Index also suggests buying opportunities as well. The situation is bullish.
Moreover, we’ve recently seen buy signals from our Junior Indicator and now prefer juniors over senior producers. Platinum continues to provide a good buying opportunity. We remain bullish long term and short term for the precious metals markets and continue to hold our long positions.
On a personal note, it was not easy to wait with our long-term purchases earlier this week from the moment we knew that it was a good idea to buy, to the moment when we sent out the Market Alert – silver moved over $1 higher during this very short period (an hour or so). Subscriber’s interest comes before our own, and we believe that investment in ethics pays off - if not in monetary terms, then with resulting peace of mind.
Our next Premium Update is scheduled for Friday, October 7, 2011.
This completes this week's Premium Update.
Thank you for using the Premium Service. Have a great weekend and profitable week!
Przemyslaw Radomski

