
Ever wonder what it would take for Greece or the other debt ridden nations to leave the euro? According to a UBS report there are no such provisions. It appears that the only way that a country could leave in a legal way is to negotiate an amendment to create an opt-out clause. That would likely take a long time and would require a negotiation with the entire European Union with possible referenda to be held in some of the countries.
According to the UBS report: “While enduring the protracted process of negotiation, which may be vetoed by any single government or electorate, the potential secessionist will experience most or all of the problems we highlight …(bank runs, sovereign default, corporate default, and what may be euphemistically termed ‘civil unrest’).
Leaving abruptly would result in a lengthy bank holiday and massive lawsuits and require the willingness to simply thumb your nose in the face of any European court, as contracts of all sorts would have to be voided. The Greek government would have to “conveniently” pass a law that would require all Greek businesses to pay back euro contracts in the “new drachma,” giving cover to their businesses, who simply could not find the euros to repay.”
After that hurdle one would wonder who outside Greece would want to take the “new drachma” in exchange for goods that Greece does not produce on its own?
Gold Demand Will Grow Says World Gold Council
According to the World Gold Council, gold demand, which dropped in the second quarter of this year, is expected to strengthen by the end of 2011 driven by jewelry buying in India and China and recovery in investment demand. Jewelry buying in India and China, which together account for 55 percent of global jewelry demand, remains strong in the short and longer term as the number of wealthy people is expected to grow,
"In the third quarter, we are going to see strong investment numbers, because of the European crisis, the debt downgrade in the United States and poor economic figures coming from the United States, which have created a concern in investors' mind that we may be heading back to another recession," WGC Managing Director for Investment Marcus Grubb told Reuters. Economic worries have fueled investment into gold bars and coins on the western markets in the third quarter, he said.
Central banks, which have purchased 198 tons of gold to boost reserves in the first six months of this year, have kept buying in the third quarter and are expected to continue this trend later in the year.
In addition, it is unlikely that the heavily indebted European counties will sell their gold reserves because the reserves are merely a pittance when compared to their mountain of debt – at least at today’s prices.
Libya’s Gold Reserves
One country that has sold off some of its gold is Libya: According to press reports Muammar Gaddafi embattled regime sold off 29 tons of the country’s gold reserves during its final months as it attempted to survive the rebel uprising, NATO bombing and international sanctions. The central bank apparently sold the gold, a fifth of the country’s total reserves, to local traders who later took the metal out of the country for resale. Libya holds its gold reserves of 144 tons inside the country. Jewelers in Tripoli said the central bank offered small 22-carat coins and later sold off 12 kg bars costing almost half a million dollars each as its need for cash to pay its troops became more desperate.
Gold Kept Krugman Up All Night
Paul Krugman writes that he stayed up one night thinking deeply about gold and he had some interesting conclusions in his New York Times column last week. The Nobel laureate admits to being “a big deflationista” and sees record low interest rates as a vindication of his position.
Krugman considers what really drives the price of gold.
“Well, I’ve been thinking about it — and the answer surprised me: soaring gold prices may be quite consistent with a deflationista story about the economy.”
The rest of his column is technical but his conclusion is as follows:
For this is essentially a “real” story about gold, in which the price has risen because expected returns on other investments have fallen; it is not, repeat not, a story about inflation expectations. Not only are surging gold prices not a sign of severe inflation just around the corner, they’re actually the result of a persistently depressed economy stuck in a liquidity trap — an economy that basically faces the threat of Japanese-style deflation, not Weimar-style inflation. So people who bought gold because they believed that inflation was around the corner were right for the wrong reasons.
And if you view the gold story as being basically about real interest rates, something else follows — namely, that having a gold standard right now would be deeply deflationary. The real price of gold “wants” to rise; if you try to peg the nominal price level to gold, that can only happen through severe deflation.
OK, none of this necessarily rejects other hypotheses about gold; in particular, there could be a bubble over and above the Hotelling aspect. But the crucial message is, I think, right: If you believe that gold prices are signaling an inflationary threat, I have to tell you, I do not think that price means what you think it means.
In our view we are in a stagflationary period (like in 70’s), which is supposed to look like a “mild recovery” based on the rising stock prices. However, rising stock prices are achieved only through excessive money supply and extremely low interest rates, which eventually has to lead to inflation. Gold is responding to economic and political instability and one of the problems that it’s responding to is supply of money.
(End of) Summer Reading
Summer is over but if you still have time for some reading, we can recommend “That used to be Us” by Thomas L. Friedman and Michael Mandelbaum. The two discuss how America fell behind the world that it had invented and how America can come back.
Here are some interesting statistics from the book:
- Thirty years ago, 10 percent of California’s general revenue fund went to higher education and 3 percent to prisons. Today nearly 11 percent goes to prisons and 8 percent to higher education.
- About one-fourth of ninth graders fail to graduate high school within four years. Among the O.E.C.D. countries, only Mexico, Spain, Turkey and New Zealand have higher dropout rates than the United States.
- The top 1 percent of Americans now take in roughly one-fourth of America’s total income every year. In terms of wealth rather than income, the top 1 percent now controls 40 percent of the total. This is new. Twenty-five years ago, the corresponding figures were 12 percent and 33 percent.
- Seventy-five percent of young Americans, between the ages of 17 to 24, are unable to enlist in the military today because they have failed to graduate from high school, have a criminal record or are physically unfit.
Friedman and Mandelbaum note that China led the world until it bumped into a series of “bad centuries” after 1644. That fate could overtake America too.
Let's begin this week's technical part with the analysis of the Euro Index (charts courtesy by http://stockcharts.com.)
Euro - USD Indices
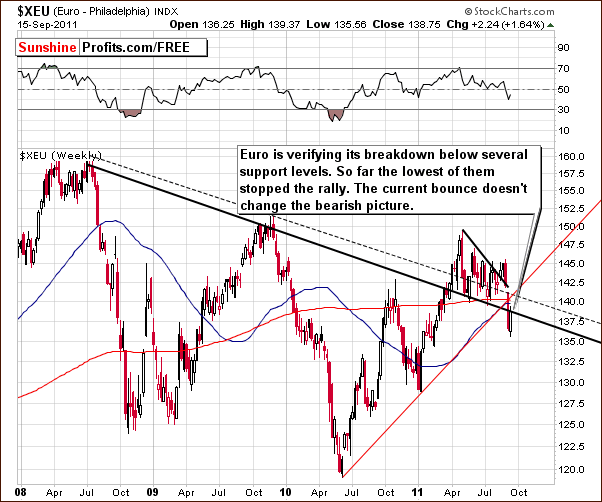
We begin with a look at the long-term Euro Index chart. This week we clearly see a perfect invalidation of the recent breakout above the short-term declining resistance level. This invalidation has been followed by a powerful downward move. This is another example which stresses the importance of waiting for verification of any given move in the market.
We are now, in fact, seeing a verification of a breakdown. The euro has moved below its declining support line and below three additional support lines created by previous lows and moving averages. A small rally stopped below previous support lines which are now resistance levels and at this point, the contra-trend bounce may already be over.
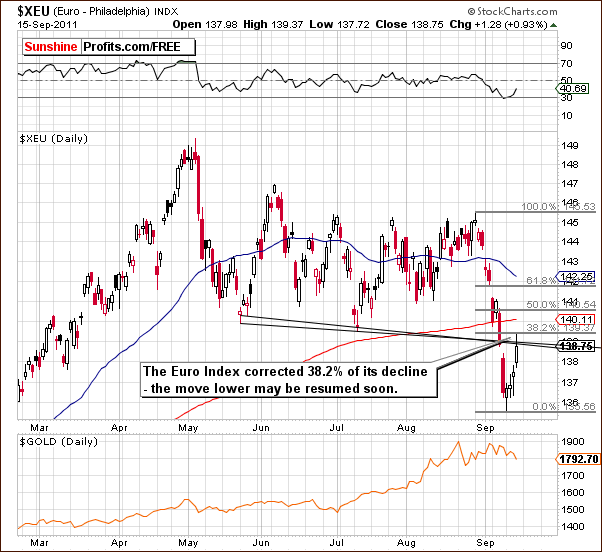
In this week’s short-term Euro Index chart, we see additional resistance levels which have been touched but not broken. At this point, it appears to be nothing more than a verification of the recent moves lower and this is quite likely to be followed by further declines. The bearish picture appears to remain very much in place.
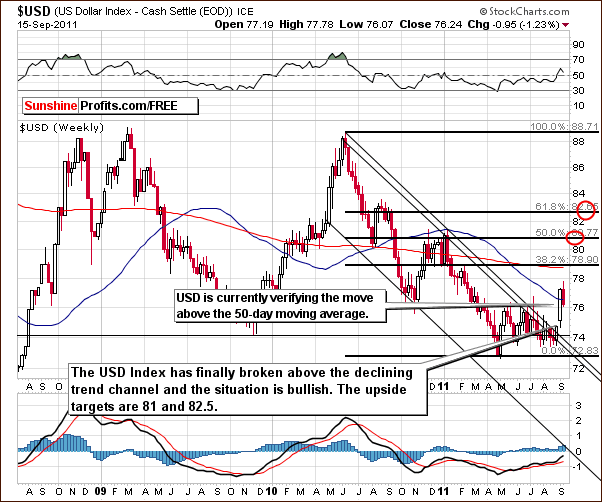
In the long-term USD Index chart, we see the opposite trend to what we saw for the euro as is usually the case. Index values have moved higher. The recent breakout above the 50-day moving average, a level which has served as support and resistance several times in the past, is now being verified.
Higher values for the USD Index will likely be seen if this verification is completed. Two likely target levels are 81 and 82.5, both of which are considerably higher than current index levels. A move towards these targets will likely have a very negative impact across the precious metals sector. More on this topic will be covered in the Correlation Matrix section of this week’s Premium Update.
Summing up, the outlook remains bearish for the euro and bullish for the dollar. Generally this will have negative implication across the precious metals sector.
General Stock Market
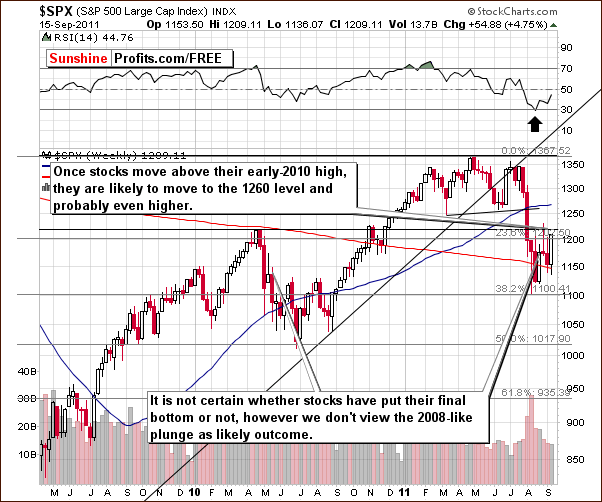
In the long-term S&P 500 Index chart, we see that the index has move higher this week. In Tuesday’s Market Alertwe discussed a downward move in the general stock market:
The risk factor here is the general stock market which moved lower today, which may be viewed as an (unconfirmed) breakdown below a flag formation, which would be a bearish signal. However, as mentioned above, this move has not been verified, and additionally, the short-term correlation between stocks and gold has weakened in the past days, so the risk to the short position in the metals is not as big as it would seem at the first sight.
Stocks subsequently rallied. This is yet another example of why waiting for market move verifications is important. The situation for the general stock market at this time is rather bullish and if stocks move above the level of the highs seen in 2010, a likely target level of 1260 for the S&P 500 Index will be quite reasonable.
Summing up, the situation remains rather bullish for stocks and if the uptrend continues, the situation will likely become even more bullish. It appears less likely now that anything similar to the downturn of 2008 will take place in 2011.
Correlation Matrix
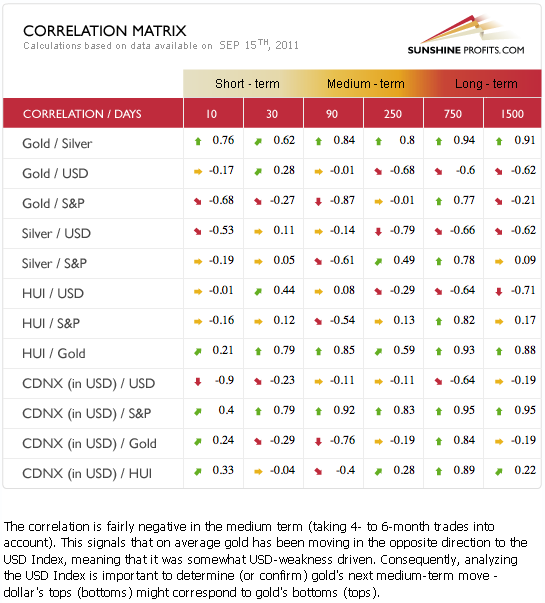
In this week’s Correlation Matrix, there are no big changes in the implications between the markets. The main factor to keep in mind is the situation in the currency markets and the major move to the upside for the dollar. The situation in the Euro Index has turned for the worse this week with an invalidation of the breakout discussed last week.
The USD Index is negatively correlated with precious metals. This relationship is stronger with the underlying metals than it is with the gold and silver mining stocks. The latter group has an interesting situation of its own which will be covered later on.
The negative correlation between precious metals and stocks is less significant this week. The lack of clarity with a slightly bullish situation in stocks is not something which is clouding the precious metals picture. Stocks are no longer closely aligned with precious metals as the currency markets are now the main driver.
Gold
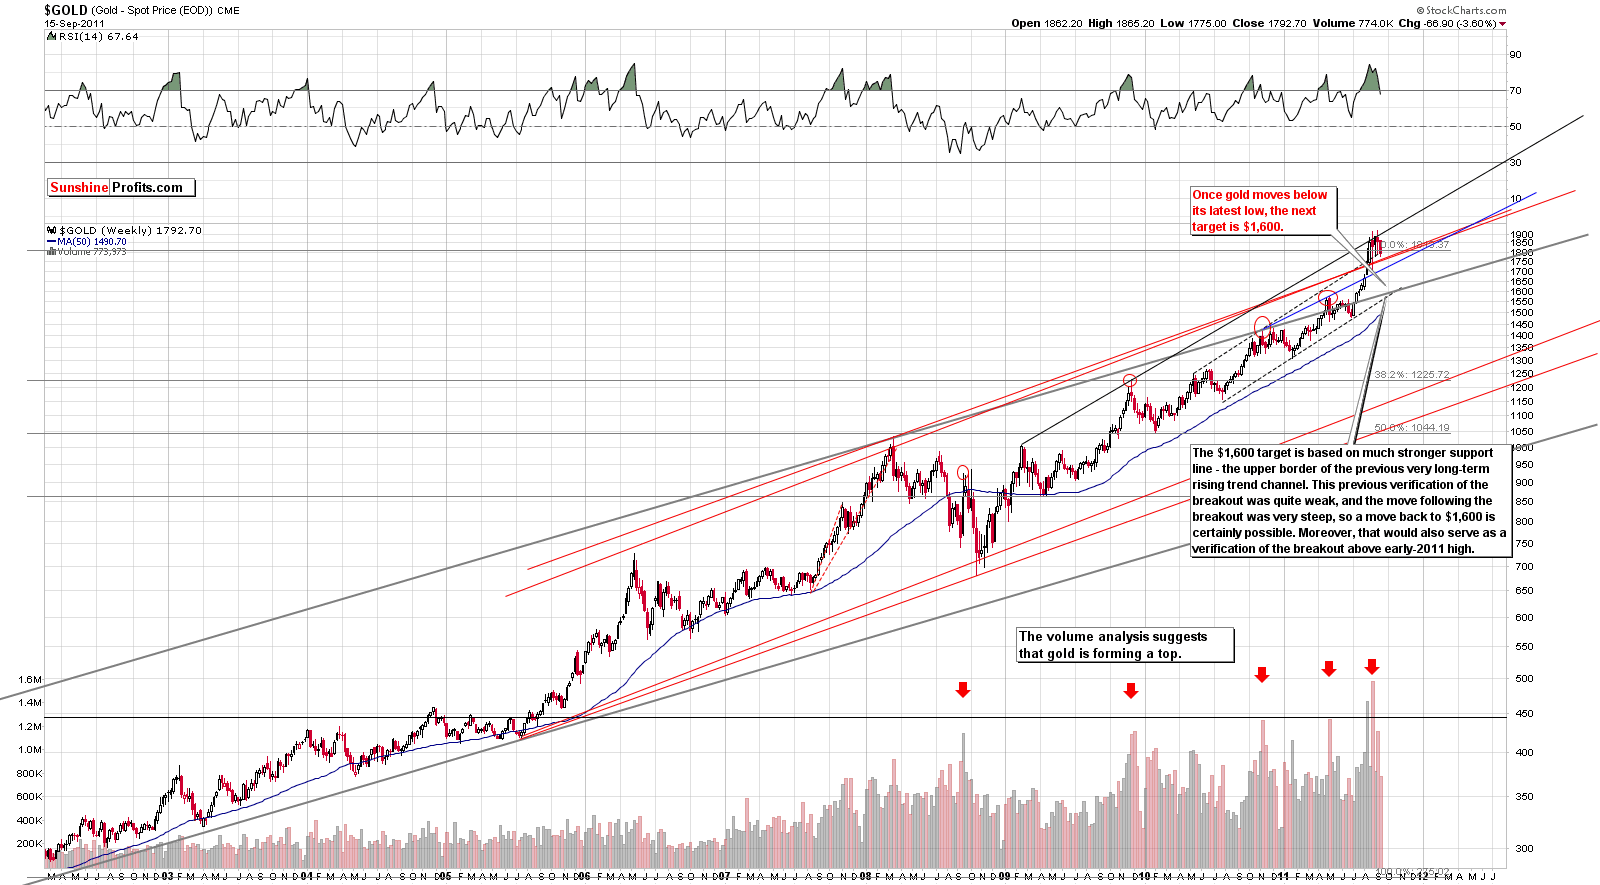
We begin our gold section with a look at the very long-term chart (please click on the chart to enlarge). Gold moved visibly lower this week and barring an increase on Friday will likely end the week at its lowest weekly closing price level in over a month. This is a bearish development and it appears that a reversal of the previous upswing is now underway.
If gold’s price moves below $1,700, the next target level will be in the $1,600 range. At this time, it appears that this downside target could be reached towards the end of September or in mid-October. Of course, discussing such a turnaround in great detail is a bit premature, for much depends on the price action to be seen over the next ten trading days.
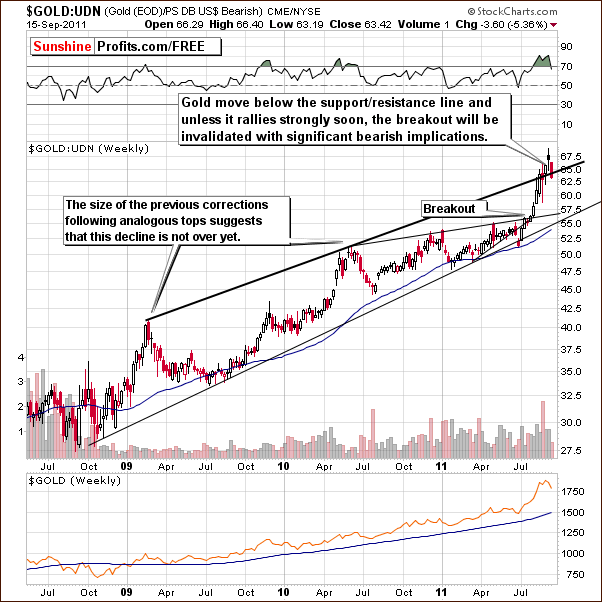
In this week’s long-term chart for gold from a non-USD perspective, we see that gold’s price has moved slightly below the upper border of the rising trend channel which is a key resistance level. If it closes the week significantly below this support/resistance line, the outlook for the following weeks will be significantly bearish. In such a case, likely target levels here will be in the 56 - 57 range. In addition, such a development would likely be accompanied by significant declines in gold’s price on the USD side as well.
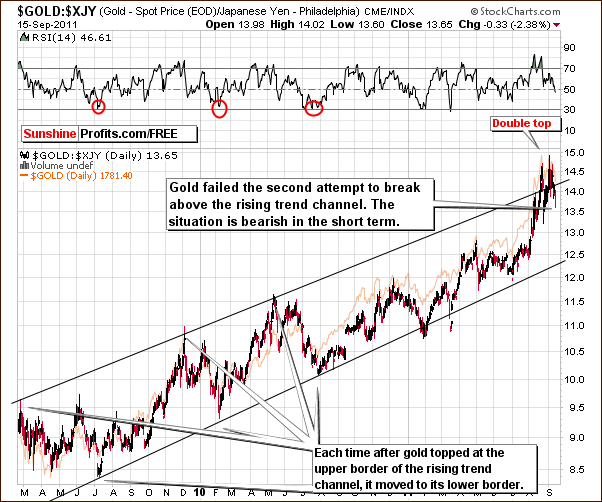
Looking at gold from the perspective of the Japanese yen, we see that after forming a double top, gold’s price has once again moved back to within the rising trend channel. A second attempt to move above this support/resistance line has failed and we are once again seeing a bearish invalidation of the breakout.
Lower prices are likely from here and the double top pattern seen recently is not all that uncommon. With previous double tops normally spaced a bit farther apart than this last one, it seems that a sharper decline could be here as compared to the ones seen late last year and in April-May of this year. A mid-October top appears to be a possibility, but this is truly just a guess rather than a prediction at this time.
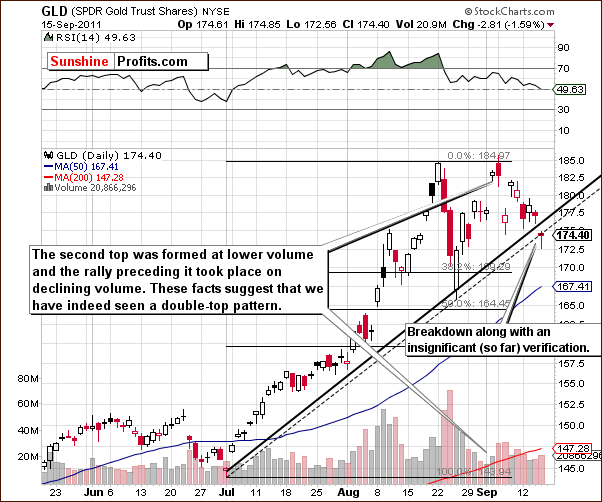
In the short-term GLD ETF chart this week, we see that price levels have moved below the rising support line. There has been a breakdown below the support line based on daily closing prices, but this has not yet been seen with respect to the support line based on intra-day lows. A breakdown below this second support line also appears likely however.
Summing up, the situation in gold is bearish for the short term and is certainly more bearish than it appeared at the beginning of the week. At that time, the bearish signals were from the gold mining stocks, and this sentiment is now confirmed from the gold market as well.
Silver
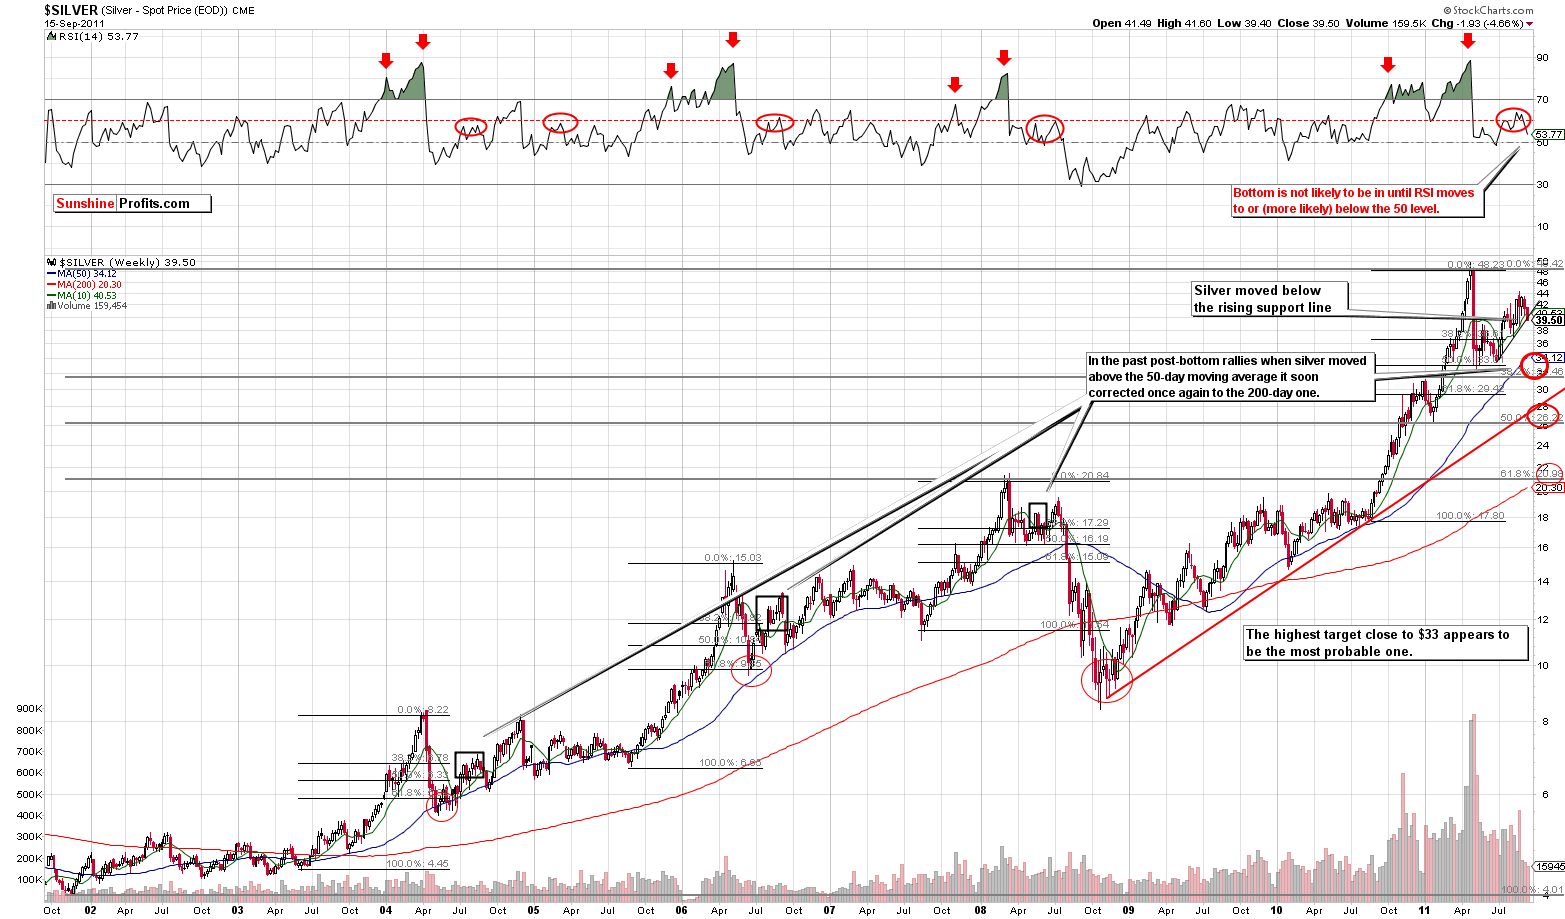
In this week’s long term chart for silver (please click the above chart to enlarge), RSI levels indicate that we are likely seeing the beginning of a bigger downswing towards the 50–week moving average. This is presently close to the $34 level and at this point appears to be a valid downside target. Silver is likely to bottom around the same time that gold and the gold mining stocks do. It appears most likely at this time that these local bottoms are a few weeks away.
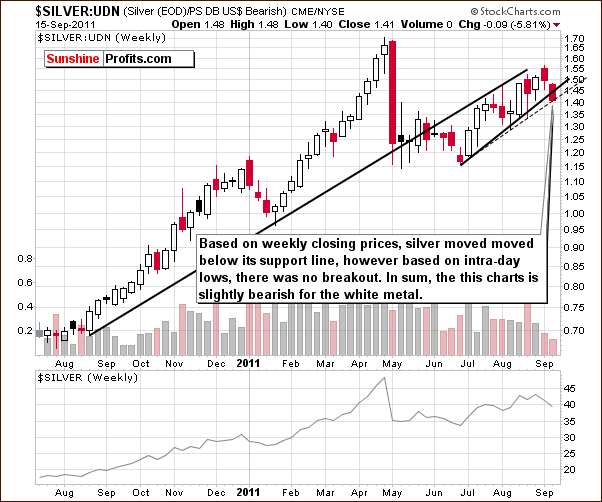
In the long-term chart for silver from a non-USD perspective, we see a small but confirmed move lower. A breakdown has been seen below the weekly closing price support line but not yet for the support line based on intra-day lows. Overall, this chart is slightly bearish.
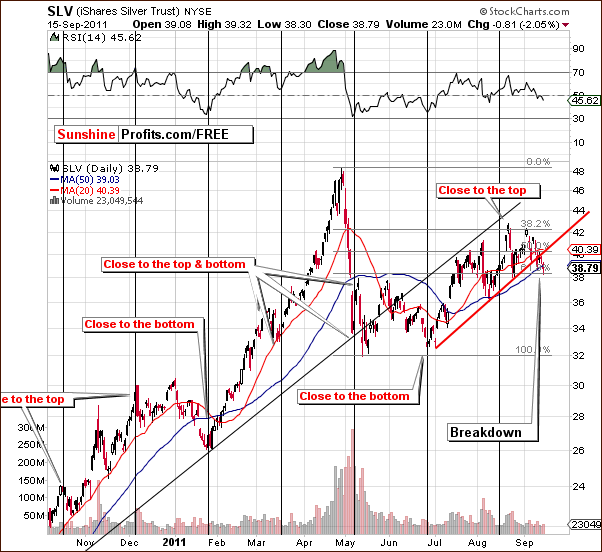
In the short-term SLV ETF chart this week, we see that a breakdown is visible but it has not yet been confirmed. The situation is clearly more bearish than it has been for the past month. The breakdown which is indicated here has also been confirmed by silver’s long-term chart this week.
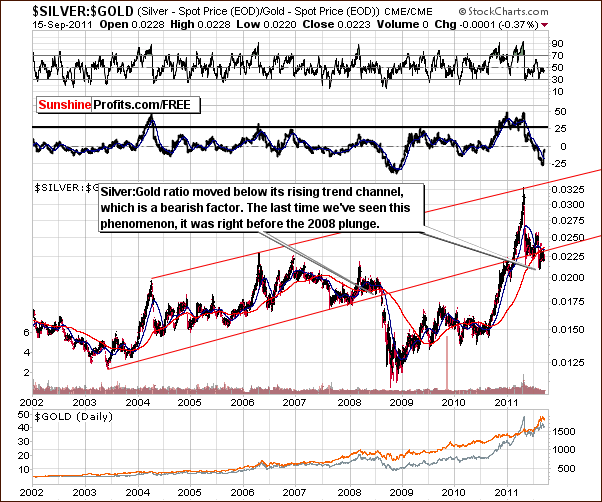
A look at the ratio of silver to gold shows us that little has changed this week. The reason we include it in this week’s Premium Update is to further support our belief that the situation here is truly unfavorable for silver. The ratio is below the rising long-term trend channel. This was last seen about 3 years ago, right before silver’s price severely plunged. While the decline may not be as significant this time around, the situation is clearly unfavorable and being out of the silver market with 50% of one’s long-term capital appears to be appropriate at this time.
Summing up, the current situation for silver is very much the same as it is for gold, which is quite bearish for the short term. All four charts in this week’s silver section have generally bearish implications at the present time.
Platinum
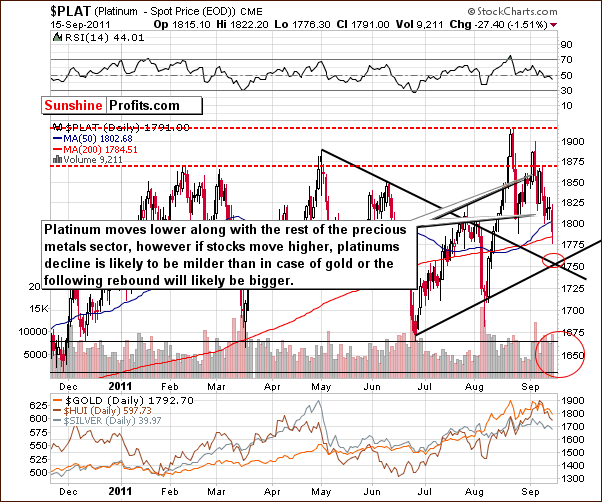
In this week’s long-term platinum chart, we see that prices have declined and two downside target levels appear valid. The first is around $1,750 based on the support line of previous lows. The second downside target level of $1,650 is based low price levels seen in mid-March and late-June this year. Based on the current extreme reading in the platinum:gold ratio (close to 1) and the situation in the main stock indices it appears that platinum’s price decline will be smaller than gold’s or it will have a stronger price rebound once the period of declines has ended.
Gold and Silver Mining Stocks
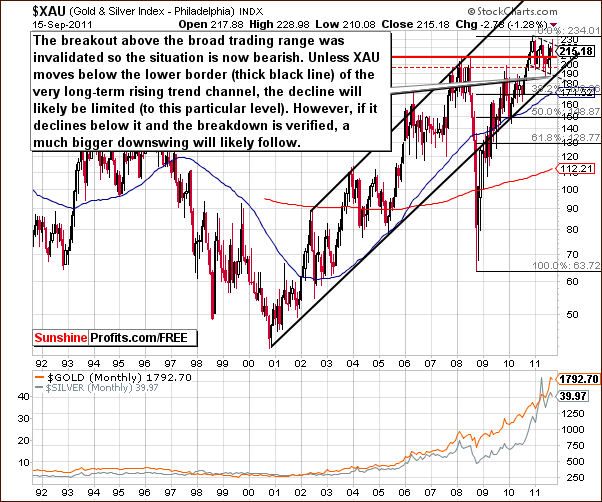
In this week’s very long-term XAU Gold and Silver Index chart, we have our first suggestion of an invalidation of the mining stocks recent breakout. In this 20-year chart, the move back below the broad trading range is clearly visible and the lower border of the rising trend channel (at the 190 level) could stop further declines. If the index moves below this support line, the next likely target level would be close to 170, a full 20% below Thursday’s close.
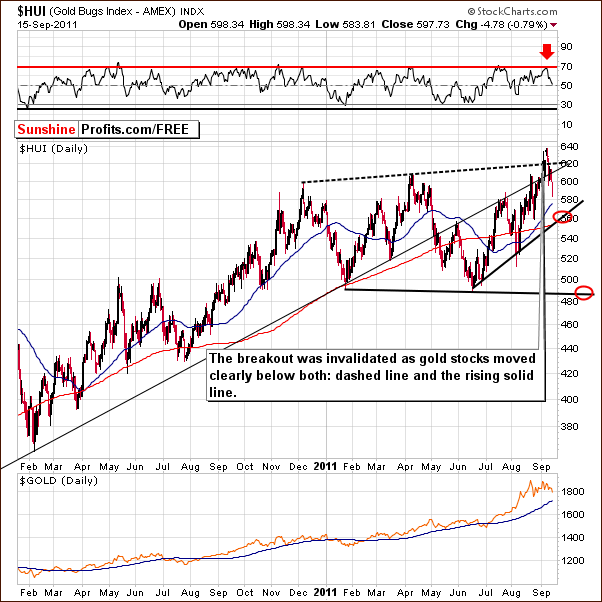
In this week’s long-term HUI Index chart, we also see a breakdown. The recent breakout above the long-term and short-term rising resistance lines has been invalidated and confirmed by RSI levels.
It now appears that this index is at the beginning of a downswing and two support lines will likely come into play. One is slightly above 560 and is our initial downside target based on the closing price levels of previous bottoms. This will likely stop declines for a while but, as in the past, further declines are quite likely.
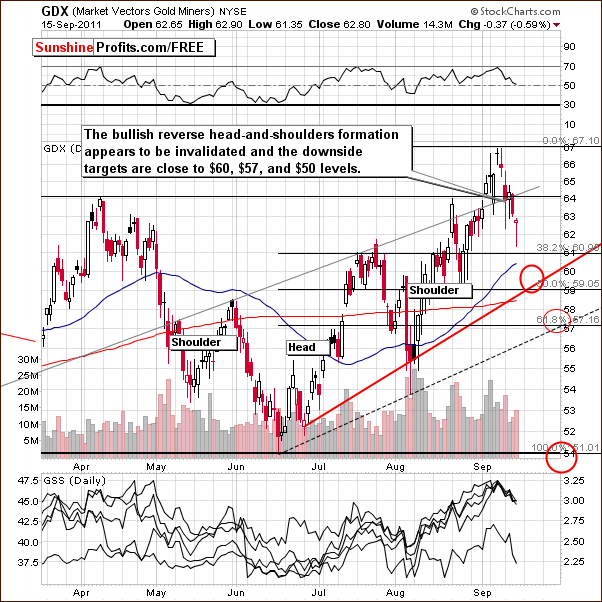
In this week’s short-term GDX ETF chart, downside target levels have been calculated using our previous methodology. Three target levels appear valid with the first being $60, the second being $57 and the last at the $50 level. The recent bullish reverse head-and-shoulder’s formation appears to have been invalidated and these downside target levels should be kept in mind, especially if gold prices decline towards $1,600. Such a development would likely lead to significant declines here and the situation here is clearly bearish at this time.
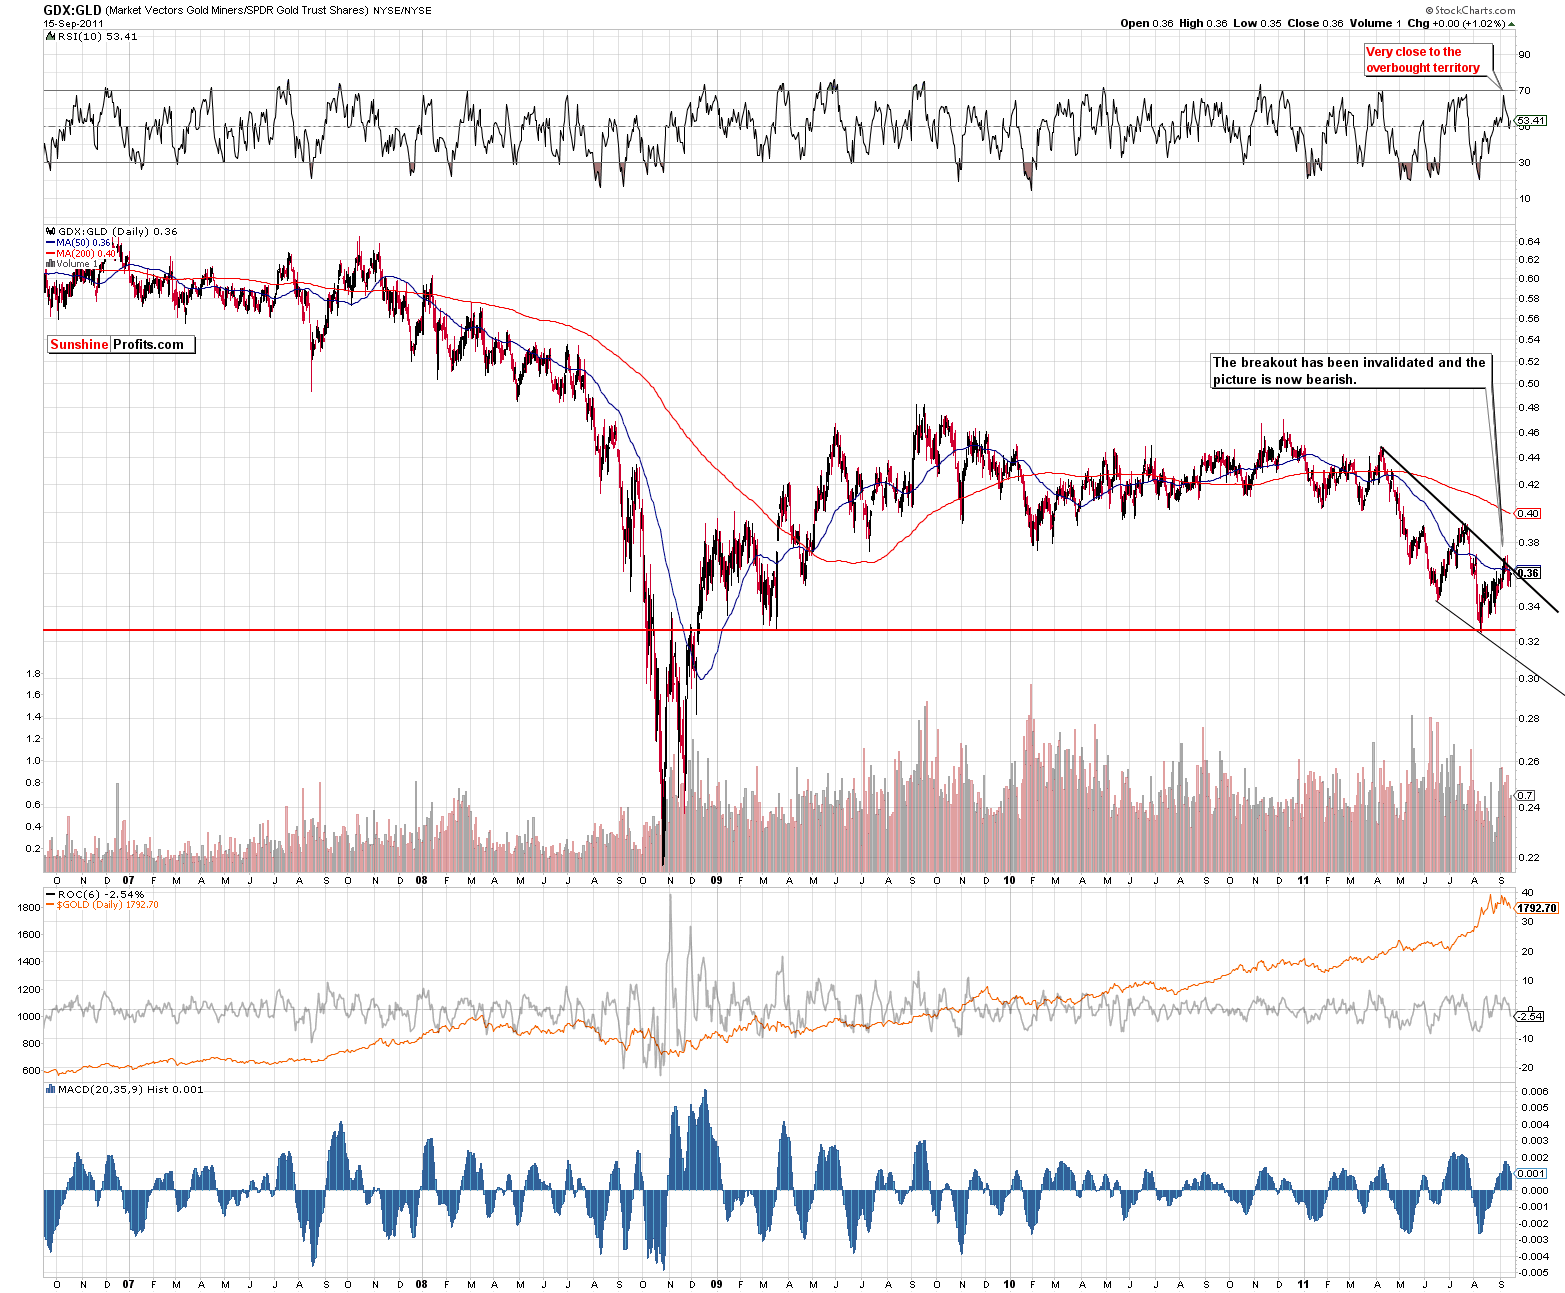
In this week’s GDX:GLD ratio chart (please click on it to enlarge), we see that the recent breakout has been invalidated and the situation is now bearish. The ratio failed to move above the declining trend channel as was the case several weeks ago. At that time, a decline of nearly 18% soon followed. Further declines now appear to be in the cards here and likely target levels are .32 and .31.
Summing up, the situation for mining stocks at this time is bearish and this will likely continue for some time. Holding short positions appears to be justified based on this week’s analysis.
Letters from Subscribers
Q: Could you please comment on the WikiLeaks cable from the U.S. embassy in China? Could it possibly prompt the mutual fund managers who are on the sidelines to start buying gold?
A: Naturally, China is interested in moving away from the USD as a main part of their foreign reserves - dollar's lose value in the long run and using greenbacks to buy gold is one of the best ways for China to do that. This has been a bullish fundamental factor for some time and will likely put upward pressure for gold in the following months and years.
However, this is not likely to impact the short-term moves to any considerable degree - short-term price action is driven by emotions, not logic.
Q: If a gold bullion correction does occur do you feel that a correction will also occur in platinum?
A: Yes, if a correction in gold occurs, we believe that it will occur also in platinum. However, the move from gold to platinum that we mentioned a few weeks ago referred to long-term investments and we don't think that most Investors should trade it - by trading it, you're moving this part of your capital from long-term investment to trading capital - please be sure that you are ok with the overall size of both.
Q: Could you comment on the spike and correction in palladium in the early 2000s. Beginning around 2007-2008, I see that there is a divergent trend line taking the metals in a serious J-curve that are almost a spot on match with the palladium spike.
A: The fundamental situation in palladium was much different in early 2000s than it is the case with gold and silver right now. We don't have producers fighting over last bits of gold and silver as it was the case with palladium back then. You may read more about that topic here. The situation may be similar in silver, however we believe this is will be the case later on, at much higher silver prices.
Consequently, while the aforementioned price moves seem similar, they could be similar in a proportionate way. So - we may see the same shape of rally and decline but the ranges will be bigger. In other words, the J-curve may not be finished at this point, and the true curve will be seen in a few years and after taking a look at the bigger picture (more long term chart). This is in tune with the fractal structure of markets.
Q: Dynamics are changing and have an impact on traditional correlations and related technical analysis. What do you think about this because if I am right, any corrections in gold will be marginal, as pressure is there for it to continue to rise.
A: We generally agree that the main, long-term shift is from USD to gold is in place, however when it will be the case that USD and gold will move regardless of each other, we will see that in our correlation matrix - with long-term coefficients being close to 0. Please note that we've seen a strong rally in the USD accompanied by a move lower in gold.
As far as short-term corrections in gold are concerned, the above long-term shift does not invalidate neither the technical analysis by itself, not does it mean that there will not be a correction in the short run (in the following weeks). Please take a look at the first few charts of our previous Premium Update for details).
Here is what we wrote in the past about the usefulness of technical analysis, and it still holds true today.
September 3rd, 2010 Premium Update:
Well, the most important fundamental that does not change over time is human psychology and emotionality of individual investors. This is something by far more stable that one, two, or even three quantitative easings are not able to change. Will China's growth cause people to stop being greedy when they see higher prices and fearful when they see them decline? Will Europe's problems cause people to act by means of cold logic only? Definitely not. Moreover, even if TA will someday cease to be useful it is highly improbable that it will happen quickly. Certainly, it is not a matter of weeks, months or years because TA's foundations are based on real mechanisms, which are inherent part of each human being.
Q: Could you please comment on this article? According to the bank representatives and manager we spoke with, Austrian banks have now been ordered to restrict the sale of gold and silver bullion purchases and are limiting personal acquisitions of precious metals to 15,000€ (approximately $20,700 USD) at a time, or 11 ounces of gold at today’s prices.
A: While we agree that the above-mentioned regulation is not a step in good direction, we don't agree with the statement made in the article that this is becoming a reality for the whole EU. Just because a country’s GDP per capita is one of the highest in EU, it doesn't mean that others will adopt its policies. In Poland, for instance, there are multiple ways in which one can buy gold and silver and new ones appear to emerge if not on a daily basis, then surely on a monthly one.
There were no other facts to comment on in this article - there are multiple assumptions, hypotheses, and descriptions of author's beliefs, however we would prefer to stick to the facts in order remain objective and determine what's likely and what's not.
The Following Week
If any of our indicators flashes a buy or extreme signal, then the short positions should be closed (and aggressive Traders may even want to go long betting on a bounce). The reason is that declines in the mining stocks very often take the shape of an ABC wave (zigzag). Even if our indicators signal the initial bottom, not the final one, it is very likely that it will be more than one week from today when the decline resumes, so we will be back in our office and report to you accordingly.
Other things that should make you close your short position:
- gold moving to $1,690 - $1,710 and reversing on huge volume, thus creating a reversal hammer candlestick – just like it was the case on August 25th
- gold moving to $1,590 - $1,610 and reversing on huge volume, thus creating a reversal hammer candlestick – just like it was the case on August 25th
- GDX ETF moves to $57.5 (based on the likelihood of bounce even if the downswing is to be continued)
- Silver moves to $34.5
Please note that any of the above signals means closing the short position in the whole sector. For instance, if silver moves to $34, but other signals are not triggered, we would still suggest closing short position in gold and mining stocks.
Naturally the above is not an exhaustive list of what might happen in the coming week, as it’s simply impossible to list all outcomes; however it seems that it covers the most important points. We would normally not suggest opening a position right before taking time off, but the situation appears too favorable not to take advantage of it, and the above points cover most bases, so all in all, we believe having a short position opened along with the list of things that could make you close it is the best approach at the moment.
Summary
This week has seen a significant rally in the USD Index followed by a slight pause which is quite natural. The picture is still bullish for the dollar and bearish for the Euro Index. The important influence of currency markets upon precious metals will likely be quite negative for the following weeks.
The situation on the general stock market remains slightly bullish. Upside target levels could be increased dramatically in the week ahead if stock prices continue to move higher in the next few days. Once again, the implications upon precious metals are slightly negative from this likely general stock market price action.
The breakdown in the precious metals stocks, discussed in last week’s Premium Update, has been confirmed this week in other parts of the precious metals market. This is a bearish development and the outlook for gold and silver is quite negative at this time. The yellow metal has moved below its rising support line. If and when this move is confirmed, much lower prices are likely to follow. Silver has also declined this week and recent RSI patterns are consistent with previous periods of significant declines. This contributes to the bearish picture for the white metal as well.
Our next Premium Update is scheduled for Friday, September 30th, 2011. A quick update on the market situation will be posted as soon as possible when I get back to my office, probably on Monday, September 26th.
This completes this week's Premium Update.
Thank you for using the Premium Service. Have a great weekend and profitable week!
Przemyslaw Radomski

