
This will be an August to remember – no summer “dulldrums” this year. Gold has risen roughly 12% this month, and nearly 30% year to date. Gold prices had a trading range of more than $300 in August.
Stocks are a different story. Wall Street ended the month with losses that came with an extended rout the first three weeks, with the current batch of gains only denting the damage. Since the start of July the FTSE 100 has lost 10.6%. The S&P is down 8.2%. The NIKKEI 225 has lost 8.8%, while the German DAX has plunged 22.6%. By contrast, gold prices have gained nearly 23% over the same period.
September is supposed to be the worst month on the calendar for stocks with losses averaging up to 1.2%, which, after a lousy August, does not bode well. By contrast, physical demand is likely to be strong for gold in the coming months due to expected strong buying from India, the world's largest gold market as the country begins its annual festival season.
The Fed Speaks, Gold Jumps
Tuesday the price of gold price leapt 2.2% in less than an hour hitting $1832 per ounce - still 4.2% off last week's all-time high of $1,917.90. Gold rose on speculation that the Federal Reserve will further ease monetary policy to stimulate the economy. Minutes of the Fed meeting showed that a few members of the rate-setting committee “felt that recent economic developments justified a more substantial move” beyond the central bank’s Aug. 9 pledge to keep borrowing costs at a record low until mid-2013. This bias on the part of some Fed officials toward providing more easing was due to deep concern about the long-term unemployment.
Chicago Fed President Charles Evans said Tuesday in an interview that “We need to do more.” Just that statement was worth $38.20 in the price of gold. This is after Fed Chairman Ben S. Bernanke refrained from announcing additional stimulus last Friday at a meeting of central bankers in Jackson Hole, Wyoming.
Wednesday gold futures fluctuated between small gains and losses keeping above the psychologically important $1,800-an-ounce mark.
Gold has risen roughly 12% so far this month and nearly 30% year to date. At its record high on Aug. 23, the spot price of gold was up 18% from the beginning of August and 35% year to date. It dropped 11% to just over $1,700 within two days of hitting the high. Although plunges can be scary, it gives one perspective when you consider that the correction took gold no lower than it had been trading just two weeks earlier.
Labor Expert’s Job to Help with Jobs
This week the White House tapped Alan Krueger, a Princeton University professor and noted labor expert, to be chairman of the Council of Economic Advisers to help guide the White House through a jobs crisis. (The unemployment rate seems to be stuck at 9.1 percent.) Krueger’s appointment might come in handy as President Obama’s plans his speech to be delivered next week after the Labor Day holiday where he is expected to roll out a plan with “fresh ideas” to accelerate job growth and jump-start the economy. Obama is requesting a joint session of Congress for next Wednesday. In a letter to the leaders of both houses of Congress Obama said it is his “intention to lay out a series of bipartisan proposals that the Congress can take immediately to continue to rebuild the American economy by strengthening small businesses, helping Americans get back to work, and putting more money in the paychecks of the middle class and working Americans.”
He will have to convince skeptical voters that he has something new to offer, but it is doubtful that he has a rabbit to pull out of a hat. He will probably be praying that Congress returns from it vacation willing to work with him.
Coulda, Woulda, Shoulda
Everybody gets to say “coulda, woulda, shoulda” at some point in their investing career. Certainly those who have not yet bought gold have said it to themselves more than once over the past couple of years.
One guy who was deep into lamentations and regrets this week was Pimco’s Bill Gross. The manager of the world’s largest bond fund has admitted that it was a mistake to bet so heavily against the price of U.S. government debt. Earlier this year Gross got rid of US related securities in his $244 billion Total Return Fund. The high profile call that made headlines has backfired as the bond market rallied. As of Monday this week, Pimco’s flagship fund ranked in the 501 spot out of 589 bond funds in its category. No much to brag about. Gross, who is one of the most influential voices in the bond market, warned investors to avoid Treasuries. In the July edition of his widely read Investment Outlook, he warned that promises to American’s aging population made them “debt men walking.”
We appreciate a good play on words and it’s not his fault that investors, for some reason, believe that Treasuries are a long-term safe haven. We would have to express some sympathy with Mr. Gross because we can’t figure out why anyone would consider sovereign debt paper to be a better safe heaven than gold and silver.
The Japanese Like Platinum and So Do We
It seems like Japanese investors are on the same wavelength as we are. We suggested putting half of one’s long-term investment capital into platinum (more on that in the following part of this update), which is exactly what the Japanese are doing of late. The Japanese have been steadily boosting their platinum investments over the last month, tempted by platinum’s stability relative to gold and by the narrowing spread between the two precious metals. Purchases of platinum have actually doubled this month according to a manager at Japan's largest bullion house.
A Japanese physical platinum exchange traded fund backed by metal stored in the country has grown by 38 percent since the end of July.
The spread on the Tokyo Commodity Exchange (TOCOM) between gold and platinum, which is usually priced higher than gold, narrowed this month and fell into negative territory for one day in early August.
Numismatic Mystery
Every once in a while we read stories of the fabled double eagle gold coins that have been the center of international numismatic intrigue for more than 70 years. The story reads like a good detective story, or a summer beach thriller. The only such coin to have ever been auctioned was placed in a bulletproof glass case and was sold for $7.5 million. If your curiosity is aroused, go here.
If your curiosity is aroused by this week’s technical analysis, we’ll begin this week's technical part with the analysis of the Euro Index. We will start with the long-term chart (charts courtesy by http://stockcharts.com.)
Euro - USD Indices
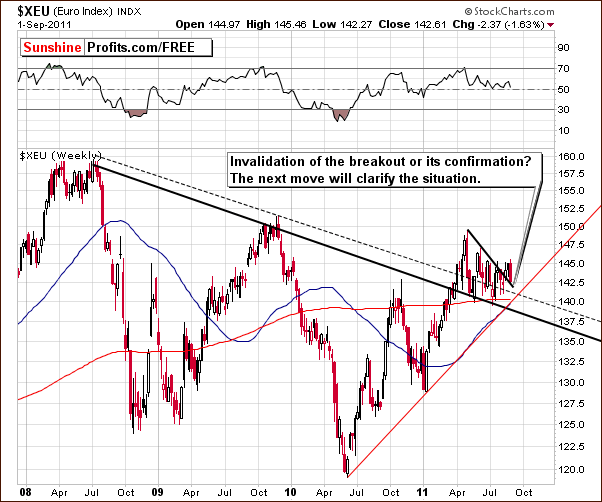
Once again we begin with a look at the long-term Euro Index chart. Last week, we mentioned that what appeared to be a possible breakout would have to be confirmed before we could suggest a further rally for the Euro Index. This week, a decline was seen back to just below last week’s index levels. If a rally takes place from here, the breakout will be verified, but immediate declines will invalidate the breakout and likely lead to further declines. The situation continues to lack clarity today.
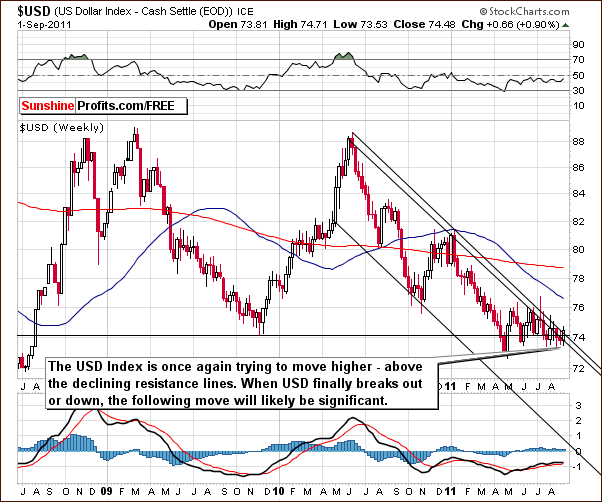
In the long-term USD Index chart, there is no big news to report this week. The index is at the upper declining support line and trying to move higher. Many attempts have been seen, especially over the past few months, and nothing extraordinary has happened yet. We can do nothing but watch this situation at the present time and discuss the possible impacts of both higher and lower moves until one wins out.
In this week’s short-term USD Index chart, we do see a very interesting development. Recall that in last week’s Premium Update, we stated the following:
The currency markets are somewhat at a crossroads now and it seems that the week ahead could greatly clarify the situation. The Euro Index will attempt to hold onto recent higher values and confirm its move above a resistance level while the USD Index looks to break down or (slightly more likely) break out of its recent sideways trading patterns.
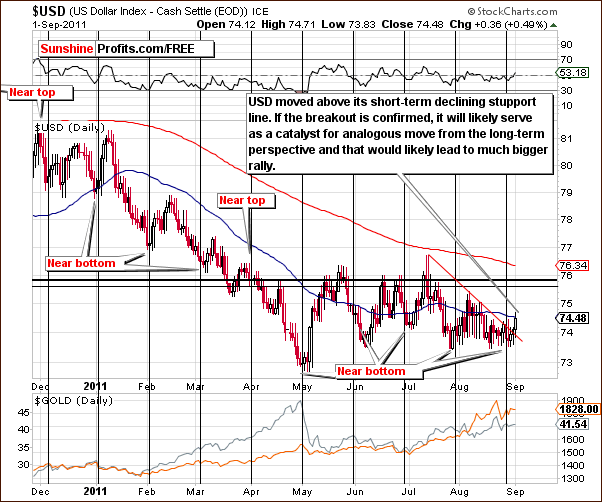
This week we have seen the USD Index move higher and the most important point is that it has moved above its declining short-term resistance line. Even though the breakout has not yet been verified, this is still a bullish development.
This would become an extreme bullish signal if this move ignites a move above the long-term resistance line (seen on the previous chart) which in turn would likely ignite even bigger rally from a long-term perspective. This could bring the USD Index levels up to as high as 78-80 or even higher. Such a move would likely have negative implications for the precious metals sector.
Summing up, the currency market situation remains mixed at this point but there does appear to be a considerable bullish bias in favor of the USD Index. The coming week will likely provide some clarification of the situation.
General Stock Market
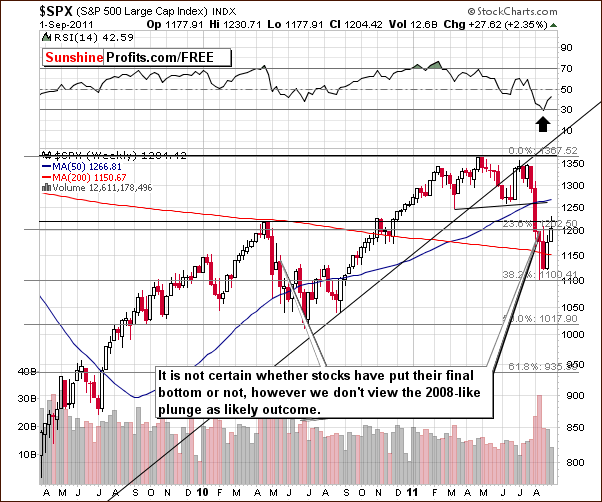
In the long-term S&P 500 Index chart, we see that stocks have moved higher and resistance levels created by Fibonacci retracement and the early 2010 high have been touched. The recent decline leads us to wonder if the bottom has been seen or if more declines will follow and create additional lows.
In 2010, stocks moved sharply higher right after the first bottom only to be followed by a period of successive declines. We cannot rule this same pattern out at this time. It does however seem more likely that higher stock prices will be seen. This is in part due to the recent spike low in the 30-year Treasury bond yields situation discussed several weeks ago. Stocks are simply preferred by many investors over the low-yield Treasuries at this time and it makes sense for some investors to purchase stocks using borrowed money since the cost of borrowing them is likely to stay low for a long time.
Summing up, the general trend for stocks appears more bullish than not at this time. Although another decline could be seen soon, it seems probable that higher price levels will be seen in the not too distant future.
Correlation Matrix
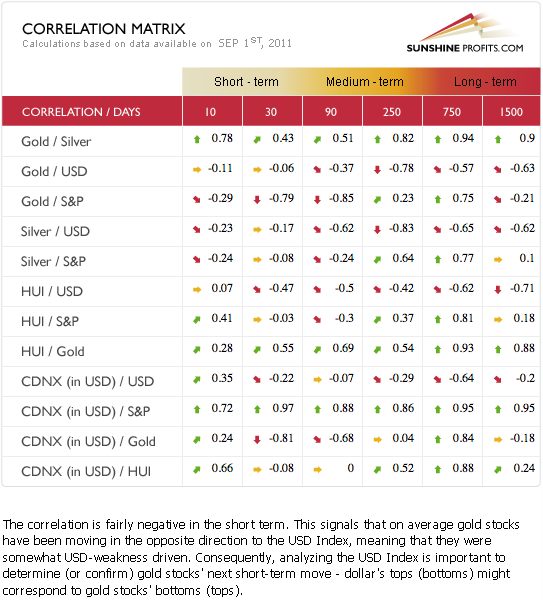
In this week’s Correlation Matrix, we have seen no change in the correlation between gold and the general stock market. The short-term negative bias is still in place. The negative influence of the USD Index on gold stocks is beginning to be seen in the 30-day column but is not yet visible in the short term with gold and silver. The medium-term correlations between gold and silver and the USD Index are negative, however, so a bigger upswing in the dollar will very likely be quite negative for precious metals.
Based on the Correlation Matrix and the current situation in stocks and currencies, the overall outlook for precious metals is rather bearish than not at this time. Further details about this topic will be discussed in later sections of this week’s Premium Update.
Gold
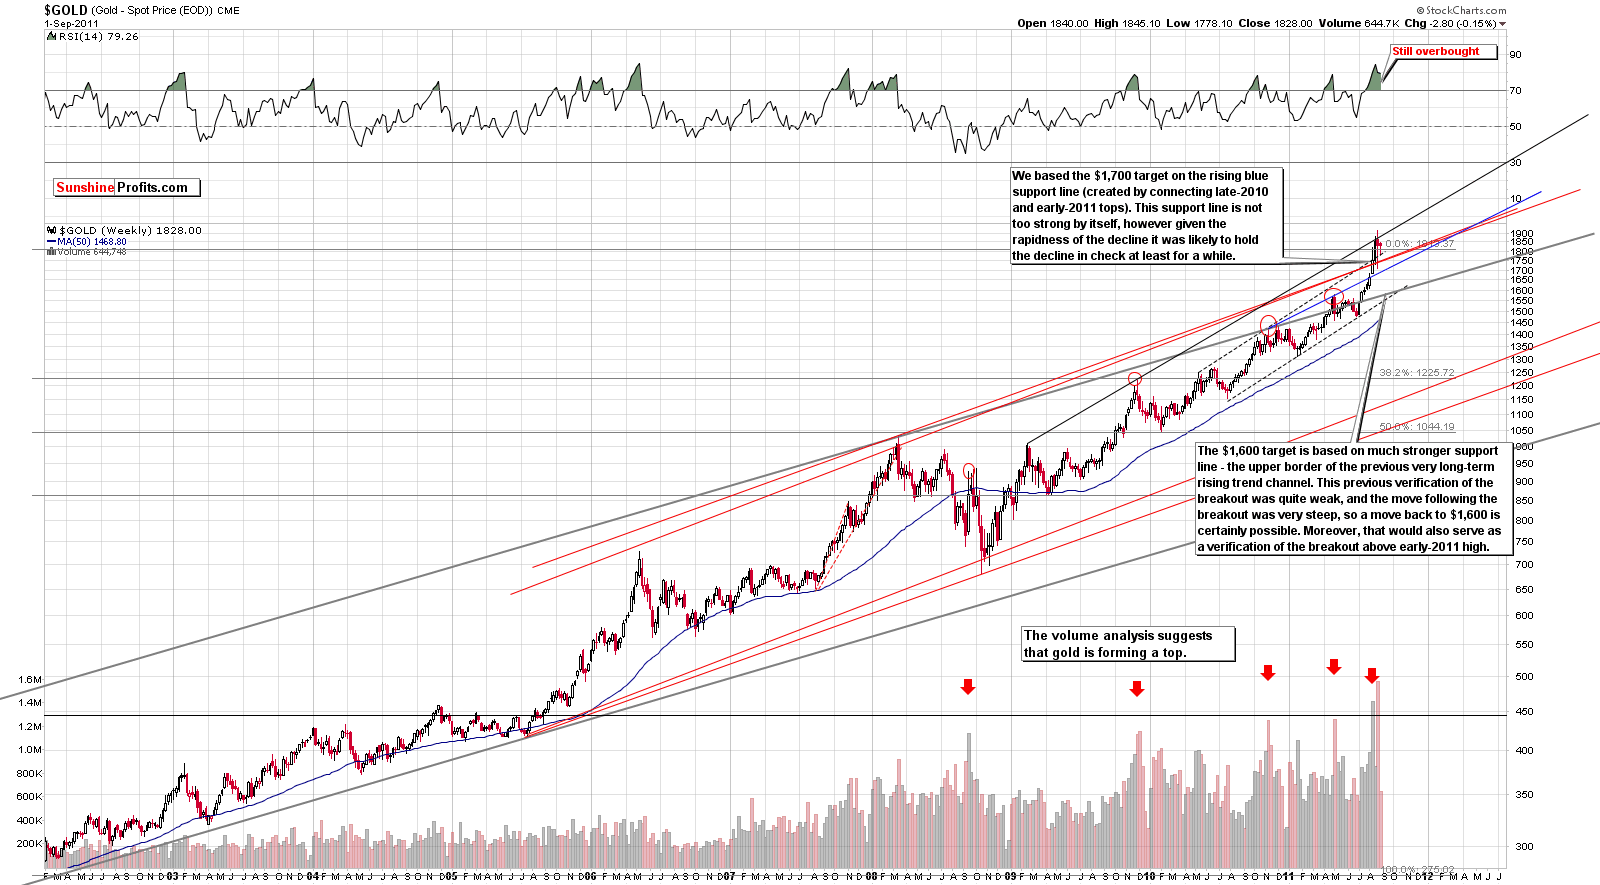
We begin this week’s gold section with a look at the very long-term chart (click on the chart to enlarge). There have been virtually no changes over the week and Thursday’s closing price is quite close to where it closed back on August 18. The RSI is still in an overbought range and it still seems probable that gold’s price will eventually decline to the strong support line in the $1,600 range. This may not be seen for some time, that is, not within the next week or two. More details will follow in our discussion of gold’s other charts.
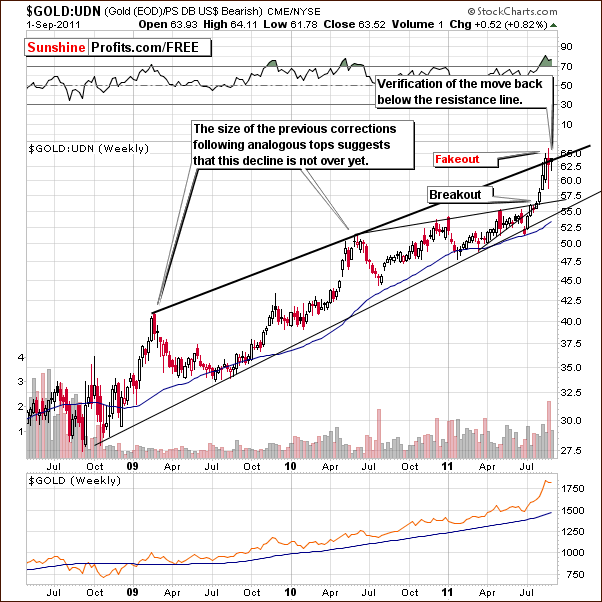
In this week’s long-term chart for gold from a non-USD perspective, we also see RSI levels in the overbought range. Gold’s price here moved to the rising support/resistance line thus most likely verifying a move back below this line. The situation is tense at this time, for higher price levels could lead to a true breakout and further declines would be a confirmation of the recent fake-out. If the latter is seen, significantly lower prices are quite likely. From a non-USD perspective, gold is definitely at a crossroads.
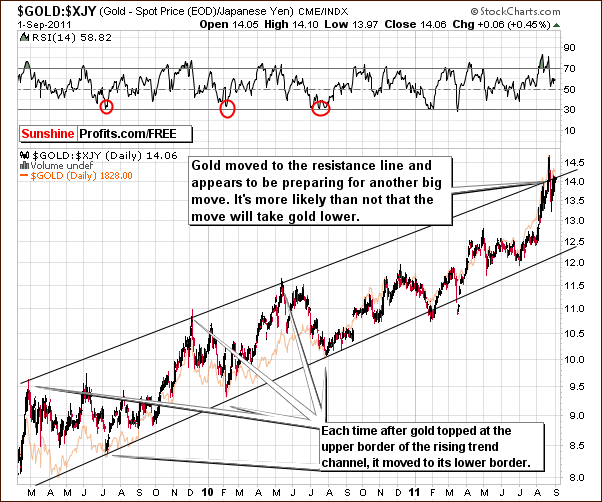
Looking at gold from the perspective of the Japanese yen, we see very much the same situation. RSI levels here bottomed close to the 30 level after considerable price corrections began. Note that in this chart, each time gold moves to the upper border of the rising trend channel, a decline back to the lower border follows.
If history is to repeat itself, this could be seen once again, perhaps in the coming weeks. The exact timing however remains to be seen. The initial downswing after the resistance level had been reached, was already seen, so the short-term outcome is not too certain. Gold’s price presently is right at the rising resistance line and a move up could be seen before any significant decline. Anyway, once the second top will be in, then gold will likely move considerably lower.
Please note that the analysis of the above chart is useful not only for those, who use yen for purchasing gold – since we live in globalized economy and capital can flow (almost) freely through borders then we can expect similar markets to confirm each other. Thanks to analyzing them in addition to analyzing the main market (here: gold) we can gain additional insight and thus get a clearer picture of what’s really taking place and what’s likely to happen next.
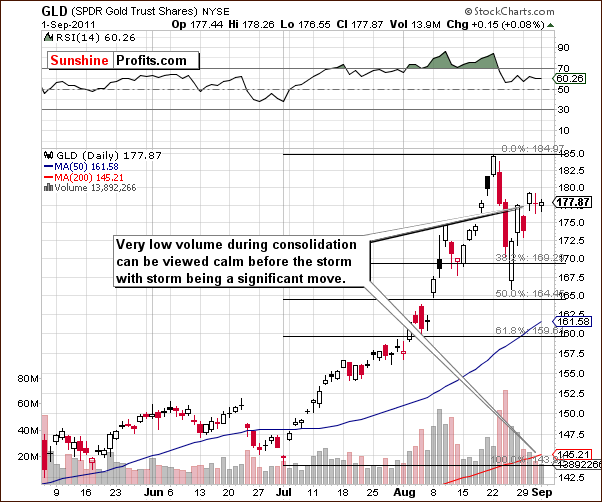
In the short-term, GLD ETF chart, nothing overly significant has happened this week. Volume levels have declined, which suggest that we could be on the verge of the beginning of a big move. The RSI seen from this perspective is no longer overbought and it is possible (not overly probable though) that gold’s prices could again rally and approach the $2,000 level. A local top in approximately this range would likely be followed by a decline to the $1,600 range. On the other hand, a quick move down from where gold is today is also a possibility. The coming weeks will likely continue to see high volatility for the yellow metal – unlike what we’ve seen in the past few days.
As we enter the month of September, it is important to note that gold traditionally performs quite well in the early, post-summer period – which is naturally a bullish factor here. Gold has recently approached the $1,900 level, fueled by media hype and politics. Its popularity has almost been too excessive and this is a bearish factor.
From a technical standpoint, the situation is quite mixed, so overall it seems this is the best description for gold on the whole. Since there is truly not too much to tell right now, we feel it best not to create any type of bias from such a blurred picture. We will continue to monitor this situation, search for new clearer signals, and discuss appropriate trading strategies accordingly.
Summing up, the situation overall for gold is mixed at this time following a week in which very few developments were seen. The situation is likely to become much clearer in the next week or two and we will continue to keep you informed as more details become available.
Silver
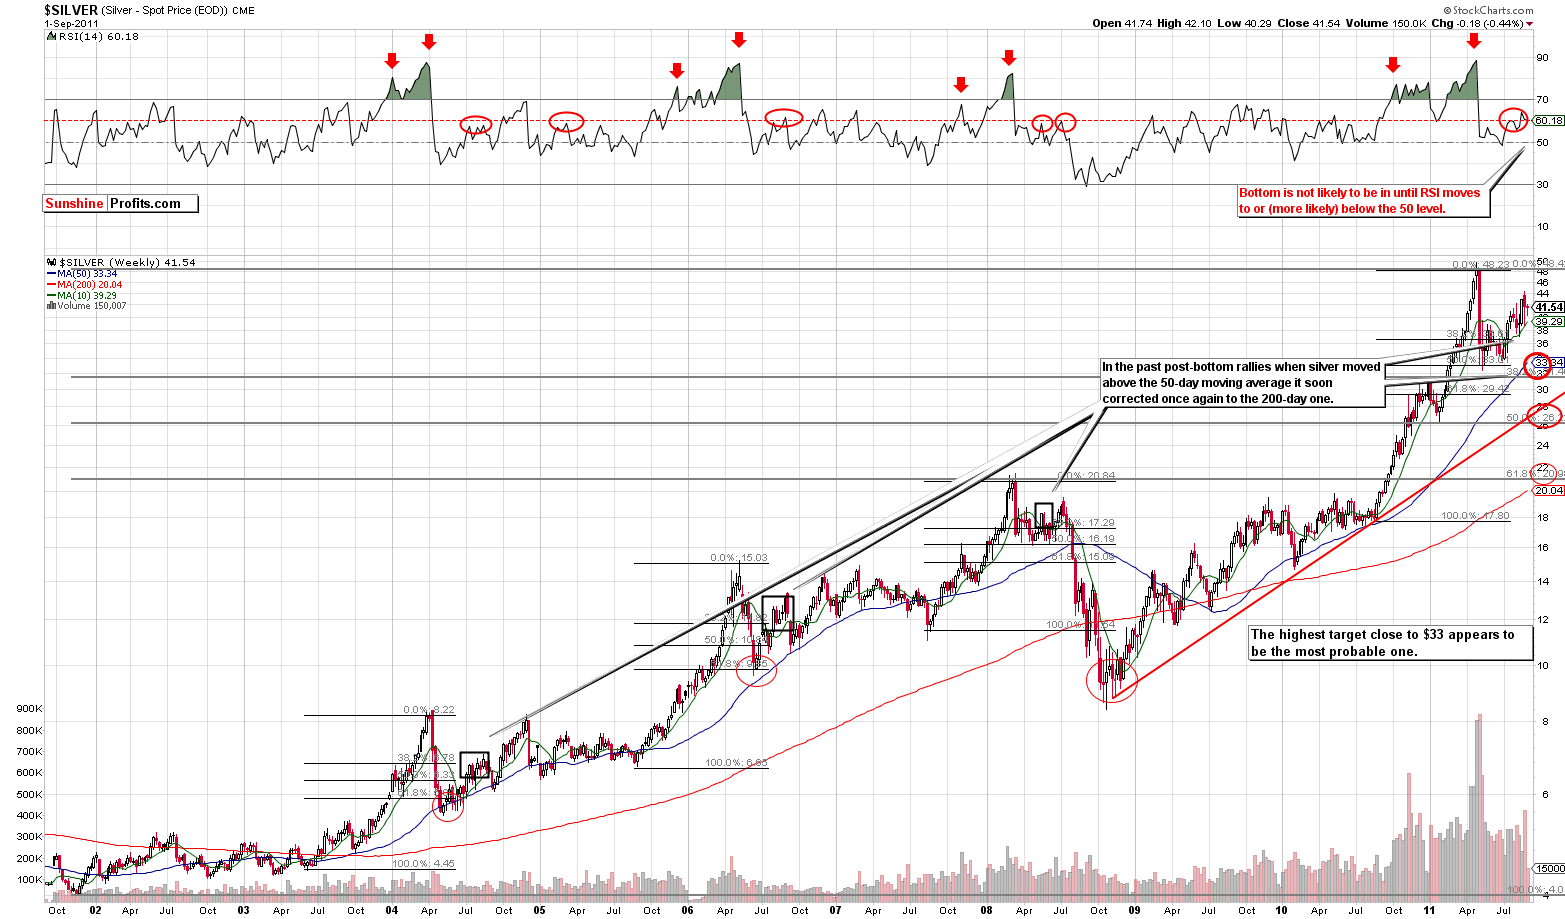
In this week’s long-term chart for silver (please click the above chart to enlarge), little has changed in the past week. Silver’s price moved down a bit and then back up. The RSI formed a double-top with the second top a bit higher than the first. This is a pattern similar to what has been seen in the past.
A decline from here is more likely than not. The situation for the white metal appears more bearish than that of gold at this time. In fact, the situation for silver actually prevents us from suggesting an aggressive bet on higher gold prices in the short term.
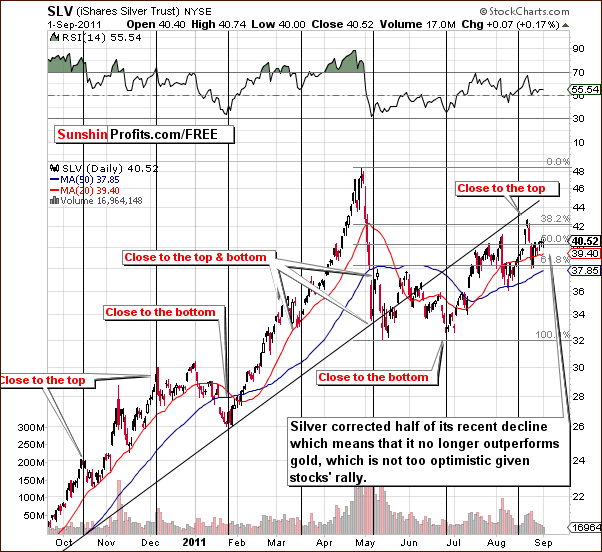
In the short-term SLV ETF chart this week, it appears that a local top has formed very close to the cyclical turning point. The most recent price rise is equal to approximately one-half of the previous decline which followed the local top seen early last week. This is a bit smaller than gold’s recent price increase and clearly points to silver’s failure to outperform the yellow metal recently. Silver investors have likely been disappointed especially when considering recent increases in both: stock and gold prices. This is not usually the case due to silver’s industrial uses and long-term positive correlation with the general stock market.
Summing up, the situation is a bit less favorable for silver than for gold at this time, though it is still best described as mixed.
Platinum
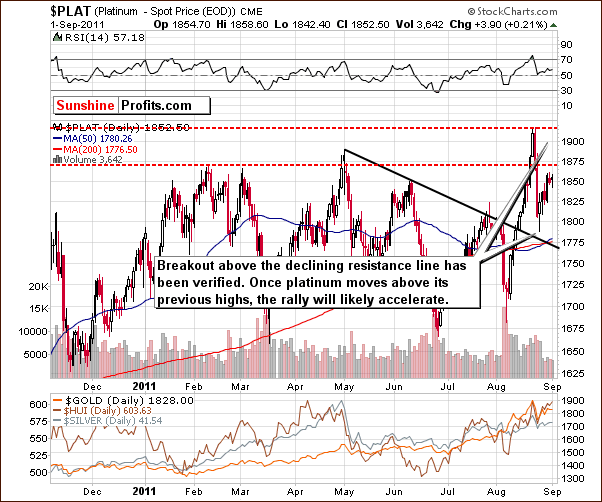
In this week’s short-term platinum chart, we see a confirmation of the breakout above the declining resistance line. Platinum’s price is now higher than gold’s and if and when it takes out its previous 2011 high, we expect to see an acceleration of its price rise. This will be even more likely if prices in the general stock market continue to move higher.
Gold and Silver Mining Stocks
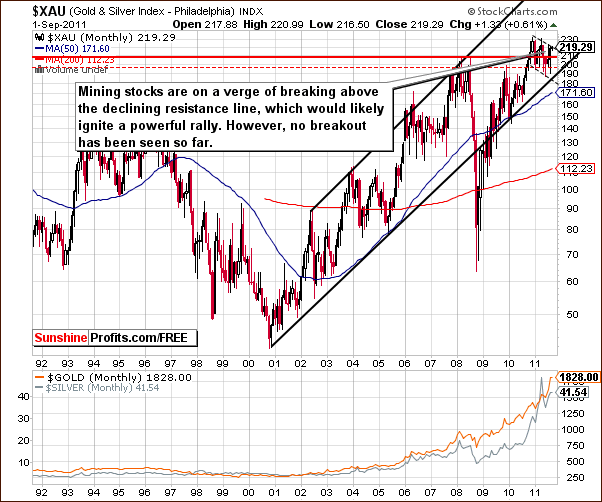
In this week’s very long-term XAU Gold and Silver Index chart, we have a situation which is quite mixed once again. The sideways price movement has been seen since late 2010 and attempts to move above the level of previous highs continue to be seen. A powerful rally would likely follow if this move is seen but our skepticism continues until such a breakout is seen.
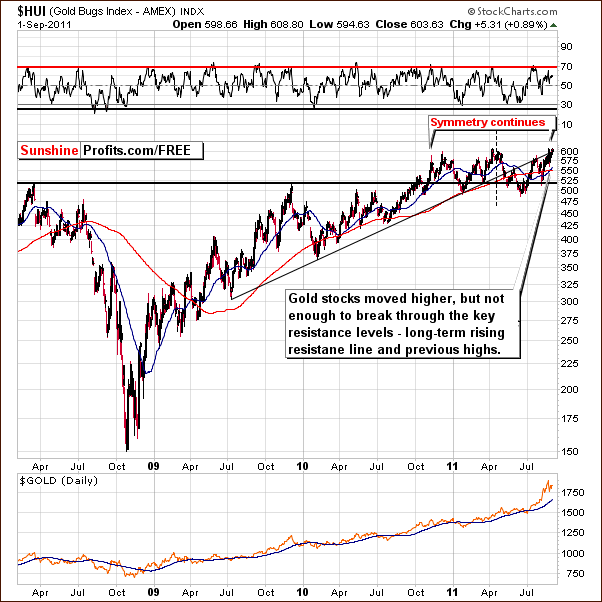
In this week’s long-term HUI Index chart, we did not see the plunge which would be in perfect tune with the symmetric pattern. However, this symmetry does not have to be perfect. The single spike high did not appear as in the past, but if gold stocks decline from here, the price action will still be similar to the previous decline. Based on this chart alone, the situation is bearish as no breakout has been seen and the basic symmetric pattern is still in place to some extent.
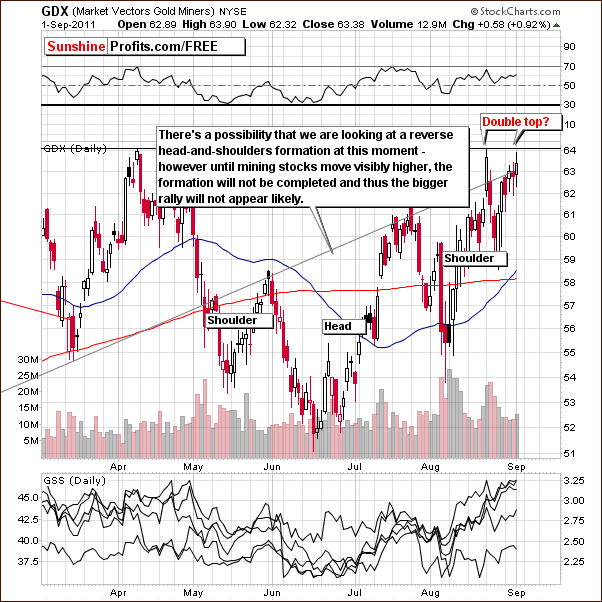
In this week’s short-term GDX ETF chart, we actually see some bullish price pattern in the form of a reverse head-and-shoulders formation. If this pattern is completed, it will likely lead to much higher prices but we would need to see gold’s stocks move above previous highs and verify the breakout.
Based on this chart alone, a rally appears likely due to the recent trading pattern. However, there is also a possibility that we are seeing a double top right now. We are truly at a crossroads and the breakout or breakdown which is yet to come will likely determine a much bigger move in the same direction.
Summing up, the situation for mining stocks is mixed overall. The recent move to previous highs is bullish since the underlying metals did not follow or lead the mining stocks. A truly bullish situation would be a move above previous highs here and a verification of this breakout. This has not yet been seen, so the situation remains mixed and we will keep you updated in the days ahead as it plays out.
Juniors
As stated in the Key Principles section, the list of top juniors will be updated approximately every 4 weeks, so this is the Update that should contain the revised version of the list.
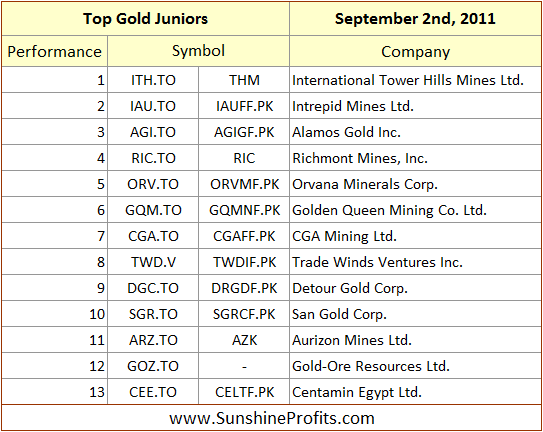
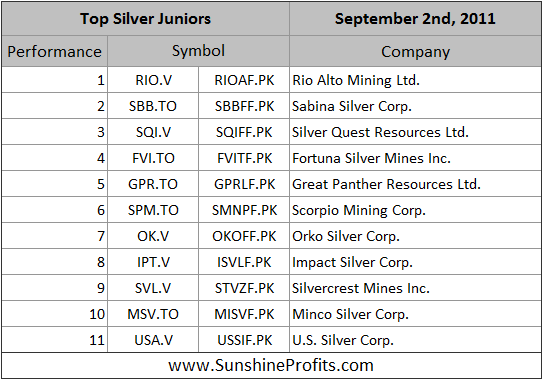
There are no major changes this week, other than our decision to remove GORO (Gold Resource Corporation) from our gold ranking based on information included in the company’s latest quarterly earnings and low quality thereof in our view (note the average price for gold sold - that's the highest gold price in the reported period reported as average - either GORO was very lucky to close the deal for its whole production at this price or it suggests some non-market endeavors) and other fundamental factors. The story is covered in detail here.
We had first suggested buying GORO in the very first Premium Update ever posted (March 27th, 2009). At that time the price was $4.2, so with the stock now at $22.91, this investment wasn't bad at all. However, we believe is the time to cash in.
At this moment we continue to favor senior mining stocks to juniors (we suggested moving from juniors to senior mining stocks on March 15th, 2011), however this may change once the general stock market confirms its move up and our SP Long-term Junior Indicator flashes a buy signal.
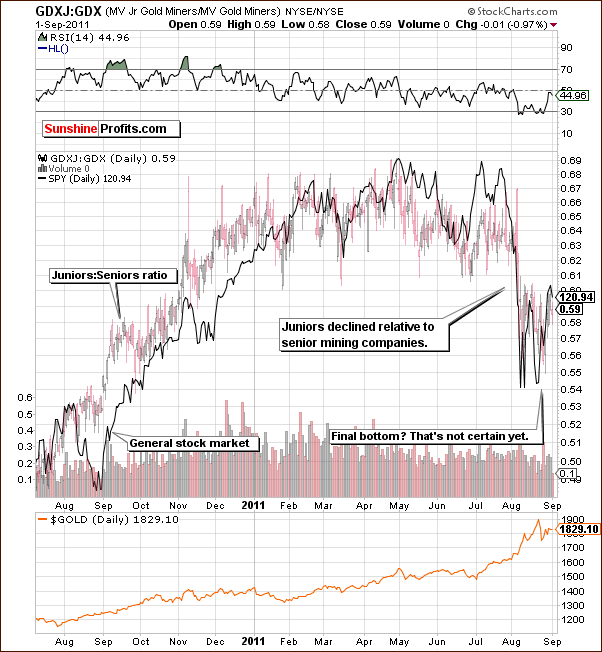
At this point it’s not certain that the bottom on the above chart is already in. Once the bottom in the featured GDXJ:GDX ratio is in, and the ratio rallies, it will mean that bigger gains (or smaller losses) will be associated with investing in the junior mining companies rather than in the big senior miners. We will keep you informed.
Letters from Subscribers
Q: When you recommend going long in a speculative position do you recommend doing it with GLD and SLV? Do you recommend leveraging such as buying contracts or margin? Should I be margining SLV or buying gold contracts? I am constantly reading about gold and silver prices dropping after margin requirements are changed. I understand a great deal more money can be made leveraging when it is certain that the bull will run. Please let me know what I should obtain and where I should obtain it.
A: We cannot recommend margin, nor can we advise against it - we're not investment advisors. It's not a matter of our suggestion but rather a matter of your risk tolerance, portfolio size, experience in trading, etc. The point is that the answer would be different for each Subscriber and we cannot make one single universal recommendation here. You will find more information on our approach here.
However, there's a simple rule that might be useful here. If you're a beginning investor, then most probably, leverage is not a good idea, especially since you plan to trade in silver, known to be very volatile. GLD and SLV ETFs are ok as trading vehicles, but we don't recommend them as a way to buy gold/silver for the long term.
Q: I am fairly convinced that I want to play gold with a long call option with a maturity till September 2012. Gold is volatile but with the serious headwinds in Europe and the US, if things head to a recession and a banking crisis, gold stands a very good chance of a big climb. If this happens, I believe it will play out by September 2012 latest. I am happy to pay the long call premium just to have this option play which I can exercise should things go seriously south. The question is at what strike price? I though of a strike price at either USD 1850/oz or 1900/oz. What are your thoughts on this? I realize it is only your opinion and I am totally responsible for my own investment decisions, so any disclaimer you wish to add to your opinion/thoughts is perfectly ok with me. Let me also say I think very highly of your site and updates.
A: As far as long-term bets on higher gold prices are concerned, at this point, gold options are not our first choice. The reason is that the volatility has been huge recently and this boosted options' values (you will find more information here.
However, if you are interested in finding the optimal strike price for a given series of options, we recommend one of our tools which will allow you to compare the profitability between optimal options and ATM ones (it will do much more than that, actually). You will find our Pyramid Optimizer in the tools section.
Q: Are you only half long with long-term capital and is one half of that in platinum? What do you mean by saying “no changes in the long-term capital”?
A: There are no changes in our views regarding the long-term capital meant that assuming that someone is following our suggestions from the portfolio structure page, then:
- 30% in physical gold and silver held as insurance against sudden financial turmoil,
- 20 - 40% held in cash (dedicated to speculation),
- 30 - 50% dedicated to long-term investments out of which:
a) silver part is half-way in cash or in platinum
b) gold part is half-way in platinum
This means that if the portfolio was 50/50 gold/silver before we suggested including platinum, it's currently:
- 0 - 25% in cash
- 25% in silver stocks
- 25% in gold stocks
- 25 - 50% in platinum
In terms of the total portfolio we have:
- 30% in physical gold and silver held as insurance against sudden financial turmoil
- 20 - 40% held in cash (dedicated to speculation)
- 0 - 12.5% held in cash (that is not to be used for trading purposes)
- 7.5 - 12.5% in silver stocks (long-term investments)
- 7.5 - 12.5% in gold stocks (long-term investments)
- 12.5 - 25% in platinum (long-term investments).
Percentages vary because of one's individual preferences toward trading / investing in the long term.
Summary
The situation in the USD Index is mixed and is more bullish than it has been for the past several weeks. The price action seen in the coming week will likely determine the direction of the currency markets for some time to come.
Stocks have a mixed outlook as well but with a bullish bias. Although additional declines may be seen in the coming weeks, at this point it does not seem that prices would move much below the recent low. This would finally bring 2011 in line with the historical trend of higher stock prices in the year preceding US Presidential elections.
All in all, the currency markets and stocks have created a rather negative environment for precious metals. September, however, is traditionally a strong month for gold, silver and the gold and silver mining stocks and the situation is therefore mixed for precious metals overall. Several technical formations do not clarify the situation at this time.
Generally speaking, precious metals are at a crossroads with gold at several support levels and mining stocks at the level of previous highs and resistance lines. There is also a bullish reverse head-and-shoulders pattern under development for gold mining stocks. The situation appears least favorable for silver with RSI levels suggesting lower values quite soon.
It seems that mining stocks could ignite another rally in the precious metals sector, but that would be the case only after they manage to break out above their previous highs and this breakout is verified (for instance by 3 consecutive closes above previous highs in XAU, HUI and GDX).
At this point, additional signals are needed to accurately project where the markets will eventually move. If stocks do indeed rally, perhaps a move from seniors to juniors would be profitable but it is far too early to make any such suggestions at this time. We will continue to watch the markets, all of which are generally somewhat following unclear paths presently and inform you as the situation plays out.
Our next Premium Update is scheduled for Thursday, September 8, 2011 (one day ahead of our regular schedule).
This completes this week's Premium Update.
Thank you for using the Premium Service. Have a great weekend and profitable week!
Przemyslaw Radomski

