
To quote Charles Dickens, this week was the best of times, it was the worst of times.
This week Qaddafi was finally cast out, Dominique Strauss Kahn was cleared, Japans’ credit rating was cut, Washington quaked and everyone waited with bated breath for the words from Jackson Hole, Wye.
Oh, and we forgot to mention, gold skyrocketed to $1900 at the beginning of the week and then plunged in one of its worst days Wednesday when gold prices tumbled a whopping $95.80, or 5.1%, to settle at $1,765.50 an ounce -- the lowest level in a week. To keep things in proportion-- gold started the year just above $1,400 an ounce.
Also this week SPDR Gold Trust's total assets surpassed that of the SPDR S&P 500 ETF, making GLD the largest exchange-traded fund in the world for the first time. But also to keep things in proportion, the assets of the Gold Trust ETF are still trivial compared to the trillions held in equities and bonds. Four times as much money is held in Apple (AAPL) stock alone. Naturally, there are many other ways to own gold, but in general, this means that not that many people own gold despite all the hoopla.
The Federal Reserve is holding its annual symposium in Jackson Hole, Wyo., this weekend and all eyes are on Federal Reserve Chairman Ben Bernanke when he addresses the group today. It was at last year’s meeting that Bernanke hinted the Fed would start another round of asset purchases to stimulate the economy and about three months later the Fed announced the $600 billion bonds purchases, later dubbed QEII. And that, folks, was one of the contributing factors for gold hitting $1900 this week.
But it doesn’t really matter to gold what Ben Bernanke will say. If there's QE3, gold should go up in the long term. And if there's no QE3, gold still will go up. The higher inflation and weaker dollar that QE3 would likely cause would be positive for gold, which is known as an inflation hedge. No QE3 would mean a zero-rate policy may continue for more than a while (even longer than they already pledged), which is an ideal environment for gold to grow. A new round of quantitative easing is not likely to be met with approval from the emerging world, particularly China, or other large holders of U.S. Treasuries and U.S. dollar-denominated assets.
No matter what is said in Jackson Hole, there is no doubt that the US economy is in a deep hole. The uncertainty surrounding the U.S. deficit-reduction debate has fueled concern about a U.S. default, potential destruction of the U.S. dollar along with fears of a global recession or depression.
Those that argue that gold is overvalued from a long-term perspective are not looking at the right numbers. They ought to be looking at Europe's banks and at the amount of short-term obligations that are sitting on the U.S. Treasury's books.
Some think that the bull market in gold is over, that the rally has extended too far too fast in recent weeks. Gold has gained nearly 9 percent in just six sessions before Tuesday's fall and by more than $400 since July. Do the ugly declines of the recent days spell the end? Here are a few fundamental items to reassure you otherwise:
- Fears about eurozone sovereign-debt default are still running high, as are concerns about the possible breakup of the euro zone.
- Rising inflation in China and in rising food prices around the world support the price of gold as fiat currencies lose purchasing power. The price of gold is a “mirror, mirror on the wall” that reflects back the lack of faith in fiat currencies. Despite the recent plunge, gold is still the “fairest of them all.”
- Central banks have become large buyers of gold and will likely purchase more this year. Emerging market central banks are joining in increasing worldwide demand. Venezuela has repatriated its gold from vaults in London.
- Heavyweight economists such as the World Bank’s Robert Zoellick, ex–Fed chief Alan Greenspan and Nobel Prize winner Robert Mundell have all suggested a more important role for gold in the global financial system. In Alan Greenspan’s case, it’s quite ironic statement after he kept interest rates at artificially low levels for a long time that eventually created many asset price bubbles (real estate being the most visible example).
The thing that can cause some worries is the fact that gold has become a cocktail party centerpiece and has attracted lots of media attention. But how many of your friends actually own gold instead of just talking about it?
There were some rumors floating this week about Hedge Fund Manager John Paulson who has suffered some major losses on financials and some $500 million on a bet on HP. Paulson's flagship Advantage Plus Fund has plummeted 34% this year through the first two weeks of August, according to a CNBC report late Wednesday.
What does that have to do with the price of tea in China? Nothing. But it could have some impact on gold. Paulson is one of the largest holders of the god ETF, GLD, and there are worries that he might need to liquidate some of his gold holdings to cover his other losses.
It just goes to show that even a brilliant investor like Paulson, who made a fortune predicting the 2008 financial meltdown, can make the wrong call. It’s never easy to predict the global economy — especially in today’s volatile world. This is without a doubt a cautionary tale.
Another rumor floating around was fears that the CME might increase the amount of money it takes to buy a 100 ounce gold futures contract -- a technique often employed to stem volatility. Silver was the latest victim of margin hikes and is still recovering. The CME raised margins five times between April 26th and May 9th a massive 68% that eventually resulted in silver losing almost 30% of its value in less than 3 weeks. If the same fate were to befall gold, prices could theoretically tank to $1,400 an ounce.
However, the CME has raised margin requirements for gold twice this year, once in January and once in early August, by 11% and 22% respectively. The moves did little to stem gold's rally – at least immediately after the release. A week after the margin hikes in January gold was down just 2% and a week after the August hike gold was up 1.5%.
Without a doubt we’re living in historic times as the financial world wrestles with fallout from the recent meltdown, the ongoing possibility of sovereign-debt defaults, and political uncertainty across the globe. To quote Dickens: “It was the age of wisdom, it was the age of foolishness, it was the epoch of belief, it was the epoch of incredulity, it was the season of Light, it was the season of Darkness, it was the spring of hope, it was the winter of despair.”
To see if this week will bring hope or despair let’s begin this week's technical part with the analysis of the Euro Index. We will start with the long-term chart (charts courtesy by http://stockcharts.com.)
Euro - USD Indices
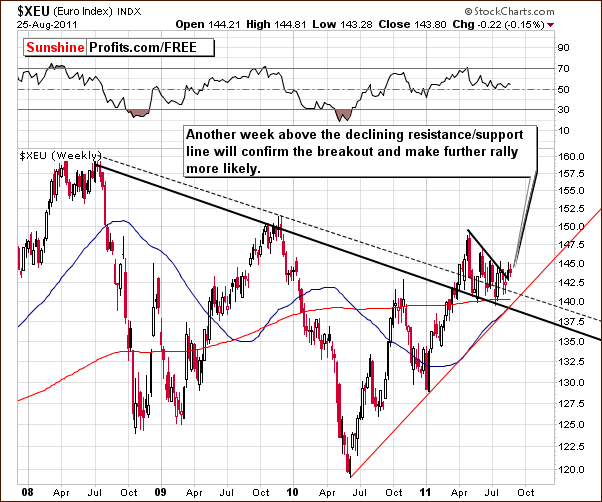
In the long-term Euro Index chart this week, we see an attempt to verify the breakout above the declining resistance line. The success of this move is yet to be determined. It appears that an additional week above the declining resistance/support line is needed before we can suggest that higher values for the Euro Index are likely.
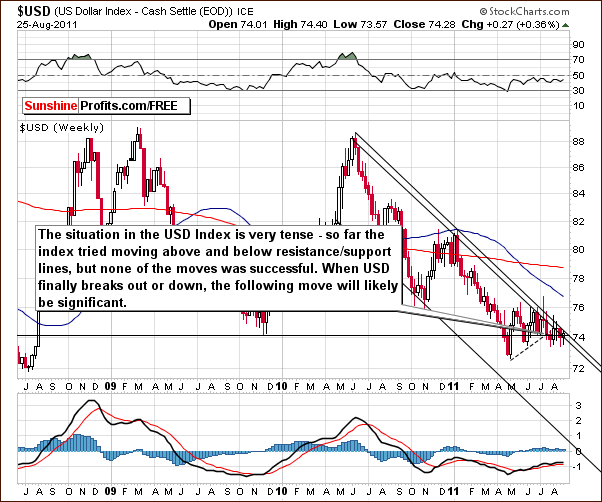
In the long-term USD Index chart, we continue to see a very tense situation. The index value is currently right at the apex between the declining resistance line and the support line based on the November 2009 low. The next significant move up or down will likely clarify the direction and allow us to estimate the next big move for the dollar.
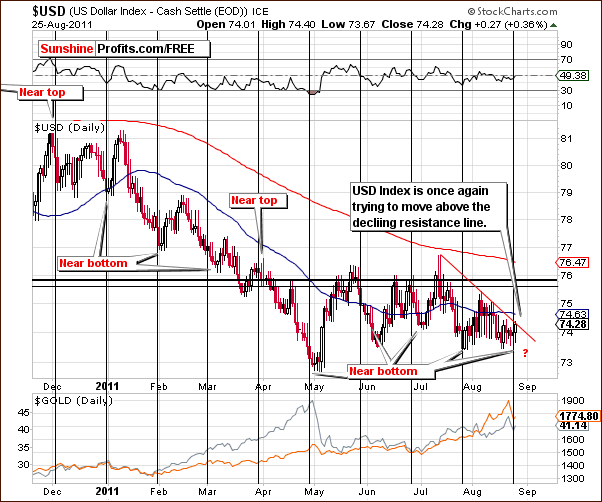
In this week’s short-term USD Index chart, we also see another declining resistance line in play. The index is trying to break above this short-term resistance and is also right at a cyclical turning point. At this point a move higher would be very much in line with the general tendencies (previous turning points after a decline) of the past. The probability of rally is somewhat better than it was a week ago, but we still prefer a wait-and-see approach right now before declaring that a big rally is in the cards for the USD Index.
Summing up, the currency markets are somewhat at a crossroads now and it seems that the week ahead could greatly clarify the situation. The Euro Index will attempt to hold onto recent higher values and confirm its move above a resistance level while the USD Index looks to break down or (slightly more likely) break out of its recent sideways trading patterns.
General Stock Market
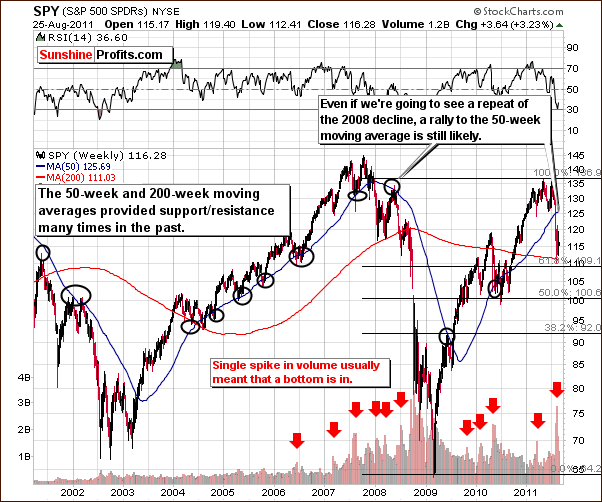
In the very long-term SPY chart, we see a local top signal from analysis of both volume and Fibonacci retracement levels. In addition, there are two reliable (with proven track record – as seen above) support and resistance factors in play: the 50-week and 200-week moving averages.
The SPY ETF just touched the 200-week moving average and a rally from here is likely. At this point we do not expect the 2008 plunge to repeat. However, even if that is going to be the case, then we would still likely see prices move higher - perhaps towards the 50-week moving average before the decline continues.
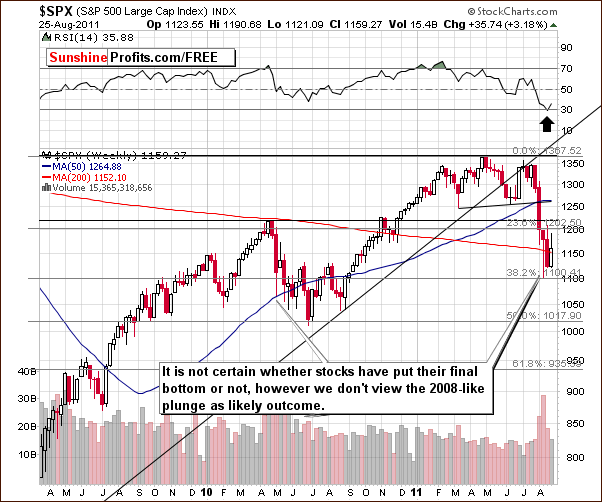
In the S&P 500 Index chart this week, we have seen a decline to and a possible bottom at the 38.2% Fibonacci retracement level. This has been confirmed by the RSI indicator. Although we could still see a sideways trading pattern, the size and rapidness of the recent decline leads us to believe a bigger rally from here is more likely than not in the coming weeks.
Summing up, although stocks could move either way from here, it is more likely that higher prices will be seen in the short term. The direction of the market beyond this timeframe is uncertain.
The expected rally from here would likely have a negative impact on gold and silver and somewhat less on platinum. We will continue to monitor the situation and report to you accordingly as more details emerge.
Correlation Matrix
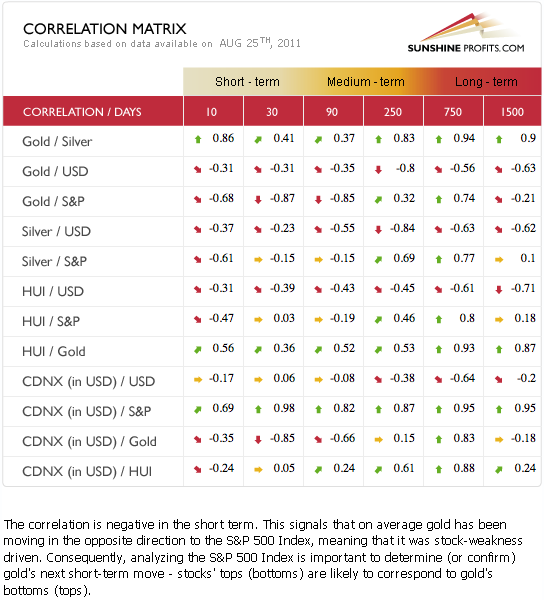
In this week’s Correlation Matrix, we see that a move higher for the general stock market would likely have a negative effect upon the precious metals sector and especially upon gold. Lower gold prices would likely be followed by lower silver prices, not because of the general stock market rally, but because of gold’s price decline. This would likely impact gold and silver mining stocks as well. Overall, the precious metals – stocks link has changed very little since last week from a correlation perspective.
Gold and the USD Index have begun to return to being negatively correlated though not yet to a significant degree. This development makes any rally in the USD Index more likely to send gold’s price lower than has been the case over the past few weeks.
Gold
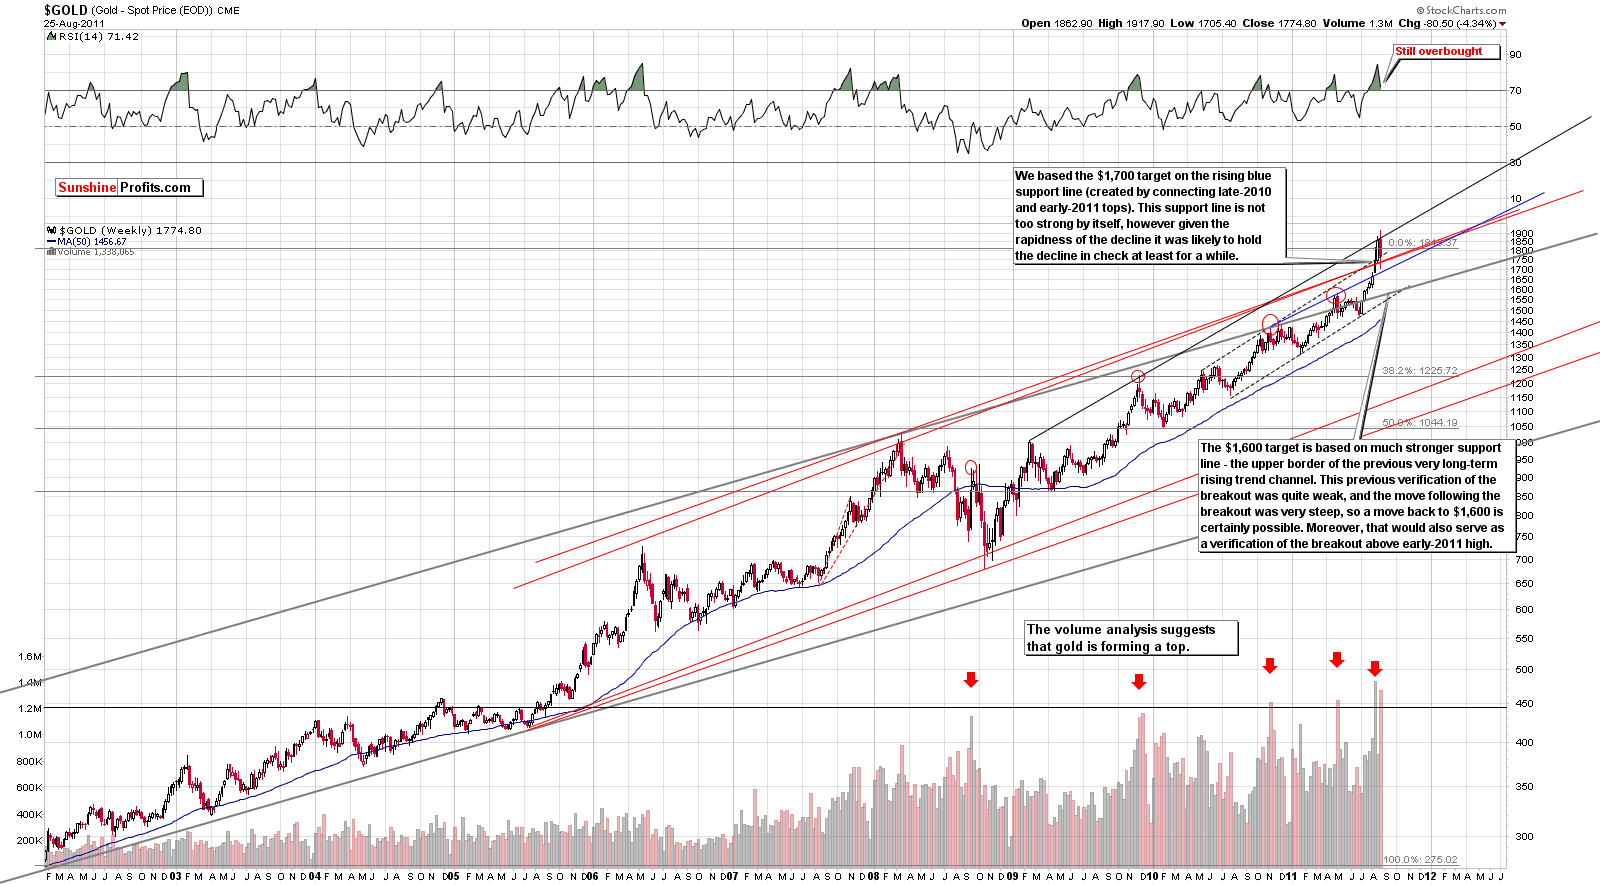
We begin this week’s gold section with the very long-term chart for gold (click on the above chart to enlarge it). Early in the week, gold appeared ready to break above the final resistance line. If it had confirmed its breakout, we would have most likely seen a continuation of the parabolic upswing. At this point opening short positions was very risky. The breakout was quickly invalidated, as a quick move back below the black line held and we then issued our Market Alert on Wednesday stating that a further decline will likely be seen:
Gold moved sharply lower today and yesterday, so the question is if the big move lower is upon us or was that just another mid-rally correction. We believe the former is more likely, so traders may want to short gold, silver and mining stocks at the moment.
(…)
How low could gold go? If gold does indeed move lower our targets for gold are $1,700 and then possibly $1,600.
The $1,700 target is based on a rather weak rising support line which could hold the downtrend for a few days. Of course, we have now seen that gold moved back into the trading channel on Thursday and rose to the upper border which is shown by the dotted line in our chart. At this point, however, with an overbought RSI, further declines are still quite likely.
The correction seen thus far has been in price only, not in time. That is to say, the decline has been very short-lived and is likely to play out for additional week or two. Emotions are still high and it the next big rally will likely begin when investors calm down.
The most likely target for the decline is around $1,600. The main reason for this is that after the breakout above the $1,600 (which was a move above the very long-term rising trend channel that goes back to 2002), there was no significant pull back to this move – no verification and most breakouts (especially the important ones) are followed by such patterns.
Momentum players and short-term traders have been betting on higher prices for some time now – after gold moved above $1,600 and started its parabolic upswing. It is probable that they are now selling and will continue to do so since the parabola was broken. The momentum players are usually not true believers in gold fundamentals and will be willing to dump their holdings once they believe higher prices are no longer a sure bet in the following days.
Price levels are close to the lower border of the rising trend channel and also near the level of previous tops. The RSI is also overbought.
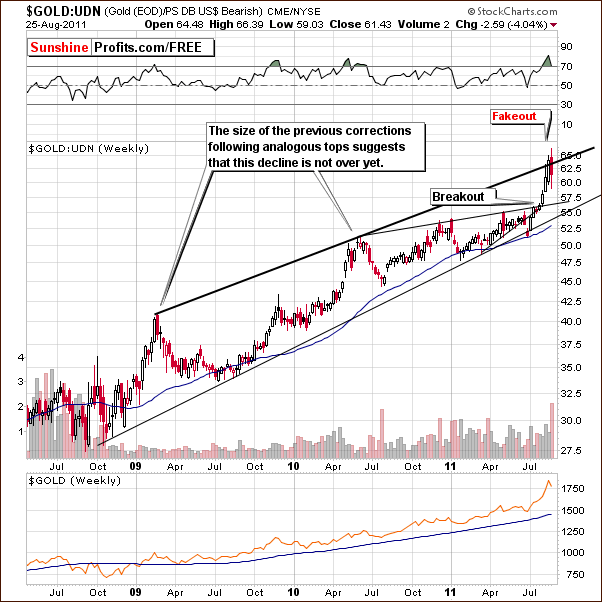
In this week’s long-term chart for gold from a non-USD perspective, we have seen a fake-out as the index level failed to hold above the rising resistance line. This is another reason that made us suggest shorting gold in Wednesday’s Market Alert. Prior to this development, it was too risky to make such a statement since a continuation of the uptrend was (and an even bigger upswing following a breakout) still a possibility. In the past, tops similar to what we’ve just seen resulted in bigger declines and RSI levels moving to around 50. It appears that more declines are likely from here.
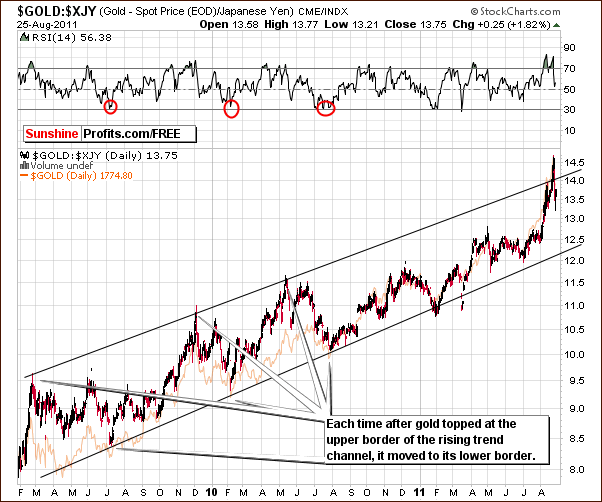
Looking at gold from the perspective of the Japanese yen, it seems that prices here are likely to decline to the lower border of the rising trend channel based on previous cases of similar price action. RSI levels likely will drop to the 30 range as well. This would be in tune with the $1,600 target in case of the USD perspective.
Summing up, the situation overall for gold is bearish at present and for the week ahead. Although a quick bounce was seen on Thursday and another small increase may be seen on Friday, it seems quite probable that a general downtrend will prevail.
Silver
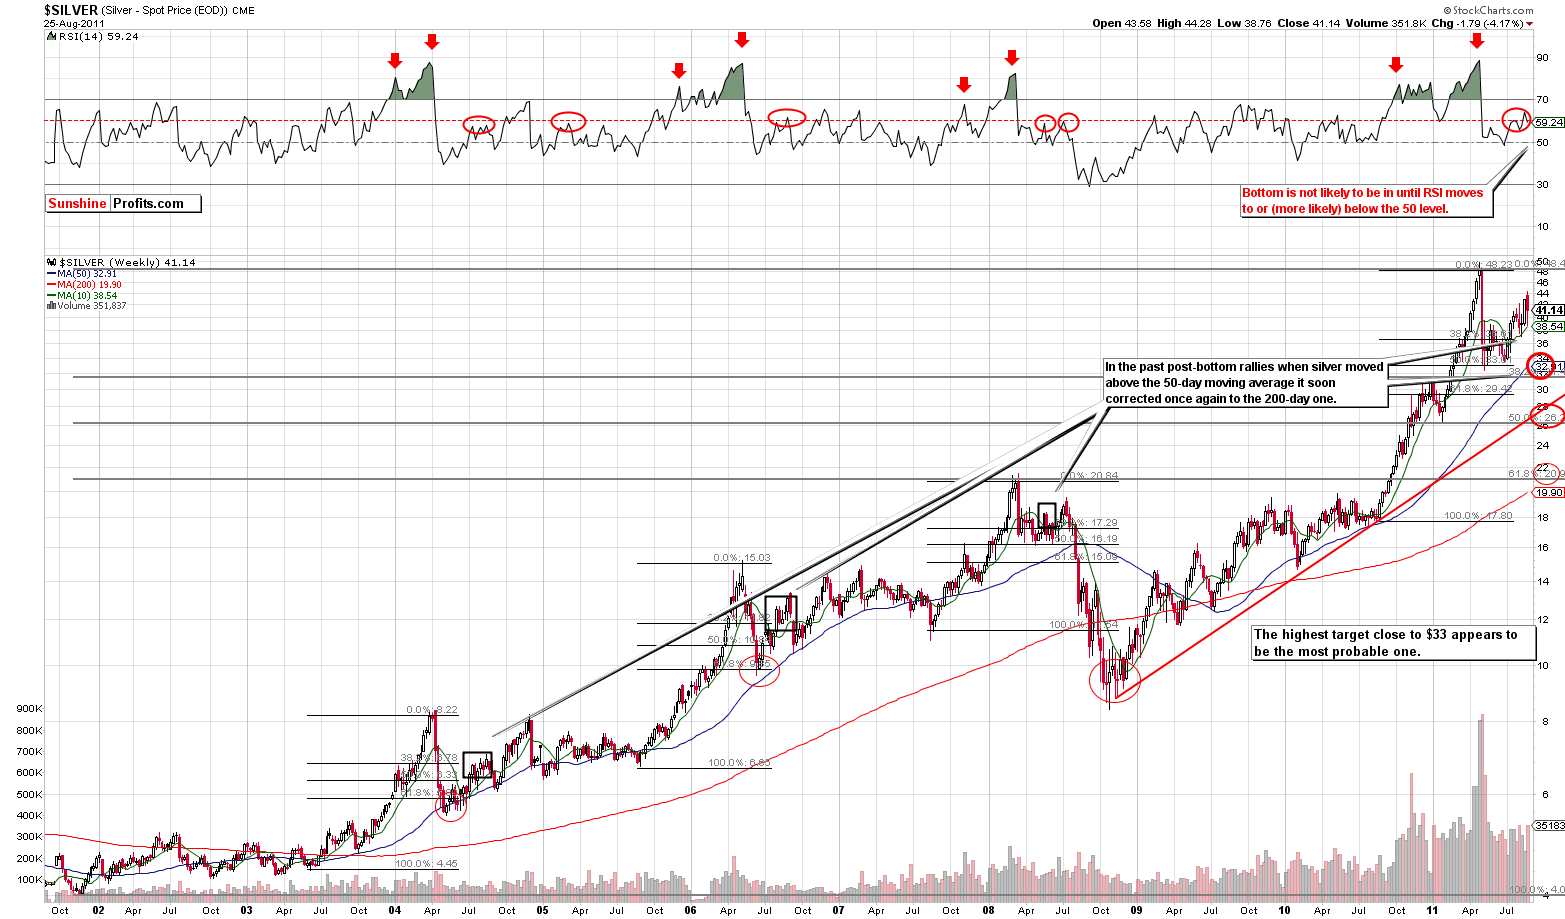
In this week’s long-term chart for silver (please click the above chart to enlarge), we saw silver’s prices drop shortly after we published our August 22 Silver Update. The decline was similar to what was seen in 2006 and the RSI double top is also similar. The RSI moved to 50 or lower in all the previous cases before the bottom was reached. This is likely to happen once again. The most likely target level for the bottom is around $33.
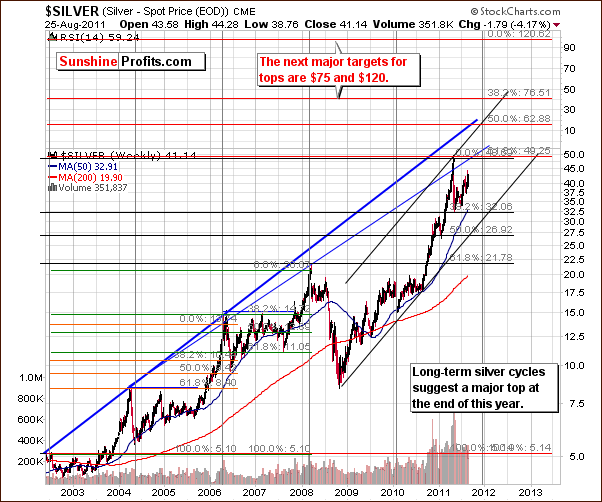
In our alternative very long-term chart, we will discuss future target levels to the upside. Those who are invested in silver long-term (and those who plan to be invested in the following weeks/months) are likely to be pleased with the long-term outlook for the white metal. By extrapolating the major tops from 2002, 2004, 2006, 2008 and 2011, we have two major upside targets: $75 and $120. Each of these prior tops reached a retracement level created by the 2002 top and the most recent top at the time.The exceptional consistency makes the above targets quite reliable. If history repeats itself, then the lower target level for the next top is near $75 and the higher one near $120.
Both of these levels are likely to be reached at some point in time. The question is when. It does not appear likely that such price levels will be seen immediately and the long-term cycles for silver, which are noted by the vertical grey lines in our chart, will help us to explain. These lines are approximately 2 years apart and have coincided with major tops in each case with the exception of 2009, which was an important local top.
Using these cycles in our analysis, it seems that the end of 2011 will likely see the next significant top for silver. Will it be above $50? It’s not out of the question. In the short-term, a correction is more likely, but eventually another move to $50 or even $62-$63 (please take a look at the above chart for details) cannot be ruled out. It seems best at this time to keep in mind the likelihood of a local bottom in the short term and to await further signals from the market.
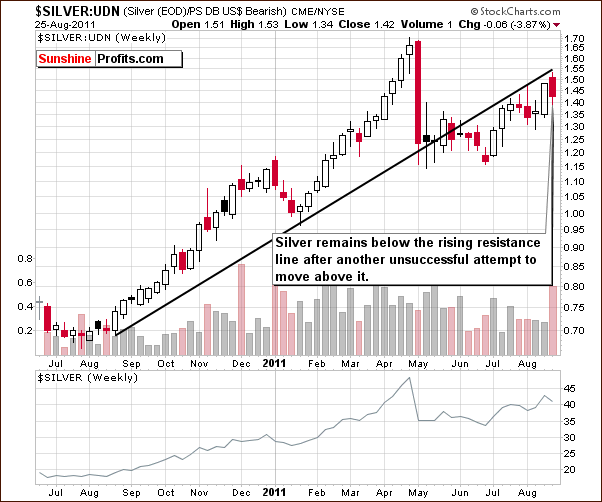
In this week’s look at silver from a non-USD perspective, we see that prices have once again failed to move above the rising resistance level. This is a short-term bearish sign – not too strong one, but still it’s worth keeping in mind.
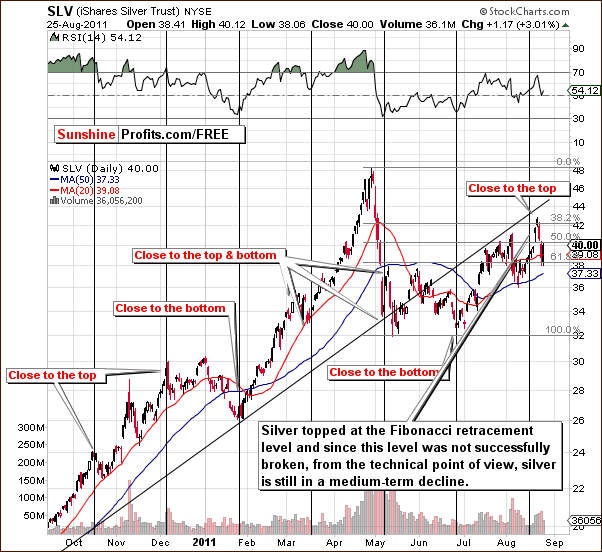
In the short-term SLV ETF chart this week, we see that silver has corrected to the final Fibonacci retracement level. Since no recent breakout has been seen (i.e. silver did not correct more than 61.8% of the preceding move down), silver is still in a corrective phase after its recent upswing. From here, a decline to $32 or $33, which is in line with the previous bottom, appears likely.
Summing up, the fundamentals and technical analysis are favorable for silver in the long term. This sentiment does not hold for the short term however. The opposite appears true and the outlook for the short term is bearish.
Platinum
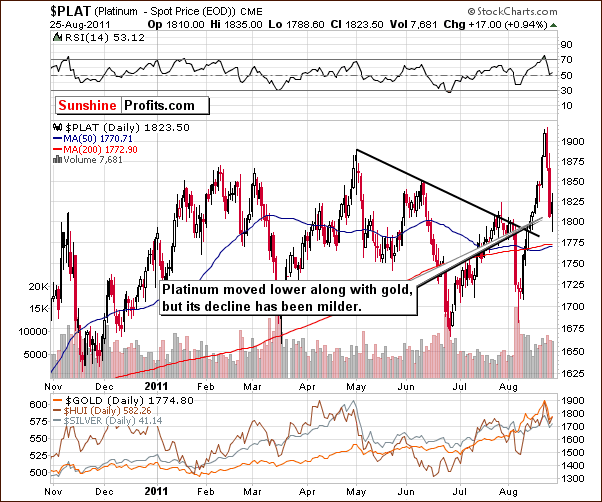
In this week’s short-term platinum chart, we see that prices have declined this week, though not as sharply as gold’s. The decline was also smaller than that of the yellow metal and platinum’s price was still above $1,800 whereas gold’s was not. Further declines are likely for both precious metals; however, it is probable that we will continue to see platinum outperform gold.
Gold and Silver Mining Stocks
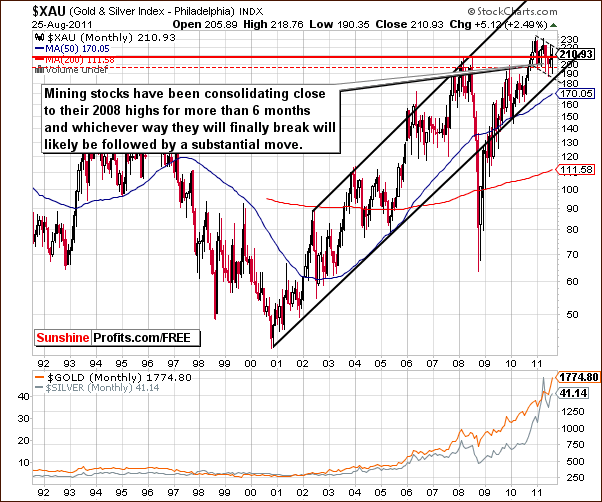
In this week’s very long-term XAU gold and silver mining stocks index chart, very little has changed as the sideways price moves have continued. We are still awaiting a breakout (or breakdown) here and as we said in last week’s Premium Update:
Gold and silver miners have traded sideways and it seems as though a topping pattern or a consolidating flag pattern is underway. Until we see a breakout or a move below the recent levels, the next move here is still unclear. Whichever direction the index levels eventually take will likely turn into a significant move. This has been our position for several weeks now and it remains so.
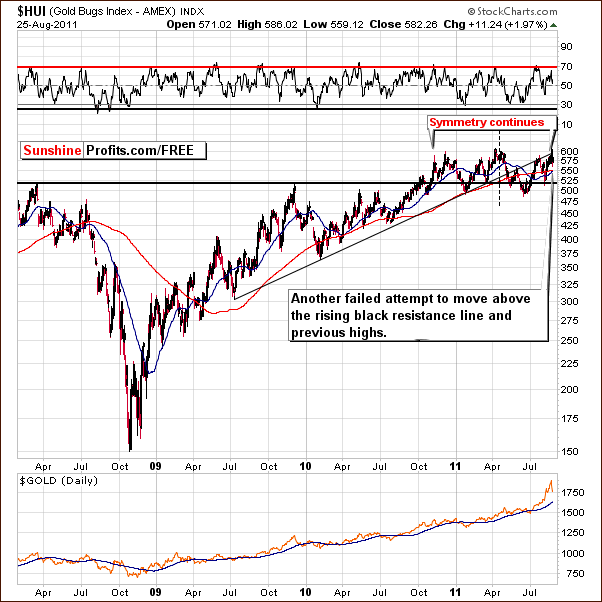
In this week’s long-term HUI Index chart, we continue to see a very interesting phenomenon. Last week we wrote the following:
Looking at the recent price action in our chart, we see a very symmetrical pattern and if this continues, we would soon see a spiked top followed quickly by a significant downturn.
The symmetry which we discussed last week continues to be in place and it is providing a continued bearish trend. The next move will be down if this symmetric pattern continues. Based on the short-term bearish implications for gold mentioned before, opening long positions does not appear profitable at this time.
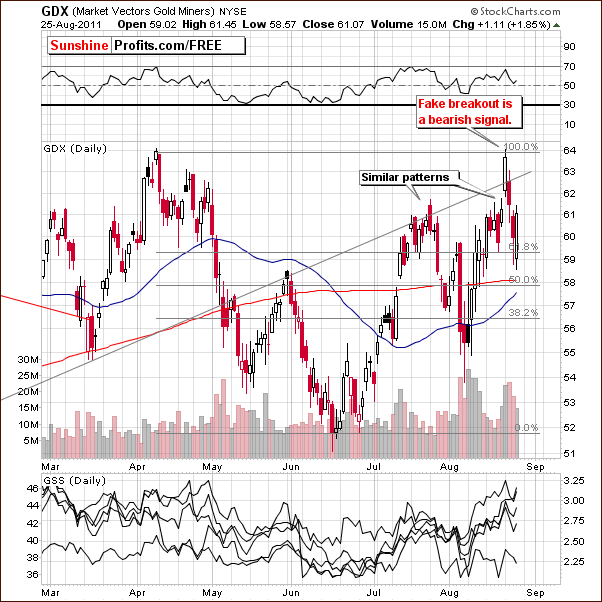
In this week’s short-term GDX ETF chart, we have just seen a fake breakout above previous highs and the rising resistance line. Recent declines have been quite small to the previous ones following analogous fake breakouts, so the outlook remains bearish.
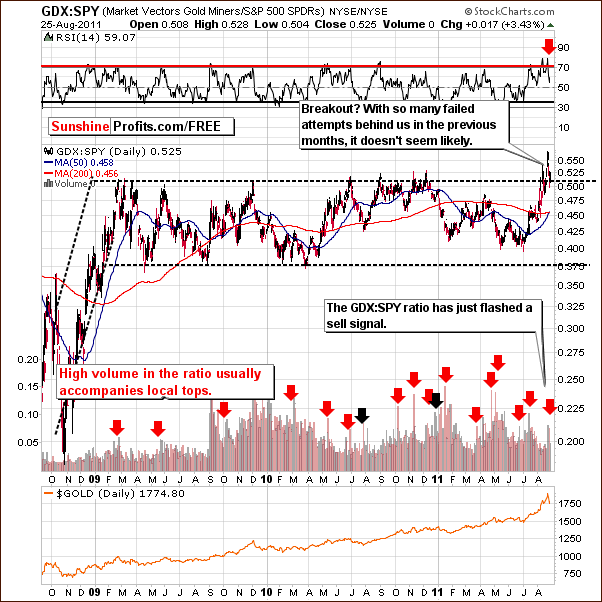
The GDX:SPY ratio measures the relative performance of gold and silver mining stocks to other stocks. On the above chart we’ve seen a spike high volume this week, which in the past has been a sell signal. This is generally very important if accompanied by RSI levels in the overbought status as it was the case just a few days ago. The local top is therefore in.
Summing up, the situation is bearish overall for the gold and silver mining stocks this week as it is for gold and silver. The long-term picture is a bit cloudy based on the sideways trading range which has been seen for some time in the very long-term XAU Index chart. A breakout or breakdown in this index will likely determine the next direction for mining stocks. At this time, a breakout and higher prices appear more likely to be seen, however we continue to believe that a decline is more likely short-term outcome. The general target level for the HUI Index is between 480 and 520.
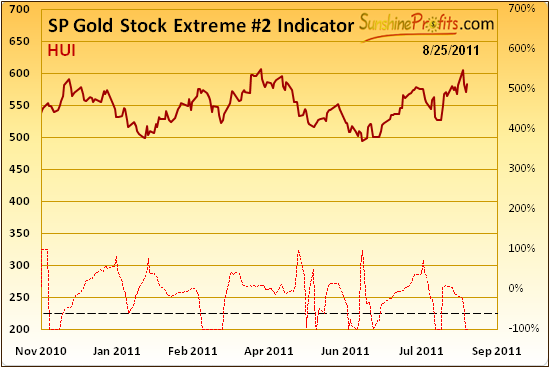
The Sunshine Profits Gold Stock Extreme #2 Indicator flashed a buy signal based on Wednesday’s closing price - we believe that this might only be a prediction of a relatively small move up within a significant decline, which could have predicted Thursday’s intra-day rally. Nonetheless, in our view, it still should not be taken to invalidate points made earlier in this update.
Letters from Subscribers
Q: Could it be that "this" is the correction that most experts felt was needed to propel gold over $2000?
(…)
The drop in gold and or silver is orchestrated by US Banks so that the options, which expire at the end of the month, expire out of the money. Otherwise, the banks would lose more billions. While this is pure manipulation, it is not prosecuted. The selling of naked shorts is not prosecuted.
After Sept 1st, gold and silver will continue on their way to $2000 and $70 by the end of the year. As they get closer to these prices, the swings in gold may be as high as $100 a day. Get used to it.
You should know two things. 98% of all gold transactions involve paper gold. No actual gold is dealt with. There just is not enough gold to satisfy most transactions.
Most every major bank in Europe and the U.S. is dead broke and living on borrowed time. The Fed, just gave some major banks $1.2 trillion to save them from toppling over. (source Bloomberg News) Your only out is gold and silver. Add to them.
A: Yes, this could be the correction that precedes a rally to $70 in silver and above $2,000 in gold, however, we would not be so sure about the timing of the final bottom of this decline (whether it happens before Sep 1st or not). When we have an established trend in stocks and gold reacts to it positively, then we'll likely see another strong move up. That is not the case yet.
Q: I do not agree at all with your analysis. You are denying technical analysis and using comparison with historical technical moves to justify what you want to say about the market, denying what technical analysis is showing in actual graphs. Historical moves have nothing to do with actual moves, fundamentals change each day and markets do nothing similar today to what happened in 2008. Technical analysis is showing a Bullish brake to a symmetrical triangle on good volume and this will probably take silver near the resistance in $50, probably with a downward correction after that, before breaking $50.
A: Naturally, we are perfectly fine with anyone using technical analysis in the way they believe is correct, however, we disagree with the part about us denying technical analysis in our Monday silver update.
Comparing the current price move with the past moves is not something "against" technical analysis - we believe it's the core of it.
The general principles of technical analysis are:
- Everything is discounted in the price (both fundamental and emotional factors),
- Prices move in trends,
- History tends to repeat itself to a considerable degree.
Our Monday analysis was in tune with these principles. In fact, it was closer to them than popular stock indicators like the RSI indicator or MACD, since in this case we were directly comparing previous trends to the current ones, which is what the two last principles mentioned above suggest. In case of indicators, you compare mathematical transformation of prices, not prices themselves.
We believe that fundamentals for the precious metals market have been favorable for many years and this did not change this week - what changed dramatically was the emotional status of investors. This includes also those with large gold futures positions that could dump them onto the market to lower the price. Even if the sell-off was generated artificially, please keep in mind that the price topped at the key resistance level (gold, non-USD perspective), not much below it.
Q: Did gold just flash a buy signal on 8/24???? Extreme Indicator?? Im not sure if I am understanding this fully. It seems to happen when P.R. says to go short the same day or day after a buy signal is given by his own charts. Shouldn't the buy or go short signal be in tune with what he is predicting??
A: The Gold Stock Extreme #2 Indicator has flashed a signal based on Wednesday’s closing prices. However, this is not the version of the indicator that has been 100% accurate since 2008 (the #1 version is). It is a bit less reliable, so we do not view this as an invalidation of our previous analysis. It is possible that a 1-3 day rally could be seen, and, in fact, may be underway and more than half-way completed already.
Our indicators are objective tools that we use in our subjective analysis (we strive to be as objective as possible, but no human can be as objective as a mechanical/statistical tool). We provide you with our tools (and will provide many more of them in the following weeks/months and they will be much easier to use than the current ones) as we realize that many Subscribers may agree/follow only a part of our analysis but have different opinions on some details. In this case these Subscribers still benefit from our service as they are armed not only with the standard indicators like RSI or MACD, but also our in-house-developed ones.
On the new website we will have many new features including a Dictionary section, and the following is a part of the definition of the Analyst term:
Analysts vs. investment tools?
We have pointed out that analysts cannot always be right. So you might ask yourself if it is possible to improve your decisions in other ways than relying on analysts. As a matter of fact, you can do that by resorting to various investment tools. These tools offer the objectivity analysts sometimes lack and they can precisely measure the developments on the market. However, you need to remember that there is no real competition between analysts and investment tools. In reality, you must use both quantitative methods (tools) and qualitative ones (analysts’ opinions).
While tools offer specific results, they more often than not operate within a scheme. It is analysts who can think outside the box and make decisions breaking the scheme, which is priceless as market patterns and initial assumptions may change in a blink of an eye.
Summary
The situation in the currency markets is somewhat tense and at a crossroads of sorts this week. The USD Index is approaching a cyclical turning point and the odds of higher values for the dollar are greater than they have been for some time. If the rally materializes, it will likely have a negative impact on gold and the rest of the precious metal sectors.
The general stock market appears poised for a short-term rally and this too would have a negative impact on the precious metals sector. Higher stock prices are more likely than not based on analysis of volume levels, moving averages, price action and target levels based on Fibonacci retracement levels.
Gold reached its first downside target level for the current decline but has likely (we estimate the probability of being correct at about 65%) not reached a final bottom. It appears that $1,600 is a good estimate for the final bottom and silver and the mining stocks will likely be moving lower as well. The lower target levels are $32-$33 for silver and 480 to 520 for the HUI Index.
We will continue to monitor all markets closely and keep you informed with our Market Alerts as more details become available.
Our next Premium Update is scheduled for Friday, September 2, 2011.
This completes this week's Premium Update.
Thank you for using the Premium Service. Have a great weekend and profitable week!
Przemyslaw Radomski

