We are marking a dubious 40-year anniversary this week. It was on August 15, 1971 that President Richard Nixon unilaterally “closed the gold window,” severing the dollar’s ties to gold forever, possibly one of the most significant policy decisions in modern economic history. It was a part of dramatic measures meant to deal with the nation's huge balance of payments deficit, its weak growth, and inflation. Speculative attacks on the dollar had begun in the late 1960s as concerns mounted over cost of the Vietnam War and America's rising trade deficit. Other countries were increasingly reluctant to take dollars in payment and demanded gold instead.
It’s very possible, looking back in hindsight, that Nixon had no choice. There was panic in the markets and Great Britain had tried to redeem $3 billion for American gold. The official dollar debts in the hands of foreign authorities were so large that America's gold stock would be insufficient to meet the swelling official demand for American gold at the convertibility price of $35 per ounce. It’s seems reasonable to think that America had no interest in giving away the contents of Fort Knox to foreign governments.
And so, Nixon ended the greenback’s precious-metal guarantee thus creating the current floating exchange monetary system in which currencies are backed by fiat, or trust. In other words, the currency has value because the government says so. No longer would the U.S. permit other countries to exchange their dollars for gold. (Under the agreement only the U.S. dollar was required to be convertible to gold.) At 40 years of age fiat currency is looking frayed and worn at the edges. At the time of the making of the Bretton Woods agreement, the U.S. was the world’s largest creditor. Now it is the world’s largest debtor. At that time people took it for granted that each generation would have a better life than the last. That is no longer true.
It was at Bretton Woods, New Hampshire that the Allies met in July 1944 to devise a new financial order for the post-war world. The international reserve currency would be the dollar rather than gold, but the dollar itself would remain convertible into gold.
According to Anna Schwartz, Milton Friedman’s co-author to the landmark “A Monetary History of the United States,” the macro-economic performance under Bretton Woods was excellent with real per capita income growth throughout the industrialized world higher than during any monetary regime since 1879. Of course, there were other factors that contributed including post-war reconstruction, new technological advances, low commodity prices and the unleashing of pent-up consumer demand by the parents of the Baby Boom generation.
When Bretton Woods collapsed, gold, which traded about $35 an ounce lost its long-held historical role as the anchor for the global financial system. Central banks were eager to unload their reserves since the gold just sat there earning no interest and taking up space in vaults that needed guarding. Although it may seem unbelievable today, it was only a little more than ten years ago that Britain’s Gordon Brown was keen to unload half of Britain’s centuries-old gold reserves, about 400 tons, at the bottom of the market, about $260 an ounce.
One can safely say that gold has come around full circle, its shine untarnished by the passing years as it has reclaimed its respected place at the heart of the financial system. The debate over a return to the gold standard has resurfaced in the last few years in a way that has not been seen in the four decades since Nixon’s speech. Gold is shining brightly. Robert Zoellick, president of the World Bank, wrote in the Financial Times opinion piece last year about a new monetary system involving a basket of currencies that “should also consider employing gold as an international reference point of market expectations about inflation, deflation and future currency values” Zoellick then added: “Although textbooks may view gold as the old money, markets are using gold as an alternative monetary asset today.”
Central banks have become significant buyers once again. World Gold Council figures show that central banks bought about 208 tons of gold in the first half of this year. There were significant purchases by Thailand, Mexico and South Korea in recent months. This comes at a time when the sovereign debt crisis in the eurozone is spiraling and the downgrading of the U.S. credit rating has sparked waves of volatility and fears of another global recession. Governments are running out of rabbits they can pull out of the hat to absorb new shocks. The recent debt ceiling debate revealed a political dysfunction that undermines U.S. status even more than the S&P decision to cut its triple-A rating.
Venezuela has found a “creative” way to increase its gold reserves. It just announced this week that it is planning to nationalize its gold industry. Since emerging market central banks are now only gearing up for gold buying spree, the sovereign sector might provide a solid floor for gold prices for the foreseeable future.
If the period before the "Nixon Shock" was one of the best, the decade following his announcement had one of the worst inflations of American history and the most stagnant economy since the Great Depression. The price of gold rose to $800 from $35. If you had a dollar in 1971, today it would be worth only about 18 pennies.
One of the most significant results of the break-up of the Bretton Woods system was the consequent liberalization of the financial markets which began in the 1970s picking up speed in the 1980s. This was a time of the lifting of exchange controls and the abandonment of formal restrictions on credit. The only instrument left in the arsenal of governments to control the availability of credit is now interest rates. That’s when the good times began to roll and nations and individuals began amassing debt.
Looking back in hindsight, it is possible that if not for the “Nixon Shock” we would have avoided the financial crisis of the past four years; or indeed the crisis after crisis that have plagued world markets. We can say for certain that the whole debate on the debt ceiling that we witnessed a few weeks ago would have never taken place.
This week we looked back at history, and now it’s time to look at the future. To see how the precious metals will behave let’s begin this week's technical part with the analysis of the Euro Index. We will start with the long-term chart (charts courtesy by http://stockcharts.com.)
Euro - USD Indices
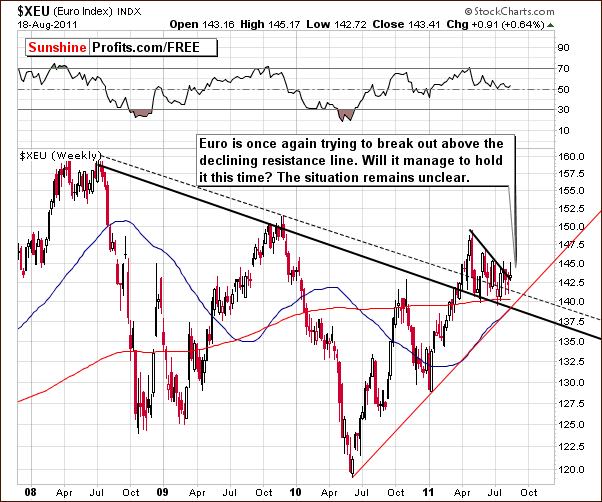
In the long-term Euro Index chart this week, we see yet another attempt for the index to move above the short-term declining resistance line. The previous move above it was not verified and has since been invalidated. It’s unclear whether this will be seen once again.
The most recent move above the resistance line was followed by a move back to it. If the breakout does hold and is verified, a rally in the Euro Index will likely follow. This would almost certainly result in lower values for the dollar and perhaps higher precious metals prices. A breakdown however, will clearly be bearish and likely lead to further declines for this index and may have a negative impact on gold and silver prices as well.
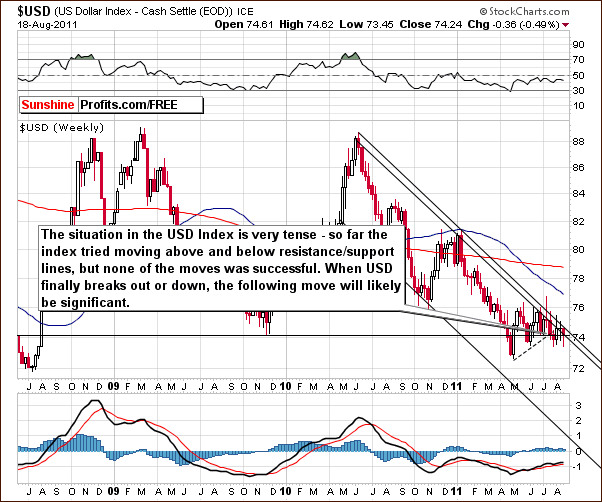
In the long-term USD Index chart, we do not really see any reflection of the recent moves in the Euro Index. The situation is very tense here and the index has been moving back and forth between an important support level and an equally important resistance level. It is now within a tight trading range and it is probable that a breakout or a breakdown will be seen soon. The direction of this move will likely determine the direction of the next significant move for the dollar.
Whatever happens in the USD Index will likely have a big impact on gold and the rest of the precious metals sector. Based on the recent correlation between the dollar and gold, a significant move for the dollar will probably result in the classic impact where the exact opposite is seen in the price of gold. That is to say that a significant rally in the USD Index will likely be accompanied by much lower price levels for gold. Conversely, a large decline will likely lead to much higher prices for gold.
Summing up, the situation is very tense and unclear in the currency markets. A breakout and a confirmation of it are about the only way the picture will be clarified for the euro and the dollar. Each index is presently at a crossroads and whichever breaks out and rallies will determine whether the impact upon gold prices and the precious metals sector overall will be positive or negative.
General Stock Market
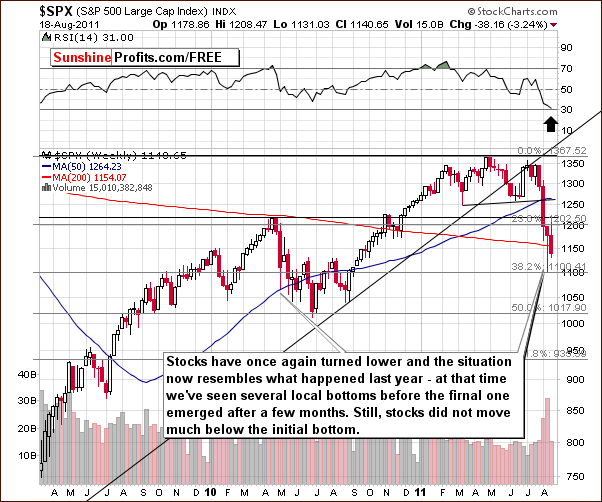
In the long-term S&P 500 Index chart, this week’s price action appears to be quite similar to what was seen last summer. Back then, a sharp and significant decline was followed by a period of back-and-forth price action for the next several months. We mentioned in previous updates that this type of price action was a possibility and it seems that the history does repeat itself here. However, because of the important recent signals from the 30-year bond yield, it is quite possible that the current consolidation will be much shorter than it was the case in mid 2010. Long-term yields have plunged and this has historically resulted in a rally for stocks.
Summing up, Thursday’s decline in stocks was quite volatile but did not necessarily change the overall outlook for the general stock market. It still seems that the weeks ahead could very well be bullish although this upturn may not be seen immediately.
Correlation Matrix
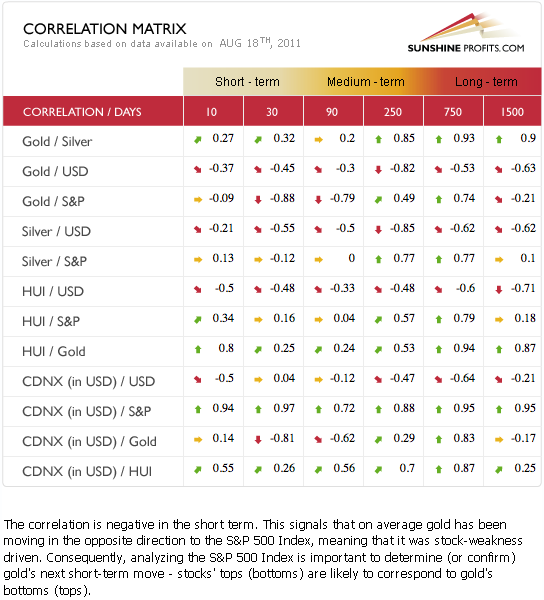
In this week’s Correlation Matrix, gold continues to be negatively correlated with the general stock market in the short term (30-day column). This means that if stocks rally, lower gold prices are likely even though gold is currently close to its all-time high price.
The long-term coefficients between gold and the dollar are also negative and the implication here is that if a significant rally is seen in the USD Index, gold’s price will probably move lower. The effect would also likely be negative upon silver and gold and silver mining stocks. The exact opposite (i.e. a move higher in gold, silver and mining stocks) is likely to happen in case the USD Index declines sharply.
Gold
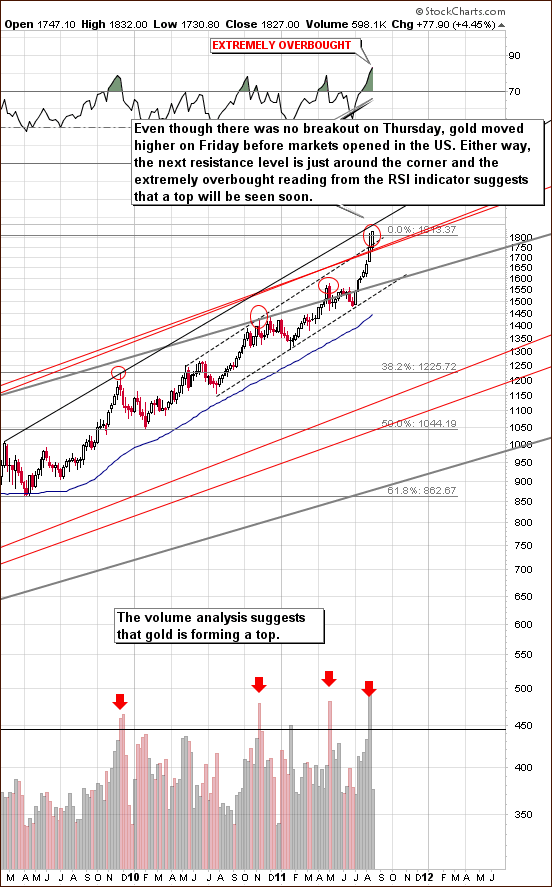
We begin this week’s gold section with the very long-term chart (please click on the chart to enlarge it) for gold. Based on Thursday’s close, it was clear that not very much has happened this week. In fact, we have seen that the price of gold has moved just a bit above the highs that were seen last week, so that was not really anything major. However, in pre-open trading in overseas markets, gold moved approximately $50 higher which is a move above the previous highs. This is a breakout above the previous top, however the next resistance line is quite close.
The situation is extremely overbought from a short-term point of view and previous signals from volume levels are still very much in play. In late 2009, a local top turned out to really be a pre-top about a week before the final top was seen. This was also accompanied by significant volume levels.
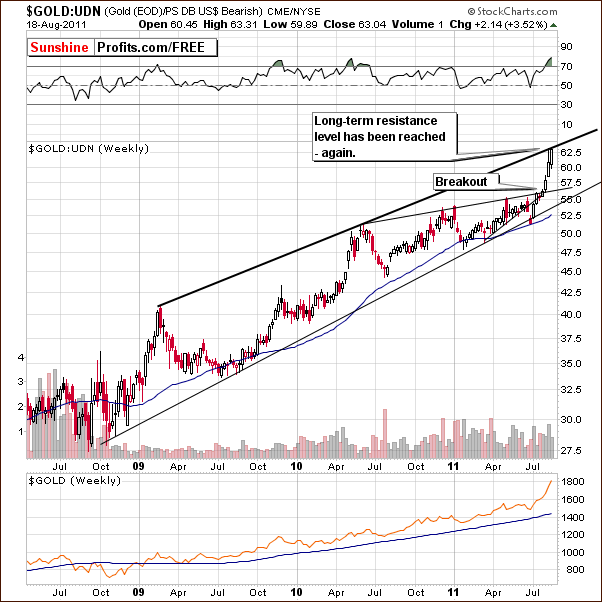
In this week’s long-term chart for gold from a non-USD perspective, we see that gold’s price has once again moved to the upper border of the rising, long-term trend channel created by the February 2009 and May 2010 highs. No breakout has been seen (based on Thursday’s close) and the situation is also quite overbought on a short-term basis with the RSI well above the 70-level.
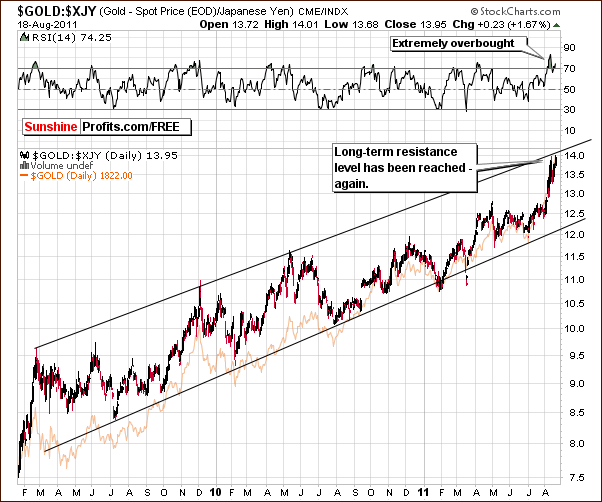
Looking at gold from the perspective of the Japanese yen, we see a situation here similar to the non-USD perspective. The index level has also reached a resistance line once again, no breakout has been seen (based on Thursday’s close) and the situation is extremely overbought.
Analyzing the short-term chart this week doesn’t provide much information that hasn’t been covered in the first chart from this section, however we will still feature it as it allows us to explain why can patterns on the GLD ETF sometimes differ from the ones seen in gold.
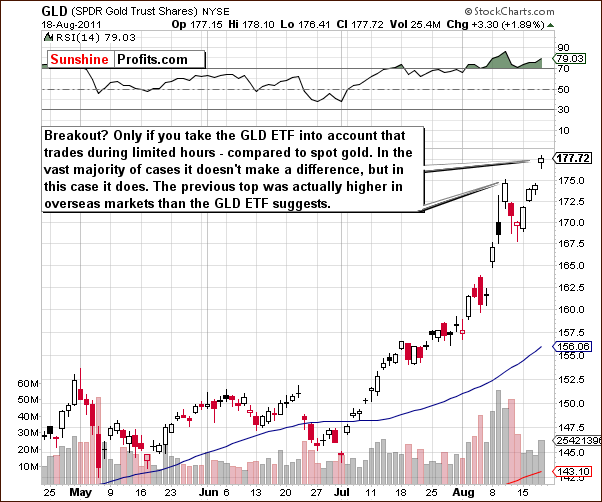
Based on the Thursday’s close, it seems at first glance that gold has broken above previous highs. The disparity here is that this chart reflects activity in the US markets only. The previous high for spot gold was actually above the level of the previous high shown here. Because of that, we do not view Thursday’s price action as a real breakout. The very long-term gold chart in our opening section takes worldwide gold prices into account and therefore is a more accurate picture of what is actually happening to gold prices.
Summing up, gold did not truly break out on Thursday although higher prices were seen. The very long-term chart is the most reliable and clearly shows that prices are not significantly higher than they were just a week ago. Last week we wrote the following:
As far as speculative transactions are concerned, at this time, we prefer to wait for a confirmation of gold reaching a top before suggesting opening short positions in the precious metals sector.
Gold moved significantly above the previous high during Friday’s pre-market open, so the final top for remains to be seen. We believe that last week’s approach is still up-to-date. Namely, as speculative transactions are concerned, at this time, we prefer to wait for a confirmation of gold reaching a top before suggesting opening short positions in the precious metals sector.
At this point, we have somewhat ambiguous feelings towards gold. One part of us, the part that feels gold should always be part of our portfolio has been very happy with gold’s recent spectacular performance. On the other hand, the other part of us, the contrarian one, does not at all like what has happened recently. There has simply been too much of a push towards buying gold in the media and the fact is that no market can only look in one direction without eventually correcting. It seems likely that gold is close to a local top and that a correction will likely be seen fairly soon.
Silver
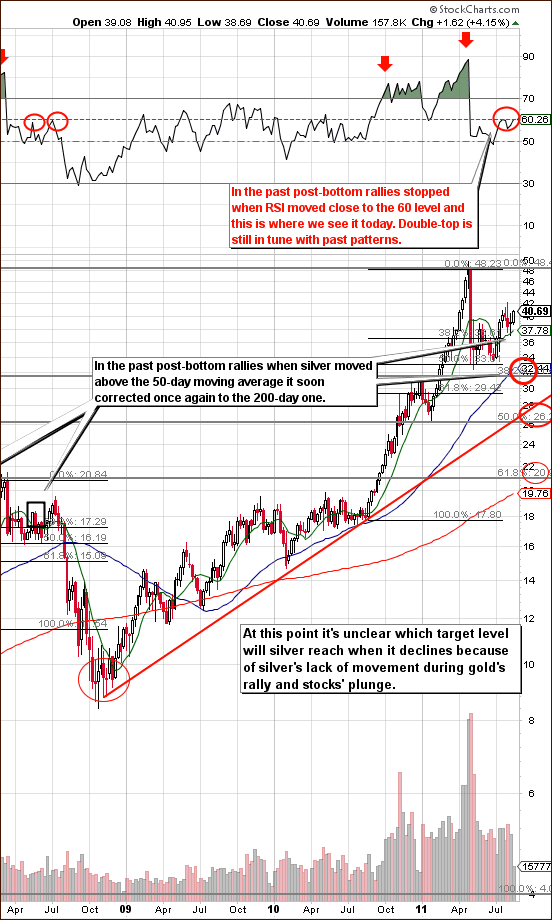
In this week’s long-term chart for silver (please click the above chart to enlarge), there is very little significant news this week. The RSI has moved higher and we previously discussed how it generally moves down to 50 or so after a major top, then up to 60 and then down again, in tune with silver’s price. We may presently be seeing a double top in the RSI as has been the case in previous similar price action patterns.
Generally speaking, double tops in the RSI are often followed by more significant corrections in silver, so the recent higher prices for silver are not necessarily a bullish sign. Please, keep in mind that in the past post bottom rallies which pushed silver above its 50-day moving average were often followed by significant declines to the 200-day moving average. It seems that a decline back to the level of the May lows in the $32 to $33 range is quite likely to be seen soon.
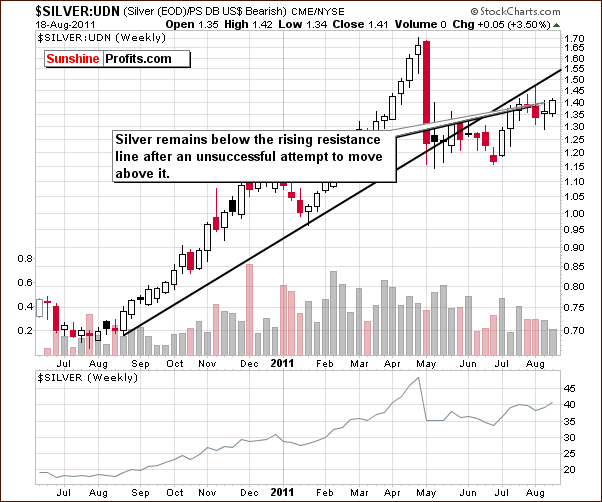
In this week’s look at silver from a non-USD perspective, silver’s price has moved higher but the price action has been far less than spectacular and is still well below the rising resistance line. Prices failed to move above this level two weeks ago as well, so the overall picture here remains mixed to slightly bearish at this time.
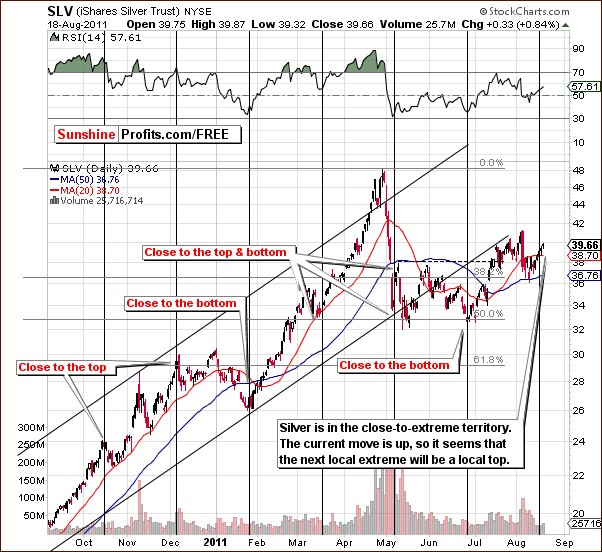
In the short-term SLV ETF chart this week, we see that silver’s price is close to a cyclical turning point. In the past, these indicators have been quite reliable although at this time, it is difficult to detect whether a local top or local bottom is more likely.
The current move for silver has been up and this may mean that the local extreme will be a top. If this is the case, lower prices are likely to soon follow. As a final note here, with gold extremely overbought at this time, prices are more likely to correct sooner as opposed to later.
There’s one more thing that we would like to share with you before summarizing – the silver:gold ratio chart.
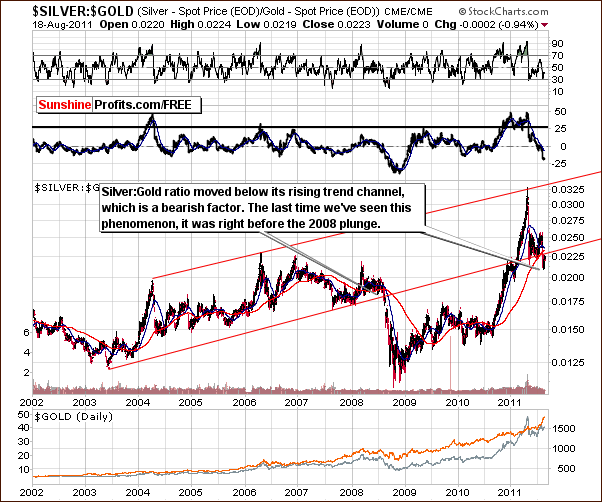
In the silver to gold ratio chart, we see that the ratio is now once again below the rising trend channel in the chart, and this is generally a bearish sign. Such a situation has, in fact, only been seen once before. This was in 2008 right before prices plunged. The general stock market also declined sharply at that time and it influenced the silver to gold ratio in a negative way since silver is more closely aligned with stocks.
The ratio declines when silver’s price drops more rapidly than gold’s on a percentage basis. This is because silver’s price is in the numerator of the ratio. A significant decline in the ratio may be underway once again where silver prices could drop more rapidly than gold’s. It seems that extreme caution is necessary for all long speculative positions in silver or gold at this time.
Summing up, even though silver moved higher in pre-market trading on Friday, the situation does not at all appear really favorable at this time.
Platinum
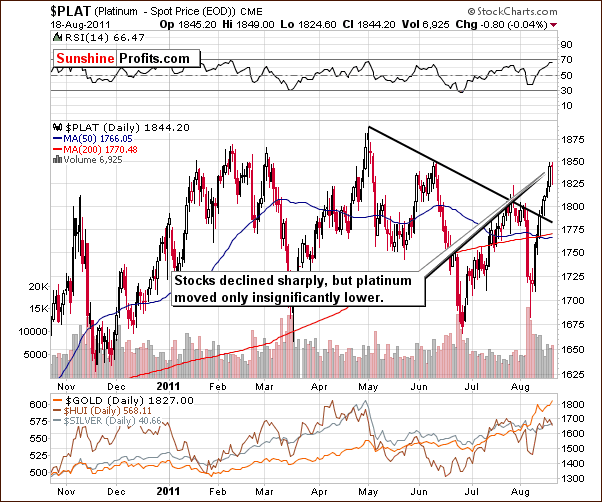
In this week’s short-term platinum chart, we see that prices pretty much followed the pattern we described in last week’s Premium Update:
(…) we also see price levels at the declining resistance line. If the general stock market rallies, then a breakout and higher prices appear probable indeed for platinum.
The recent sharp decline in platinum has coincided with the sharp decline in the general stock market and it appears that both are at or near bottoms. Even if stocks move lower from here, it still seems that platinum will retain its upside potential relative to gold. Since a turnaround is likely in the price of platinum, it may be a good idea at this time to switch 50% of long-term holdings from gold to platinum.
Platinum’s price did move decisively above the declining resistance line. On Thursday, its price corrected slightly even though stock prices plunged sharply. At this point we could very well be seeing the pattern which we discussed last week play out completely. The platinum to gold ratio generally reaches its bottom earlier than the general stock market does. Although it is questionable at this time whether stocks have reached a local bottom, it seems as though the platinum to gold ratio has already bottomed.
Gold and Silver Mining Stocks
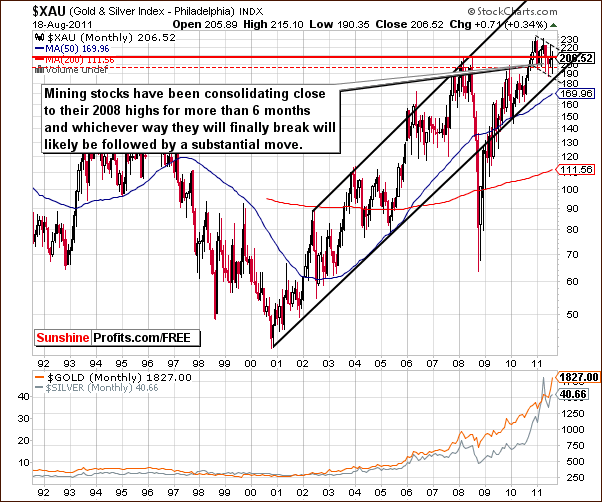
In this week’s very long-term XAU gold and silver mining stocks index chart, we see very little change. Gold and silver miners have traded sideways and it seems as though a topping pattern or a consolidating flag pattern is underway. Until we see a breakout or a move below the recent levels, the next move here is still unclear. Whichever direction the index levels eventually take will likely turn into a significant move. This has been our position for several weeks now and it remains so.
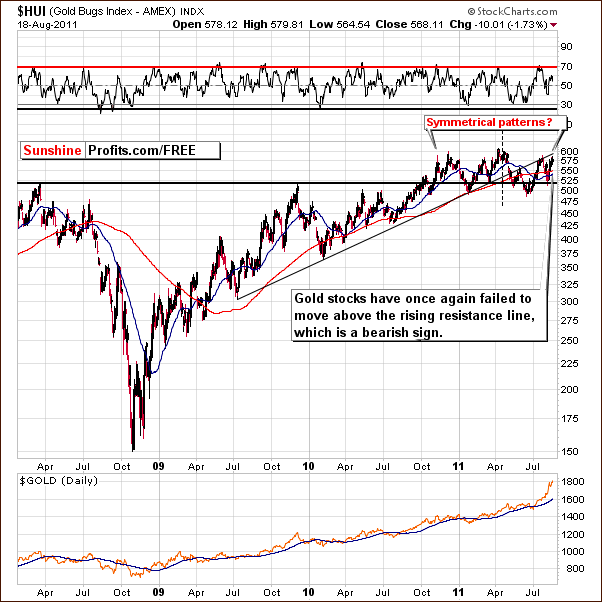
In this week’s long-term HUI Index chart, we see that gold stocks have failed to move above the rising resistance line. This is a bearish sign and is something that has been seen previously just ahead of significant declines.
Looking at the recent price action in our chart, we see a very symmetrical pattern and if this continues, we would soon see a spiked top followed quickly by a significant downturn. Of course, nothing is certain but it will be interesting to watch this play out in the weeks and months ahead.
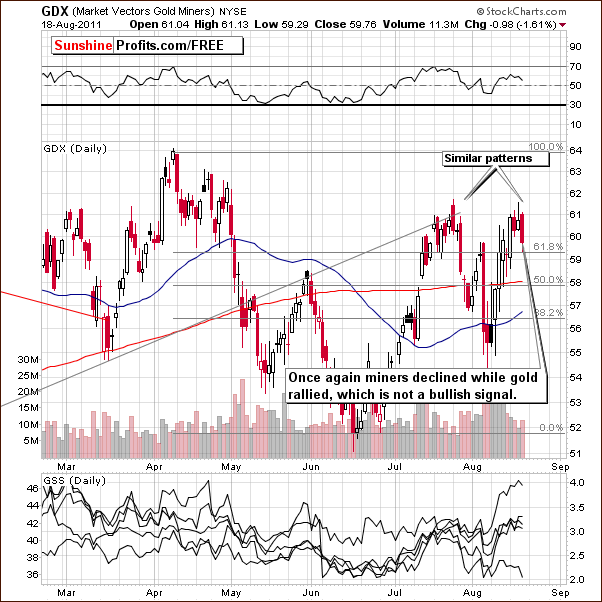
In this week’s short-term GDX ETF chart, we can clearly see that gold mining stocks declined on Thursday even though gold rallied. This is a price action similar to what was seen a month or so ago right before a bigger correction in mining stocks. The situation is clearly not bullish here.
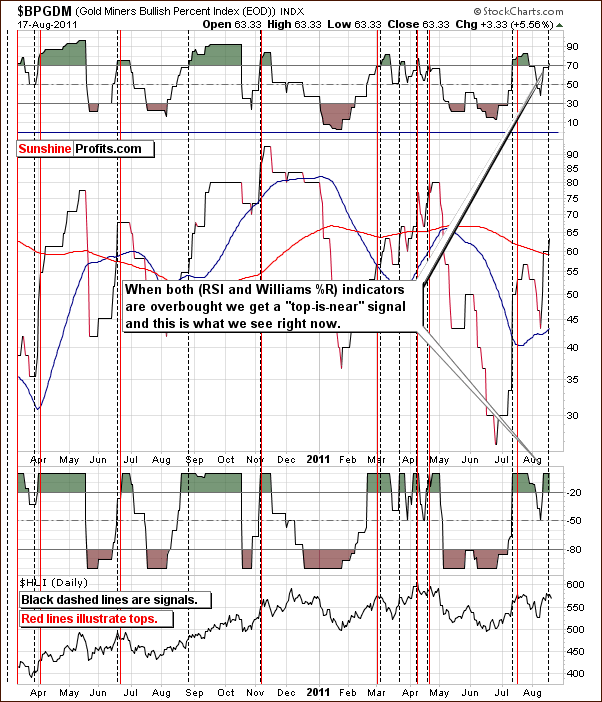
In this week’s Gold Miners Bullish Percent Index chart, we are seeing a “top is near” signal. Both the RSI level and the Williams %R are in overbought territory and each time we’ve seen this in the past, a local top soon followed. This is yet another bearish signal for the precious metals mining stocks.
Summing up, the situation in precious metals stocks is quite bearish at this time. It seems that lower prices for gold and silver mining stocks may very well be seen within the next few days. This is supported by the signals seen in the Gold Miner’s Bullish Percent Index chart as well as in the price action of gold mining stocks as compared to that of gold on Thursday.
Letters from Subscribers
There were two questions this week (thank you for asking them). The first one is about platinum and the second one is about the top in general.
Q: Thanks for bringing this to subscribers attention. With gold moving up instead of platinum is there a point when the PLAT position should be closed. E.G. If the stock market continues down and the bear market continues?
A: There are number of things that we will be monitoring as far as the platinum position is concerned. One of them is the platinum:gold ratio. If it moves below 0.91, we will need to re-evaluate our position. Other factors include gold moving strongly to new highs, severe plunge in the general stock market that drives platinum (and not gold) down. Naturally, these are only technical factors and we will be monitoring the fundamental ones as well.
While we don't feature detailed supply/demand in our Premium Updates it doesn't mean that we're not paying attention to them (there's another reason - they simply don't change that often, so there's not much new to report each week) and if some changes are seen (for example in the auto industry) we will re-evaluate this position as well.
Q: Before you say top, we need the same picture with irs etc from 1979 to 1980 to see when its overbought and what happens after ...
A: Please don't get us wrong - we don't think that this bull market will be over this year and we believe that before it ends we will see gold well over $2,000 (perhaps even over $5,000) and silver well over $100. What we meant in our previous updates (and in this one) is that a local top is likely to be seen rather sooner than later, which will start a short- - medium-term correction after which the bull market resumes.
Summary
The situation in the currency markets remains tense this week. The euro and the dollar have been somewhat indecisive as to their next major moves. A breakout may be seen in one of these indices and significant moves that will be seen after that will likely have a major impact on the direction that gold’s price will take as well as for the rest of the precious metals sector.
Not much has really changed in the general stock market this week even though the decline seen on Thursday was quite sharp. The outlook remains rather positive based on a number of factors including the present level of fear, the oversold status of the market, the low yields for 30-year US Treasury bonds and the additional fact that Warren Buffet is buying.
It appears likely that the precious metals sector will be negatively impacted fairly soon. A turnaround in the general stock market with gold being extremely overbought in the short term is likely to result in declining prices for the yellow metal. Gold is still looked upon favorably in the media, but no market can only move in one direction without an eventual correction. It appears that the time for this turnaround in gold prices is close at hand.
All in all, not that much changed this week. The situation is still not clear enough for opening speculative positions. As far as long-term investments are concerned, platinum continues to be a better bet for the following months than gold is so owning both appears to be a good idea. Platinum's strength relative to the weakness seen in stocks on Thursday clearly is a bullish sign.
We will continue to monitor this situation for more precise signals and report you accordingly. It seems that the following days may tell us much and allow for a clearer and more complete analysis of the precious metals markets and especially the general stock market. Again, you will be notified via Market Alerts as soon as anything changes.
Our next Premium Update is scheduled for Friday, August 26, 2011.
This completes this week's Premium Update.
Thank you for using the Premium Service. Have a great weekend and profitable week!
Sincerely,
Przemyslaw Radomski

