President Obama’s slogan changed from “Yes we can” to “Yes we cave,” as heard on one of the Late Night shows this week It only took the threat of financial Armageddon to get both sides to work together and get the debt ceiling legislation passed. So the U.S. avoided economic disaster, as if $16 trillion in debt is not economic disaster. Congress waited until the last minute, taking an unnecessary risk in a fragile economy and engaging in political brinkmanship that has raised fears in the rest of the world that America is in for a long period of political instability that could have profound consequences for global growth, investment and diplomacy.
Bill Gross, founder of Pimco, wrote in his letter to investors that “even though the U.S. has managed to avert a debt crisis and perhaps a ratings downgrade, there remains a stain on our reputation, a scarlet “A” for budgetary “Abuse,” that will not disappear. The whole world was watching, and what they saw was a dysfunctional government taking its country to the financial precipice and backing off at the very last moment.” Russian Prime Minister Vladimir Putin was handing out “compliments” this week and called the United States a "parasite" on the world economy.
Although the week looked promising to bulls after the Washington deal was signed, investors have been scrambling for havens on fears the US economy is facing a double dip recession and worries about the Eurozone and a focus on a slew of downbeat global manufacturing news. (So what else is new?) Stock markets have been taking a major hit and gold has surged to new highs marching into record territory Wednesday, with gold for December delivery rising to a high of $1,675.90 an ounce. (It was only a few weeks ago that we admitted to a bit of a thrill when gold crossed the psychological level of $1,600.) Gold investors didn’t need any additional incentives to buy gold but it probably helped that South Korea's central bank bought 25 tons of gold over the past two months in its first purchase in more than a decade. Events are unfolding in a dizzying speed. Tuesday’s 2.6 per cent slump for the S&P 500 was the biggest single-day drop in a year, pushing the benchmark below its 2011 starting point and taking its losing streak to seven consecutive days in which it fell a total of 6.8 per cent.
As we wrote in the Market Alert sent this week, on Tuesday gold rallied, the euro reversed and invalidated its breakout, the USD Index moved back to its previous key support level and stocks declined. Silver and mining stocks moved higher as well, but their upswings were much less visible than the one seen in gold. We believe that the most important thing was not noticed by most investors - namely, gold:UDN ratio (gold from the non-USD perspective) has finally broken out above its rising resistance line. Gold rallied on strong volume and this suggests that a move below $1,600 is rather unlikely given the above-mentioned events. So, with upside at $1,800 (as mentioned in previous updates) and downside at $1,600 it seems that gold is in a quite favorable situation. We’ll expand on that in the technical portion of the Premium Update.
Ironically, the deal to cut federal spending signed into law on Tuesday, doesn’t actually reduce federal spending since the new law does not address federal spending on health care. The Congressional Budget Office estimates that the federal debt is likely to exceed 100 percent of the nation’s annual economic output by 2021, largely because of the rising cost of services such as Medicare, Medicaid and Social Security. As Pimco’s Gross put it, the debt is not just on paper, it’s also walking/living liabilities in the form of people. “I call these liabilities “debt men walking” because as long as 330 million living Americans require promised entitlements – the $66 trillion that wear shoes are as much of a liability as the $10 trillion on paper,” he wrote.
By the end of the 10-year deal, the federal debt would be much larger than today as both the government and its debts will continue to grow faster than the American economy. The debt ceiling deal doesn’t stop the U.S. from going over the fiscal cliff,” says Senator Rand Paul, a Republican from Kentucky. “At best, it slows us from going over it at 80 m.p.h. to going over it at 60 m.p.h.” he wrote in an open letter.
The two reigning economic theories, the Keynesians and The Austrians are, of course, looking at the debt ceiling issue from different perspectives. They both hate it but for different reasons. In one corner of the ring we have Paul Krugman, Nobel Prize winning economist and die hard Keynesian. In the other corner ready for a good fight is Congressman Ron Paul (R, Texas), a staunch Austrian.
Krugman says in his weekly New York Times column that the debt ceiling deal is a disaster that will damage an already depressed economy. Cutting spending in a weak economy will lead to further weakness and actually worsen the budget situation, making the economy weaker and reducing revenues.
“It will probably make America’s long-run deficit problem worse, not better; and most important, by demonstrating that raw extortion works and carries no political cost, it will take America a long way down the road to banana-republic status,” he wrote in a recent column.
“Pay no attention to those who invoke the confidence fairy, claiming that tough action on the budget will reassure businesses and consumers, leading them to spend more. It doesn’t work that way, a fact confirmed by many studies of the historical record,” Krugman writes. He uses the following analogy to explain the deal from his perspective:
So those demanding spending cuts now are like medieval doctors who treated the sick by bleeding them, and thereby made them even sicker.
Ron Paul, on the other hand, says that in truth there are actually no cuts at all in the new plan. “The ‘cuts’ being discussed are illusory, and are not cuts from current amounts being spent, but cuts in projected spending increases. He put it like this: [The debt ceiling deal] is akin to a family “saving” $100,000 in expenses by deciding not to buy a Lamborghini, and instead getting a fully loaded Mercedes, when really their budget dictates that they need to stick with their perfectly serviceable Honda.
He further says that a balanced budget is within reach if Washington had just a tiny amount of fiscal common sense:
Our revenues currently stand at approximately $2.2 trillion a year and are likely to remain stagnant as the recession continues. Our outlays are $3.7 trillion and projected to grow every year. Yet we only have to go back to 2004 for federal outlays of $2.2 trillion, and the government was far from small that year. If we simply returned to that year's spending levels, which would hardly be austere, we would have a balanced budget right now. If we held the line on spending, and the economy actually did grow as estimated, the budget would balance on its own by 2015 with no cuts whatsoever. We pay 35 percent more for our military today than we did 10 years ago, for the exact same capabilities. The same could be said for the rest of the government. Why has our budget doubled in 10 years? This country doesn't have double the population, or double the land area, or double anything that would require the federal government to grow by such an obscene amount.
Which side do you agree with? We would like to hear from you, so write to us. We leave the debate for now and move to this week's technical part with the analysis of the Euro Index. We will start with the long-term chart (charts courtesy by http://stockcharts.com.)
Euro - USD Indices
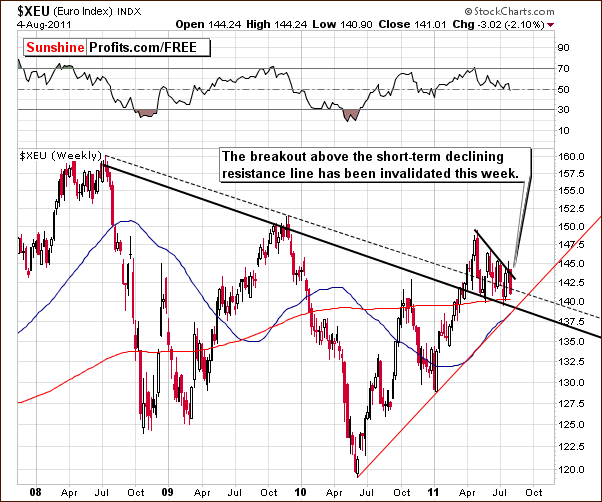
In the long-term Euro Index chart this week, we see that the Euro Index reversed direction and invalidated the previous breakout above the declining short-term resistance line. It now appears to be attempting to invalidate its previous breakout above the long-term declining resistance line which is now a support line.
The index level is still well above the ultimate support line at the level of 139. A move below this support line would have very negative implication for the European currency. This would also likely have a bullish impact on the dollar.
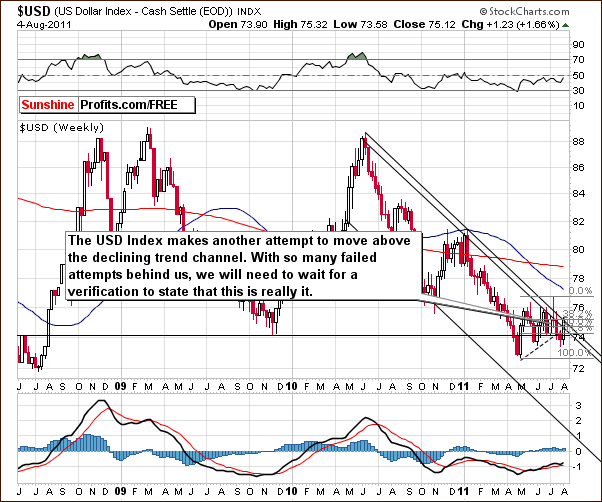
In this week’s long-term USD Index chart, we see that the breakdown below the rising support line has been invalidated and the index is making an attempt to move above the upper border of the declining trend channel. There have been several attempts previously to move above this resistance line but none have succeeded. It appears that nearly everyone is skeptical at this point about a USD Index rally and we are as well (we generally don’t like the idea of being on the same side of the “boat” as the majority of investors, but it seems to be appropriate at this point). We prefer to wait for a confirmation of a breakout before commenting on any substantial rally taking place from here.
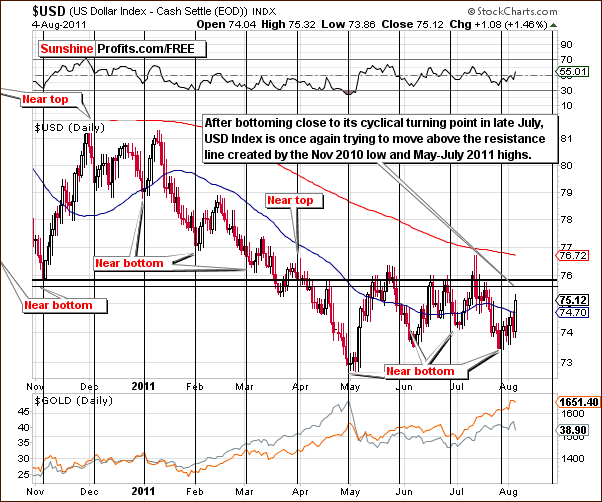
In the short-term USD Index chart, we see that a local bottom recently coincided with a cyclical turning point and the index has rallied since. Additionally, we see no breakout yet above the resistance level created by last November’s low and multiple smaller local highs seen in the past few months. Simply put, the jury is still out as far as where the dollar goes from here. Volume levels in the UUP ETF (which is not featured this week) suggest that the odds of a move higher from here are quite high. This would have negative implications on the precious metals sector and especially upon metals.
Summing up, significant changes were seen this week as the Euro Index has invalidated its breakout and the USD Index has done the same with its breakdown. This bullish development for the dollar, if confirmed, could have bearish implications across the precious metals sector.
General Stock Market
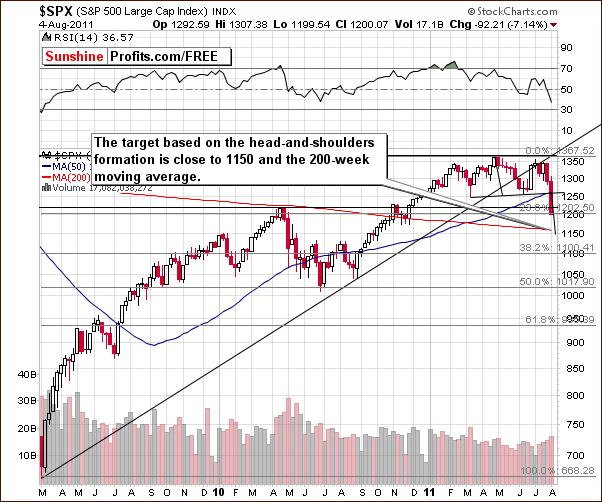
In the medium-term S&P 500 Index chart this week, the huge decline seen on Thursday leads us first to the obvious question of whether it seems that the decline has finished. It seems likely not to be the case. The decline was broad-based and turnover levels were fairly high as well. What adds to the bearish signals is that a head-and-shoulders bearish formation has been recently completed.
The head-and-shoulders pattern, now complete, allows us to create a downside target level by extrapolating the size of the rally up to the point of the head and applying this to the downside at the end of the pattern. This leads us to a target level of around 1150 which coincides with the 200-week moving average. This is noted by the red line in this week’s chart and appears to be the best bet for a short-term target level. Please note that this moving average proved to be an important resistance level in April 2010 and it may prove to be a support now. Where the index will go from there is difficult to project (and depends to a large extent on the decision regarding the QE3) but the situation overall looks quite bearish right now.
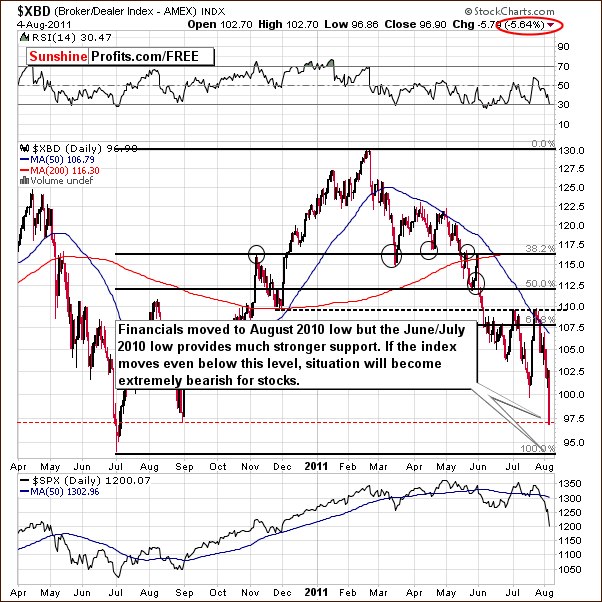
In this week’s XBD Broker-Dealer Index chart, we saw additional declines this week and the bullish outlook here from one week ago is now long gone. We have actually seen the financials move below the previous lows and the index is at the support level of the late-August 2010 local bottom.
Further declines are possible and a much stronger support line created by the June-July 2010 low could be reached soon. This level will most likely stop the decline (at least for a while). However, if the index moves below this strong support line, the situation will become extremely bearish for stock in general. This could actually create a situation somewhat similar to 2008 which saw huge declines since no significant support levels would come into play for the financials soon.
Summing up, the overall situation for stocks looks quite bearish at this time. The financial sector, which normally leads the general stock market, has declined significantly and could continue to do so. It’s likely that the general stock market would follow such a lead.
Correlation Matrix
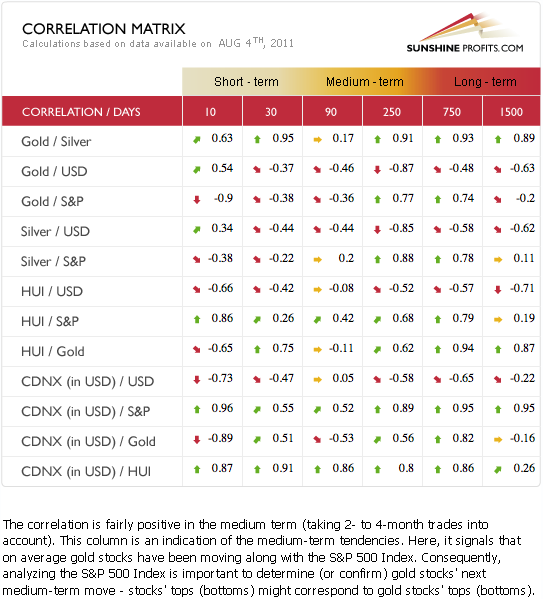
In this week’s Correlation Matrix, the focus this week is generally on the general stock market and its important influence upon the mining stocks and silver.
It seems now that if the general stock market continues to decline, the mining stocks will likely do the same. While silver may also follow this path, this is a bit trickier to predict because of the influence of the dollar. If the USD Index does not break out above the declining trend channel, this will be a bullish development for silver.
The situation clearly appears mixed at this time since no clear indicators have appeared as far as the metals markets are concerned. Moreover, we cannot be certain of the shape of the relationship between the general stock market and the metals. It’s possible that Thursday’s huge decline in stocks could be the end of lower stock prices for the time being as the strongest sectors/stocks tend to decline heavily at the end of a decline and then sharply bounce back. It would be very interesting to watch how the metals would react to a consolidation in the general stock market (at this point such a consolidation would be signaled by a small rally or a pause in the decline). If metals declined anyway, it would likely spell the beginning of bigger declines but if they rallied strongly, Thursday’s decline in the precious metals could turn out to be simply a pause within a bigger rally.
Gold
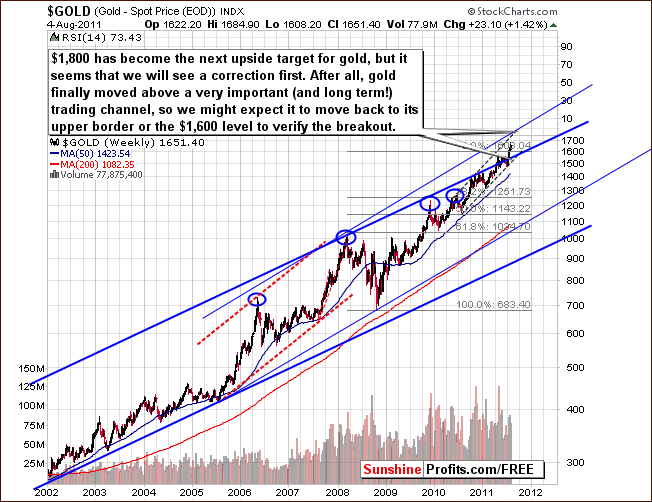
In this week’s very long-term chart for gold, there has been a very important development. Finally, gold has decisively and visibly moved above the rising, very long-term trend channel which was created by the entire bull market which began around 2002. This means that our upside target now is $1,800.
This new target level may or may not be approached immediately. It is possible that we have actually seen the beginning of a pause in the rally already and price declines to $1,600 or slightly below are possible. At this point, it does not seem likely that any price decline would be much lower. The upside is about $150 above Thursday’s closing price. The most bullish point in this recent move is that it is not only visible in terms of the dollar but also on the non-USD side as we’ll see in our next chart.
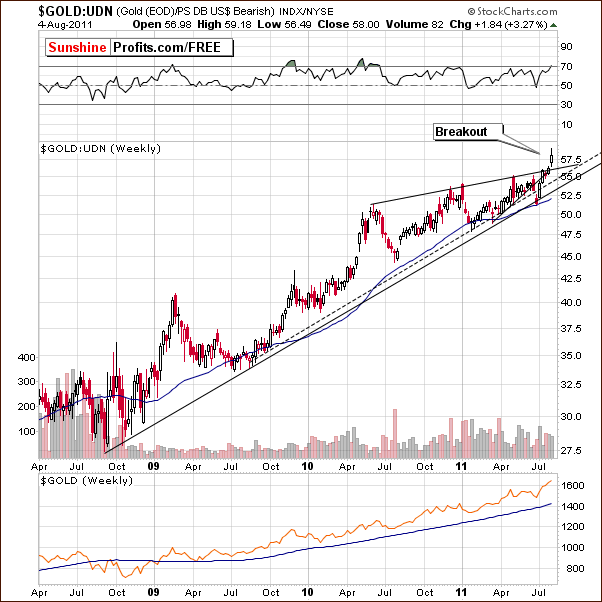
In gold’s long-term chart from a non-USD perspective, we see a confirmation of the breakout seen on the USD side. This is important in that it makes a decline below the $1,600 level appear even more unlikely. This is one of the reasons that we summed up Wednesday’s Market Alert with the following: “…we're suggesting being fully invested with one's long-term gold investments.” The upside target rewards appear to be quite attainable in just a matter of time. It seems well worth waiting for based on the downside risk present today.
Additionally, if the above-mentioned breakout holds, then gold could rally even despite an analogous move in the USD Index. It’s far from being certain right now, but we’d like you to take into account the fact that such a possibility exists.
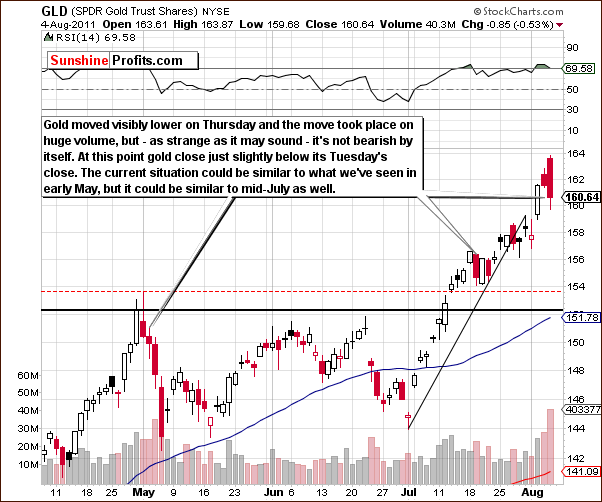
In this week’s short-term GLD ETF chart, the situation at first glance appears somewhat bearish. While it is true that Thursday saw a decline which erased the rally of the previous two days, the closing price was only about 0.5% below where it closed Tuesday and above Monday’s close. So in fact, there was very little decline over the three day period.
It is possible that a consolidation period similar to what was seen in mid-July is once again upon us. However, the situation could also develop in the manner seen in mid-May where a significant declined followed. If the latter is in fact seen, gold’s price could decline to the level of previous highs or slightly below 155 for the GLD ETF. Keep in mind also that a repeat of what was seen in July would likely lead to higher prices and a confirmation of the breakout. Clearly, two very different possibilities lie on the table at this time with respect to gold’s next move.
Summing up, the short-term situation for gold appears mixed at this time as a number of possibilities exist concerning gold’s next move. This does not affect the medium-term outlook however, which remains bullish.
Silver
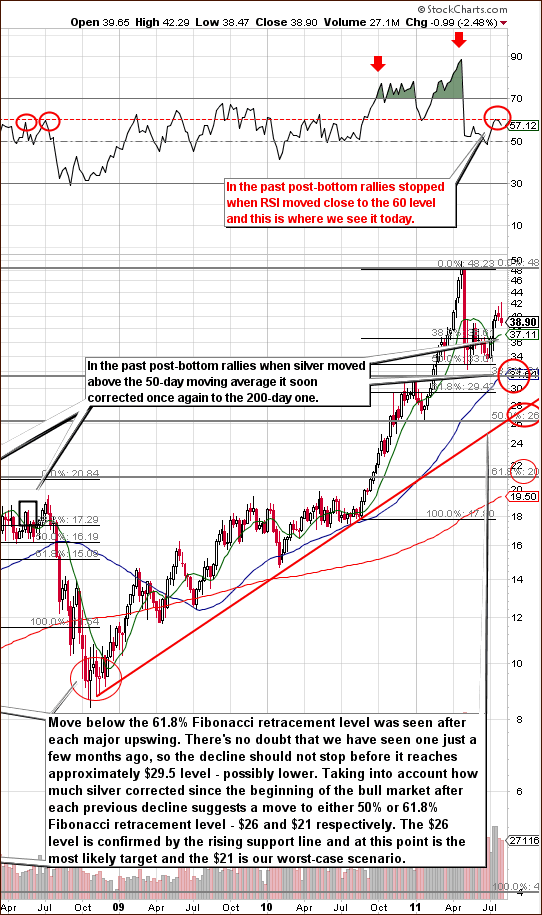
In this week’s very long-term chart for silver (please click the above chart to enlarge), a decline in silver’s price and its RSI level are apparent. In previous situations where rallies followed major tops and consecutive bottoms, the ensuing decline stopped when the RSI reached the level of 60 and that’s about where we saw it last Thursday’s close – price has declined since that time.
It seems that history repeats itself since we had seen silver’s price rise initially which was followed by a significant decline on Thursday. This slump erased the gains of the past two to three weeks. Right now, the situation is clearly less bullish here than it is for gold. With a likely downside target level close to the 200-day moving average, silver’s price could decline to the $32 level. If stocks truly plunge from here, then silver could still move even lower (please recall what happened in 2008).
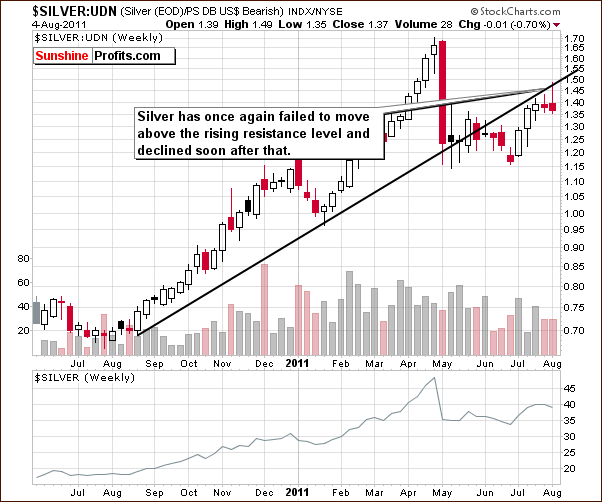
In silver’s long-term chart from a non-USD perspective, silver is seen to once again fail to move above the rising resistance line. With a decline following this failed attempt, there is obviously no breakout in the works here and the picture clearly appears to be bearish for the short term.
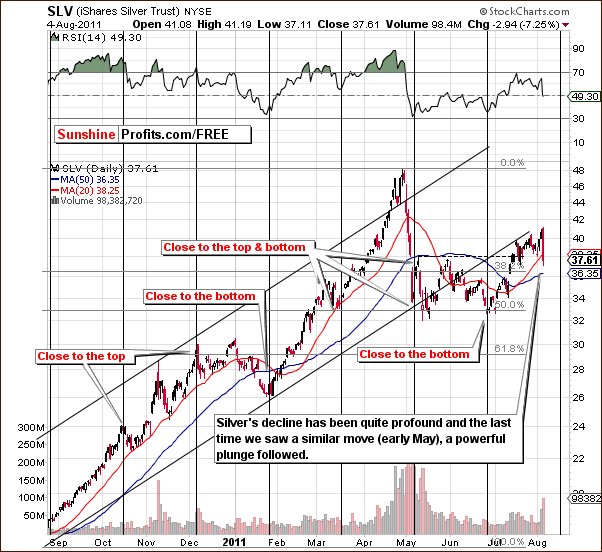
In the short-term SLV ETF chart this week, the situation also appears rather bearish. Silver’s price declined sharply on Thursday and this decline was accompanied by significant volume. Generally, this type of move after a big rally often marks the beginning of a bigger move to the downside.
Similar situations were seen last November and also in early May this year. In both of these time frames, high volume levels accompanied sharp drops in price and a period of further declines followed. It is therefore probable that declines will be seen from here. With RSI levels not in the oversold range, this is another indication of a likely move to the downside.
Summing up, the situation is quite bearish for silver at this time. While it is possible that the phenomenon of its recent price action is an indication of the final stage of a decline (when the best stocks/sectors tend to drop heavily), it nevertheless seems more likely that a decline may be seen from here. The short-term moves in the general stock market will greatly clarify the situation in silver. If the white metal’s price declines from here while the market moves higher (or does nothing), much lower prices will likely follow for silver.
Gold and Silver Mining Stocks
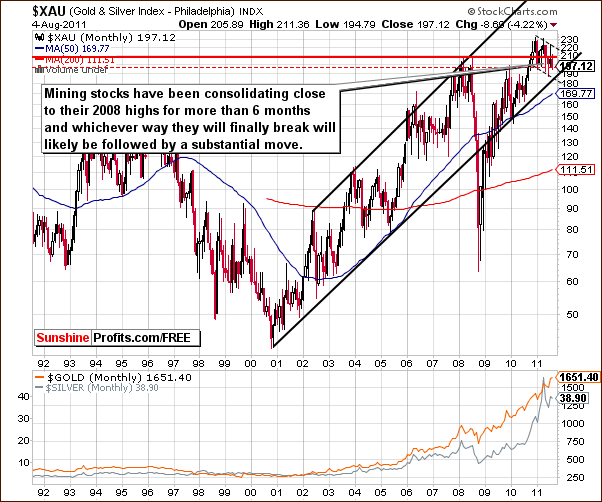
In this week’s very long-term XAU gold and silver mining stocks index chart, we see a continuation of the recent sideways price action, a consolidation period which has been ongoing for more than six months now. There is some indication that a flag pattern formation may be in the works or that the mining stocks may attempt to breakout above the level of their 2010 highs. At this point, it is quite interesting to watch, for if the index ends up declining from here, a significant plunge would then be likely. Conversely, if the index does move to the upside, a powerful rally could indeed follow.
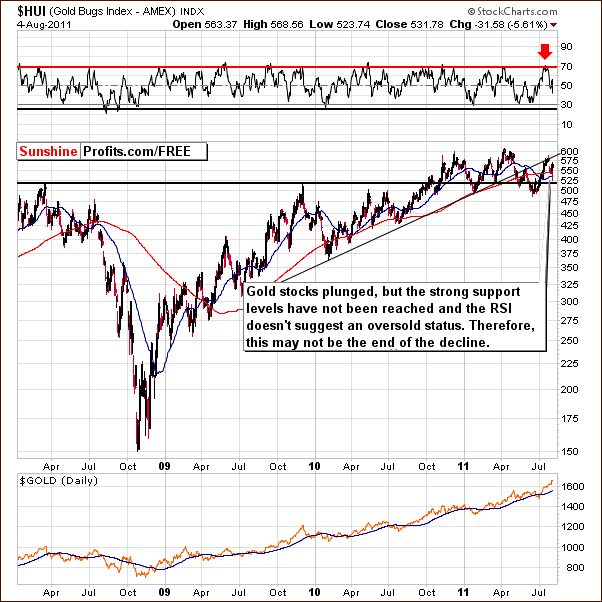
In this week’s long-term HUI Index chart, the recent plunge in this gold mining stocks index is clearly sharp and profound. With the index level still quite a bit above a significant support level and RSI levels above the oversold level, we are a long ways from stating that the decline is completely over. In fact, we could be seeing the right shoulder of a lengthy bearish head-and-shoulders pattern. If the index moves decisively below its 2011 low and this breakdown is verified, an additional quick move lower would be quite likely.
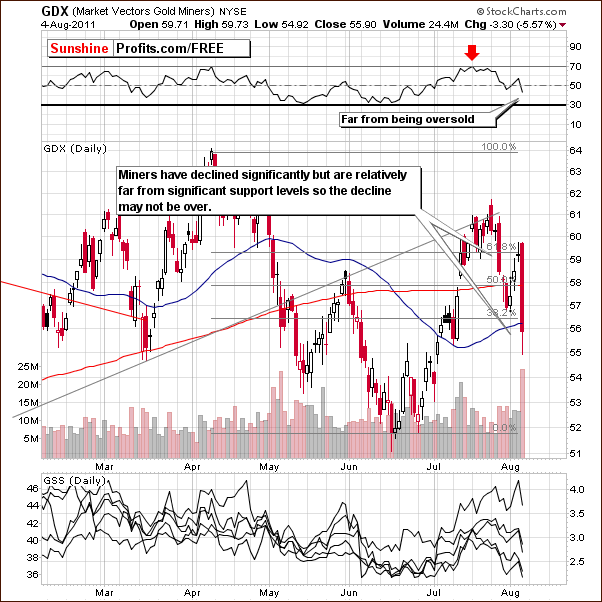
In this week’s short-term GDX ETF chart, we look to volume levels for a confirmation of the recent price declines. We see that volume levels have indeed been significant and this suggests that the decline is likely not yet over. The price action seen recently is also not consistent with that around previous local bottoms.
Large price declines accompanied by significant volume after a corrective upswing have normally been followed by a period of decline greater than a day or two. It therefore appears that more declines are likely from here. With no significant support line close to current price levels and with the RSI far from the oversold level, the overall situation appears bearish in the short term.
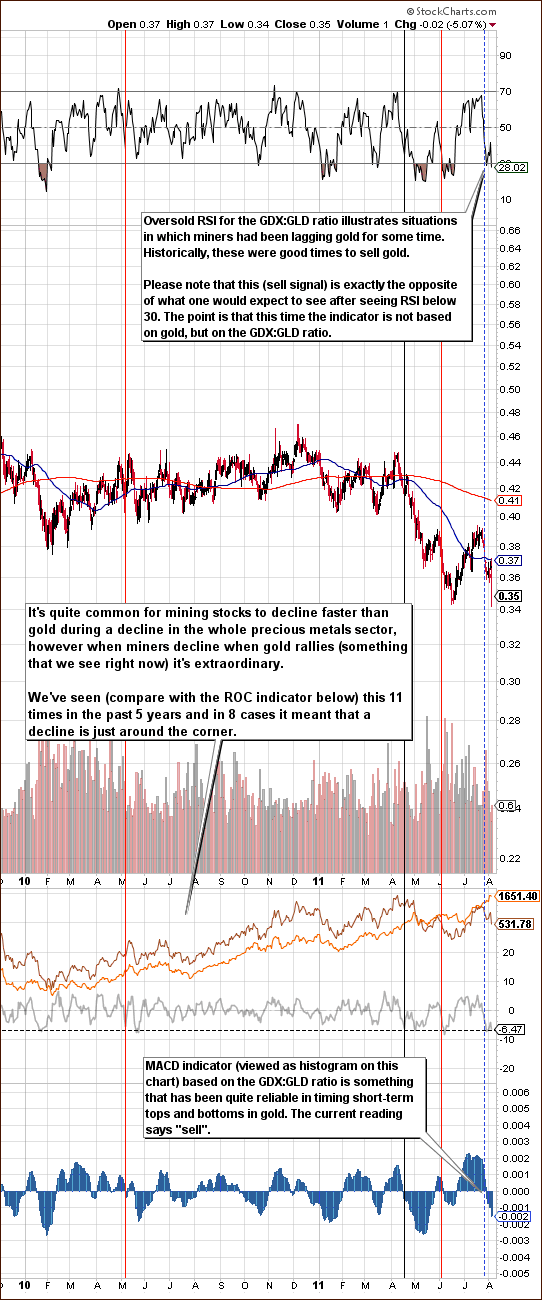
The GDX:GLD ratio looks at the ratio between mining stocks’ prices and that of gold (please click the above chart to enlarge). In Sunday’s Post-update Update, we stated the following:
Miners' underperformance is now extreme, so we decided to take a very detailed look into the ratio between mining stocks' prices and that of gold. At first glance the situation appears to be something we've seen many times - sometimes mining stocks lead and sometimes they lag gold, no big deal. However, we felt that this analysis is not deep enough and that we're missing something. So we decided to take a more quantitative approach and apply the ROC (rate of change) indicator for the GDX:GLD ratio (miners vs. gold) and compare that to the price of gold. We found some interesting patterns and after additional research (i.e. using practically all reliable indicators on this ratio) we discovered that RSI and MACD used to provide quite accurate calls as well.
Indicators on the above chart implied that we were at a local top. On the other hand, other factors suggested that the markets would rally. As a matter of fact, we saw gold rally but the mining stocks decline heavily. Since the mining stocks often lead the underlying metals, we can conclude that the situation now appears bearish. Much depends on the general stock market, because if stocks continue to decline, there will likely be a great impact on precious metals. Even if stocks pause in their decline, it will be important to check what effect this has had on gold, silver and on the mining stocks.
At this point, we still see a sell signal since the mining stocks are underperforming their underlying metals. The RSI level is below 30 (which in case of the GDX:GLD ratio is a sell signal) and we continue to see signs of a move to the downside from the MACD histogram and the ROC Indicator which shows a sell signal. The overall situation is clearly bearish.
Summing up, the situation in mining stocks continues to be bearish at this time. Although there appears to be a possibility of a move to the upside when analyzing this week’s very long-term XAU chart, declines are strongly indicated by both the long-term HUI gold mining stocks index and the short-term chart GDX this week.
Platinum
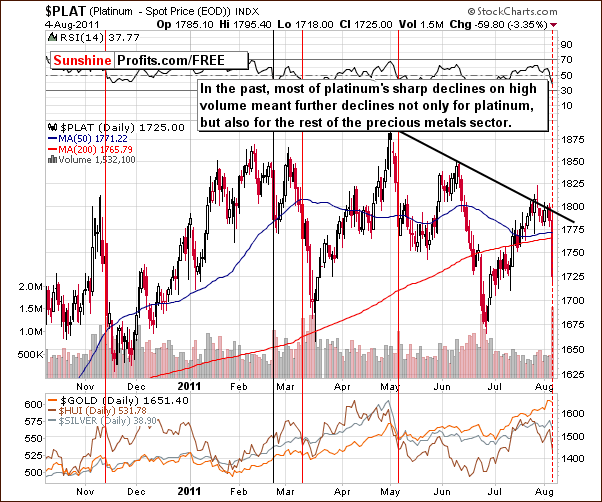
In this week’s long-term chart for platinum, the focus should probably be on the fear created by the fact that the recent decline was huge and accompanied by significant volume. This has only been seen on a few occasions in the past year or so and it usually does not coincide with the end of a decline. This is true not only for platinum but for the rest of the precious metals as well. So the suggestion here is that further declines are likely on the horizon. Bearish indications are apparent in analyzing platinum this week.
Meanwhile, we have just seen a signal from one of our proprietary indicators…
Sunshine Profits Indicators
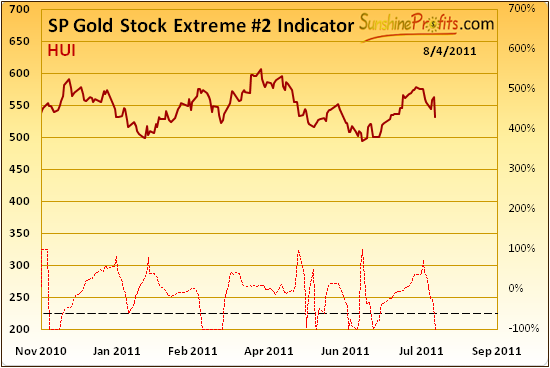
In our SP Gold Stock Extreme #2 Indicator, we see a move below the dashed line in the lower section of our chart. This translates to an extreme signal but is not the bullish signal we hoped to see. We are still awaiting a signal as to a local bottom.
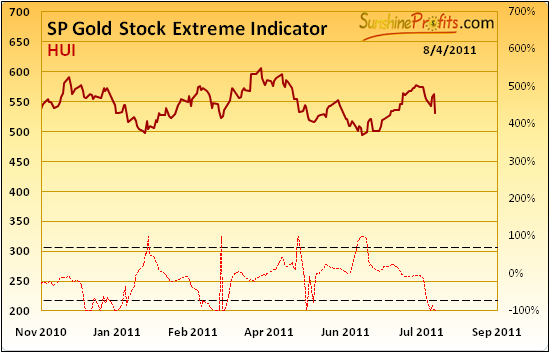
Namely, we expect to see a move above the dashed line in the upper section of the SP Gold Stock Extreme Indicator. This has been seen several times in recent months and in all cases coincides with local bottoms for gold stocks and gold.
With both indicators presently below the bottom dashed lines, we have a situation which has been seen twice before. In February 2011, gold was close to a local top (both indicators below their lower dashed lines) and a decline followed. In May (same situation) however, a small rally ensued and a decline soon followed. So the signals are mixed from our indicators this week but overall are slightly bearish. Simply put, we do not view anything here as bullish.
Juniors
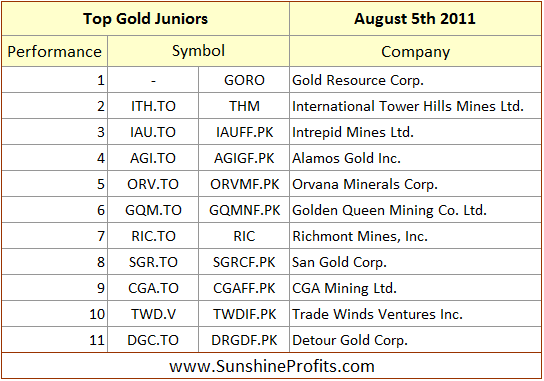
As stated in the Key Principles section, the list of top juniors will be updated approximately every 4 weeks, so this is the Update that should contain the revised version of the list.
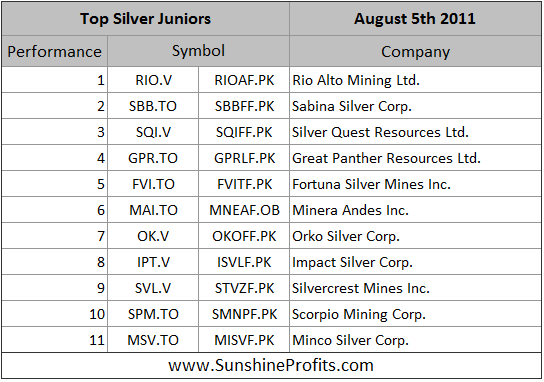
Generally, there were only a few changes as far as our preference regarding juniors is concerned. Centamin Egypt Ltd. was substituted with Trade Winds Ventures Inc. on our gold list as it seems the latter has a bigger potential moving forward. As far as silver list is concerned, we removed Aura Silver Resources Inc. as it was not performing as well as the rest of our top picks.
Please note that we have not been favoring junior over senior since a few months now as juniors move on average very similarly to big senior stocks, so we don’t view taking additional junior-related risk as justified.
It will be interesting to see how these and other juniors hold during the current decline in main stock indices and – possibly – in the precious metals sector – this will allow us to estimate the true strength of each company.
Letters from Subscribers
This week we have a letter from a Subscriber which he titles “some thoughts from an old man.” He writes:
I am from the old school and was around in 1980 when the market came crashing down... I am a firm believer that all good things must come to an end as they did 1980. (…)
Currently, antique $20 gold coins are trading at about the spot price of gold. It is a sign that Coin Dealers a hedging and fear a drop in metal prices. The old $20 gold coins have a little less than an ounce of pure gold in them.
The jewelry business across the Country is an Also Ran business. If it weren’t for buying scrap metal, most, including the largest business in America, would be out of business. Gold earrings that I used to sell for $45 now cost well over $100.
Our comment is that with insiders (here: coin dealers) moving out of the gold market (hedging their exposure) the situation in gold appears due for a correction. However, how low it could go is a different matter. If the correction stops at / above $1,600, the situation will remain bullish in the medium term.
Another reader suggests another cause for the gross underperformance of the miners against gold and silver. He says it is due to “price manipulation carried out by collusion between the "banksters" and ratio hedge funds.” He says hedge funds that have shot positions on gold stocks borrow billions from banks to short the stocks even further, create panic with hopes that the price will go down so that they can cover their short positions and get out.
No doubt this will be regarded by some as fairytale stuff. But consider silver- shorting and JP Morgan and it sits fair and square in the realm of reality. I would suggest it is even more rife now than in the Enron days - and once again, the big banks who have brought ruin to thousands with their junk mortgage packages are still allowed to carry on their unethical practices.
Our answer is that there are reasons for miners' underperformance even without taking the manipulation theory into account. Each stock's share prices are ultimately driven by a company's earnings power. In other words, the sustainable net income a company generates per share, the bigger the price of this share. Profits are not only drive by revenues but also by costs. If costs rise, then profits may not rise even despite an increase in revenues.
In case of mining stocks we need to consider not only the price of metal that a given company produces, but also this company's costs. Since a big share of company's costs is related to the price of crude oil (the most versatile commodity), we need to take into account its price. With oil around $100 and expectations of higher prices investors discount this i and project lower profits. Thus, the share price does not increase as one would expect it to - based on the gold price alone.
Another reader wanted to know our take on the debt ceiling issue as it pertains to precious metals. The reader ventured his opinion that without a proper corrective solution the bleeding will continue. This means no default, continued devaluation of the dollar, and higher inflation, mixed with new found interest in precious metals by the average citizenry via greater exposure to the problem at hand. But then, all of that could be offset by high volume dumping of gold and silver via governments who want to hide the inflation with artificially low prices on gold and silver.
We believe that the information about raising the debt ceiling was in the market for some time (it was very unlikely that the US gov't would vote for country's default) and consequently it didn't have much influence on the market.
We agree that the most probable outcome from here is the lack of proper corrective solution to more debt. We think that the powers that be will continue to do what they are doing - spending their way to get more votes and pushing their luck as far as possible. Then, at some point they will pull some kind of ace from their sleeve and change the rules (financial system) so that it appears that they did the right thing (or that they did what they had to and they had no other choice). This could take form of introducing a new currency or something of similar magnitude.
At the same time we doubt that governments will be willing to dump their holdings on the market. Governments are typically not too good investors - they sell low (Brown Bottom) and buy high. In fact, governments throughout the world have been buying gold eagerly this year.
Anyway, precious metals are still likely to move much higher in the long term.
Another reader would like to know if there is a downside to getting into mining stocks right now.
We say that with long-term capital, the risk is to be out of the metals market. At this point we're taking this risk with silver and mining stocks (with a part of the long-term capital that is) because of their historical correlation with the general stock market and the possibility of a big decline in the latter. In 2008 stocks have heavily impacted these both markets (much more than it was the case with gold) and there's a chance that this could be repeated to some extent. Naturally, we're not saying that silver and mining stocks will reach their 2008 lows (it's unlikely), but they could move substantially lower if stocks plunge.
Our last question this week is about the possibility of another round of Quantitative Easing that could be announced in the policy meeting next Tuesday. The reader wanted to know what happens to silver if some form of QE3 announced.
Silver would indeed rally; however the question is if stocks and commodities have declined enough for the QE3 to be announced.
As we’ve stated in one of the previous Premium Updates, we suspect that the Powers That Be really want to see some kind of slide in values of stocks and commodities only to have a justification for another QE - and we think they will succeed in getting it. If you were in Bernanke's place, would you say "OK, it didn't really work, let's pump some more money into the system one more time even though prices are skyrocketing, cross our fingers and that it will work this time" or would you prefer to say "we did a good job, QEs were effective, and we can stop that for now as we really care about foreign US bond investors. Also, we want to take care of inflationary forces and make sure that the core inflation remains stable. The situation is under control." Then after prices tumble, you could say "well, we did our best in order to protect bondholders, but it seems that we need to use our super-effective (they worked perfectly last time, right?) QEs in order to protect jobs and stimulate growth." We will get back to making sure bondholders are safe once we take care of this problem".
Sounds clever, evil and... realistic? The call is up to you.
Summary
Both of the currency markets had some important developments this week. The euro appears to have invalidated its breakout and the dollar seems to have invalidated its breakdown. A bullish outlook for the dollar will arise if its breakout above the declining short-term trend channel is confirmed. This would likely have a negative impact upon the PM sector, particularly upon gold and silver.
The general stock market declined heavily this week, especially on Thursday, and the decline appears not to be over. It is possible that some consolidation or a pause in the decline could be seen. The implications are bearish particularly for gold and silver mining stocks and silver itself. Gold however appears likely not to be affected as much. A major rally in the dollar however, may have a negative impact on the yellow metal.
Gold itself has been holding up quite well and its strength can be seen in both the non-USD perspective and on the USD side. Even if its price declines from here, it will likely bottom near the $1,600 level and then could very well rally to $1,800.
The mining stocks in general have a bearish outlook. Silver’s is somewhat mixed with bearish implications and overall there has been little change since Wednesday’s Market Alert. It still appears best to have long-term capital dedicated to gold fully invested in the yellow metal. However, the long-term capital dedicated to silver and the mining stocks should not be fully invested at this time. Speculative capital seems best to be held awaiting more clues and only the most risk tolerant should consider opening short positions in silver/mining stocks. This is not recommended for most.
We will continue to monitor the situation closely, especially with respect to the precious metals reaction to the strength of the general stock market. We will provide our insights as more information becomes available and report to you accordingly.
Our next Premium Update is scheduled for Friday, August 12, 2011.
This completes this week's Premium Update.
Thank you for using the Premium Service. Have a great weekend and profitable week!
Sincerely,
Przemyslaw Radomski

