
Here are two words that Americans and the rest of the world have not paid much attention to until now: DEBT CEILING. The debt ceiling drama has been keeping Americans on the edge of their seats –and they better hold on tight as those seats could get repossessed on August 2. It’s as if American’s national credit card, member since 1776, is valid only through 08/02/11. In a nutshell, the debt ceiling is America’s legal limit on borrowing, and the country is maxed out until Congress increases it.
The U.S. is the only democratic country, besides Denmark, in which Congress has to approve borrowing separately from spending. In most other countries the authority to borrow money is inextricably tied to the authority to spend money.
As of the publication of this Premium Update, there is still no compromise in this high-stake fiscal fracas of who will blink first, President Obama or the Republicans who argue that simply raising the ceiling over and over again is an unsustainable policy and are demanding budget cuts. Precious metals have been direct beneficiaries of the impasse. After a setting an all-time high on Wednesday of $1,628, spot gold took a breather on Thursday after hitting record highs for two sessions this week. Since the beginning of the year, the price of the precious metal is up 13.58 percent, closing at $1,614.40 an ounce on Monday. This includes an increase of $12.90 on Monday alone.
The stalemate may cost America its AAA rating, adding $100 billion a year to government costs while dragging down economic growth.
Under normal circumstances there is not a big brouhaha in raising the debt ceiling. After all, since March 1962, the debt ceiling has been raised 74 times, according to the Congressional Research Service. Ten of those times have occurred since 2001.
For more detail on the history of the debt ceiling in the U.S., please take a look at the chart below.
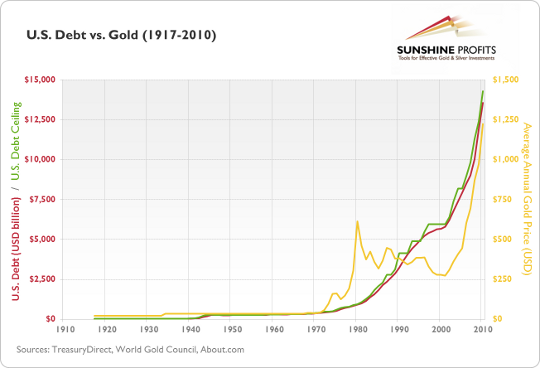
As you might see, gold has roughly followed the rises in the U.S. debt level since 2000. On the other hand, you will also surely notice that there were periods in gold’s history when the metal traded without visible correlation with the aforementioned debt. In short, the above chart confirms that growing uncertainty linked to the growing debt pile might fuel the price of gold, however it also confirms that markets cannot follow a given economic indicator with reasonable precision at all times and confirms what we’ve emphasized many times – that fundamental factors can only point you the general direction in which a market is going, but they do not provide timing details.
Let’s get back to the debt itself. It seems that Obama has taken his case directly to the public with increasing urgency.
“History is scattered with the stories of those who held fast to rigid ideologies and refused to listen to those who disagreed,” Obama said. “But those are not the Americans we remember. We remember the Americans who put country above self and set personal grievances aside for the greater good.”
He added: “That’s who we need to be right now. The entire world is watching.”
His best line: "The American people may have voted for divided government, but they didn't vote for a dysfunctional government.
The worst case scenario is that the U.S. will miss payments on its bonds and default — which financial experts say would be disastrous with dire consequences around the globe. The U.S. would most likely lose its AAA bond rating for the first time leading to market panic. Ratings agency Standard & Poor's this month warned there is a 50% chance it will downgrade the U.S. within the next three months. Fellow ratings agency Moody's has also put the U.S. on review for a possible downgrade. In the long term it could push interest rates up for everyone and further weaken the dollar's position as the world's reserve currency. There are consumer fears of doomsday scenarios such as missed Social Security payments and other draconian cuts in government services.
Total debt of the federal government can increase in two ways. First, debt increases when the government sells debt to the public to finance budget deficits and acquire the financial resources needed to meet its obligations. Second, debt increases when the federal government issues debt to certain government accounts such as the Social Security and Medicare.
The debt ceiling was first set in September 1917 to help finance the costs of World War I. At that time, Congress authorized the issuance of about $7.5 billion in U.S. bonds and another $4 billion in certificates of indebtedness, under the Second Liberty Bond Act. How much was $11.5 billion dollars back then if you account for inflation? In 2011 dollars, it would be about $193.2 billion. Currently, the debt limit is set at $14.3 trillion. The debt ceiling was raised to accommodate accumulating costs for World War II in each year from 1941 through 1945, when it was set at $300 billion. After World War II ended, the debt limit was reduced to $275 billion. Because the Korean War was mostly financed by higher taxes rather than by increased debt, the limit remained at $275 billion until 1954. After 1954, the debt limit was reduced twice and increased seven times, until March 1962 when it again reached $300 billion mark. (To learn more about the history of the debt ceiling go to this video.)
The debt ceiling hit $1 trillion in 1982 -- less than 30 years ago. Since then, it has increased exponentially. Over the 94-year period, the debt ceiling has been revised 102 times. The U.S. isn't fighting a world war, but the nation's government is borrowing like it is. Our estimate is that there will be a compromise deal. It is difficult to believe that the Republicans will want to be blamed for the financial chaos that will result from a U.S default. What is the best strategy for investment during this period of uncertainty? Hold on to your gold. With both the dollar and the euro in trouble, and the Swiss franc looking very expensive gold is one of the few safe havens left on the planet. If the unlikely happens and the US defaults, gold will skyrocket. Gold may dip in the short term and go into correction mode when the powers that be reach a compromise and a new debt ceiling is announced. But then it’s likely to bounce as US state borrowings are bound to rise further.
The math is simple. An article in Canada's The Globe and Mail's business section laid it out nicely:
US federal spending
Fiscal year 2010 (in billions of US dollars)
- Discretionary $660
- Other mandatory $416
- Net interest $197
- Medicare and Medicaid $793
- Social Security $701
- Defense Department $689
TOTAL: $3.456-trillion
Now compare that to...
US tax receipts
Fiscal year 2010 (in billions of US dollars)
- Social Security/Social insurance $865
- Corporate income $191
- Other $140
- Excise $67
- Individual income $899
TOTAL: $2.162-trillion
As you can see, there is a bit missing.
With so much hanging on the balance, let's begin this week's technical part with the analysis of the Euro Index. We will start with the short-term chart (charts courtesy by http://stockcharts.com.)
Euro - USD Indices
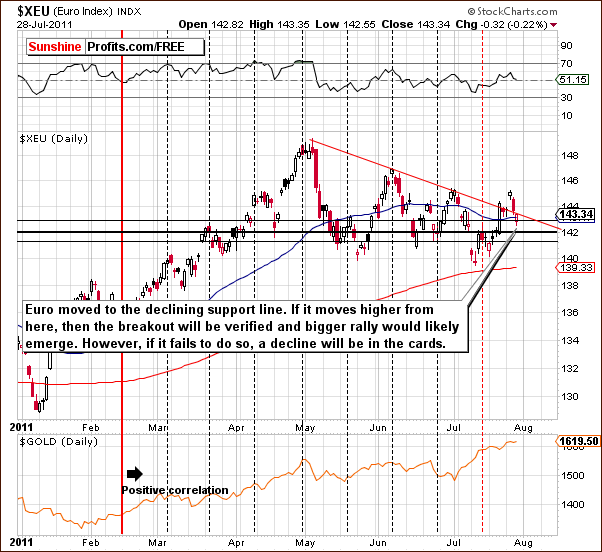
In the short-term Euro Index chart this week, we see that a recent breakout above the declining resistance line was quickly followed by a move back to it. At this point, it appears that we may be seeing an invalidation of this breakout as the index level moved below the support/resistance line and then back up to it. The situation is indeed tense, for if a rally is seen from here, we could have a confirmation of a breakout. On the other hand, a move lower would likely invalidate any breakout and would be a very strong bearish signal in and of itself.
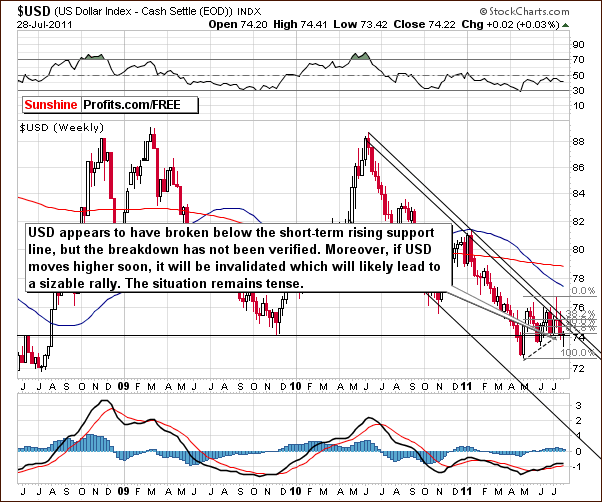
In this week’s long-term USD Index chart, we also have a tense situation. The index level is slightly below the short-term rising support line, the 61.8% Fibonacci retracement level, and the November 2010 low.
However, we saw a move back to the above-mentioned level. In the case of the USD Index, we are looking for the confirmation or invalidation of a breakdown. A confirmation would be bearish and an invalidation of the breakdown would be bullish. This causes the situation to be tense for the same reason we saw in the Euro Index. The only difference is that here we are dealing with a breakdown and the euro is dealing with a breakout.
Summing up, important days appear to be ahead in the currency markets with the euro’s breakout and the dollar’s breakdown subject to being confirmed or invalidated soon. Whichever way things turn out will likely determine the trend in both markets for at least the short term.
General Stock Market
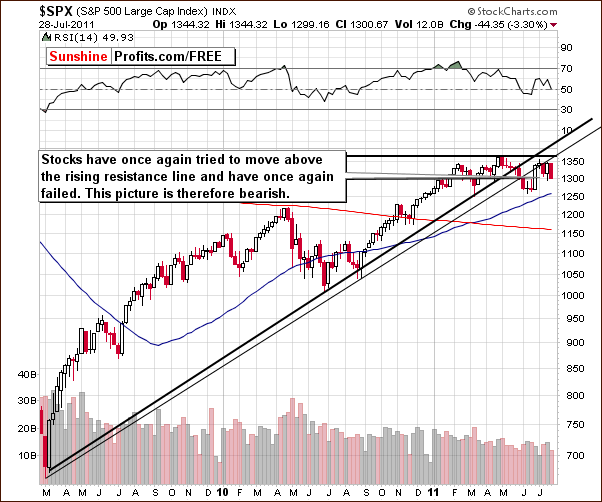
In the medium-term S&P 500 Index chart this week, we once again see a failure of the S&P to move above the rising resistance line. The trading range has been rather broad since July 1st and this is the second failed attempt to surpass this resistance line. The breakdown has not been invalidated; therefore the situation does appear bearish at this time.
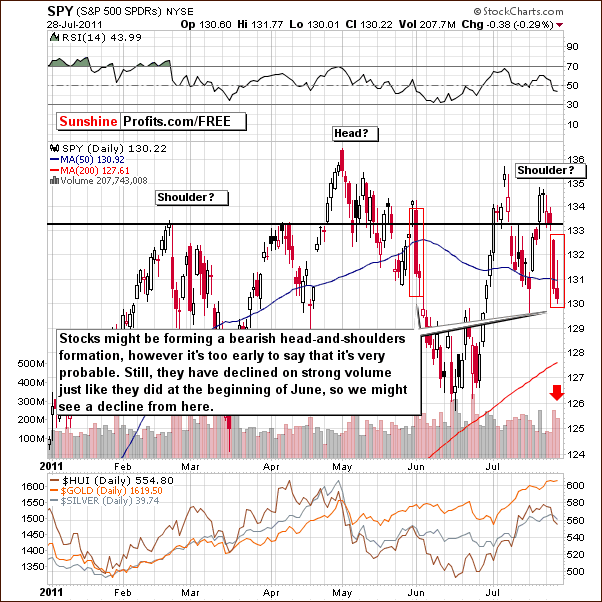
In the short-term S&P 500 chart this week, we see declines which have been accompanied by significant volume levels. This makes the move lower more meaningful. The situation today is quite similar to what was seen in early June and stocks declined significantly at that time. It is possible that we will see a similar decline in the weeks ahead.
On another note, it appears that a bearish head-and-shoulders pattern may be completing at this time. In the recent past, a number of such patterns developed but fell short of completion. In any case, this is a somewhat bearish factor here at this point.
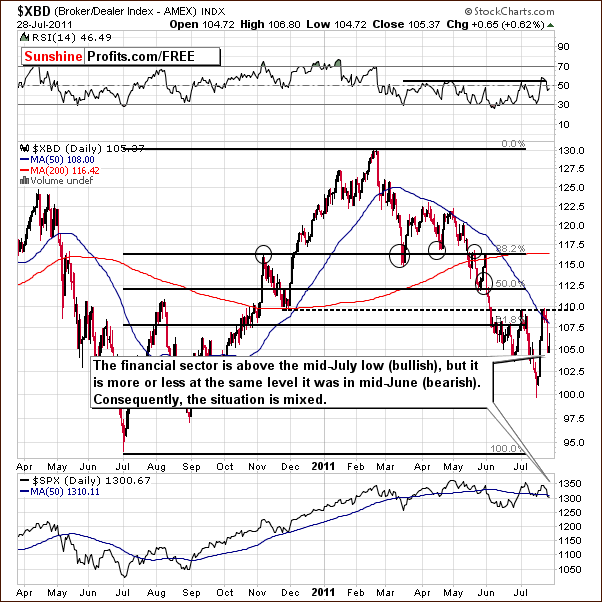
In this week’s XBD Broker-Dealer Index chart, we see a situation quite different from last week. About one-half of the gains seen in the recent rally were given back this week and the situation is no longer bullish. There appear to be two distinct possibilities from here, which causes the situation to best be described as mixed.
In one perspective we look at the current situation and compare it to the recent rally in the financials when stocks were near a local bottom. The situation now is similar but financials are trading at considerably higher levels. If we interpret the current developments in this way, we come to the conclusion that the financials are outperforming the general stock market and the outlook is bullish.
However, in another perspective, we could compare the current situation to the late June lows when financials were at similar levels as today but stocks were much lower. In this case, the financials would be lagging the market now and the situation would be quite bearish. The coming days will likely shed some light on which of these prior comparisons is most valid for these times.
Summing up, the situation for stocks in general now appears rather bearish. The S&P Index is well below its rising medium term support line and declines have recently been seen with significant volume levels. Once again, when volume levels are significant, the direction of the move is generally more accurate.
Correlation Matrix
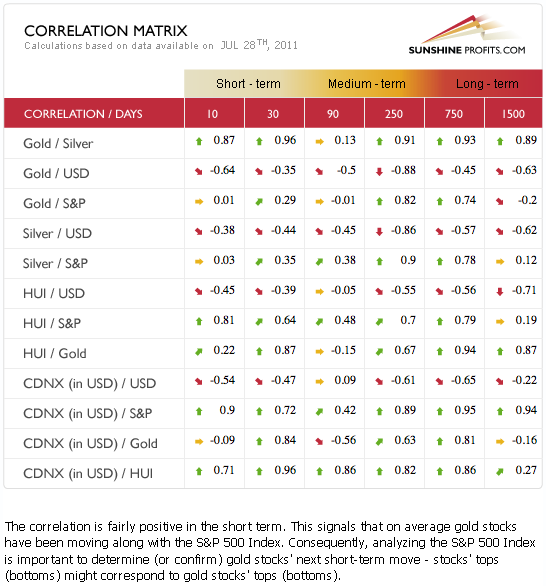
In this week’s Correlation Matrix, the coefficients from the short-term 30-day column appear to be more significant this week. A number of changes in this week’s matrix point to a possible return to normal. The negative correlation between gold and the USD Index in the 10-day column is fairly significant. This indicates that gold and the dollar have moved in opposite directions. However, ten days is not a long enough time from which to draw conclusions and make significant price predictions.
The most important implication here this week is the normalization of the relationship between gold and the dollar. These two have unnaturally moved in the same general direction recently (euro-weakness-driven) but this appears to no longer be the case. Higher values for the dollar normally result in lower gold prices and, conversely, when the USD Index declines, gold prices normally rise. It seems that we may see this type of relationship between the two once again.
The general stock market has shown some positive correlation with gold stocks in the 30-day column. The implication here is that if stocks decline, gold and silver mining stocks will likely decline as well and underperform the underlying metals.
Gold
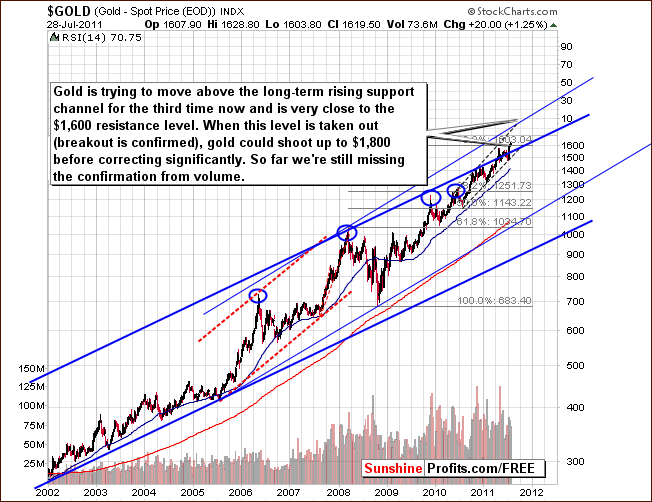
In this week’s very long-term chart for gold, we have seen a decisive move above the upper border of the very long-term rising trend channel. This move has not been confirmed by volume however, and more will be discussed on this in a later section. At this point, the situation is mixed even though it may at first appear to be very bullish.
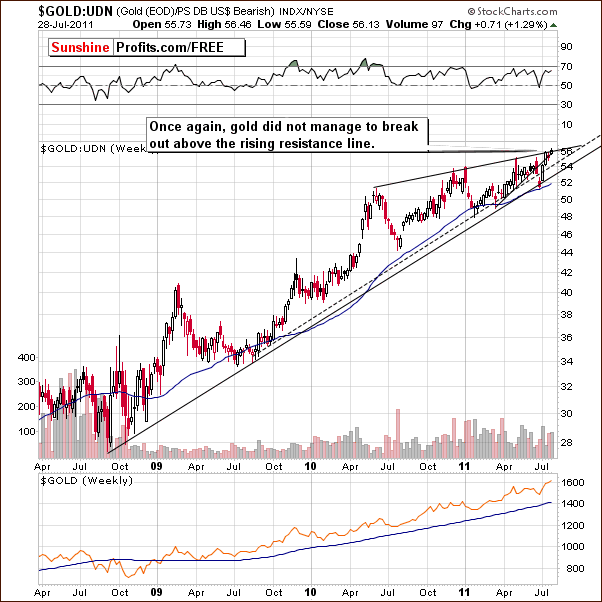
In gold’s long-term chart from a non-USD perspective, we still have not seen a breakout. The index level has barely moved in the past two weeks and although the present level is above that of previous highs, it is still right at the rising medium-term resistance line. The current price action does not constitute a breakout yet. In fact, the index is still quite vulnerable to what could be a significant decline.
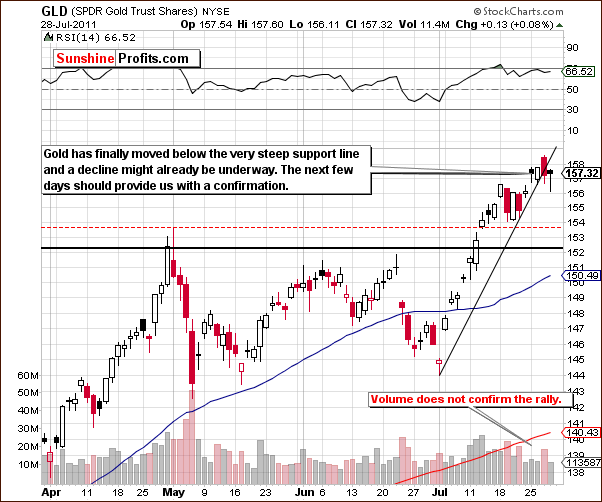
In this week’s short term GLD ETF chart, we see that gold declined visibly on Wednesday accompanied by strong volume. This was followed by sideways price movement on low volume. The signs appear bearish since moves accompanied by significant volume generally indicate the true direction of the market. In short, even though gold prices have moved higher recently, volume levels have not confirmed this move and there is no evidence to support a bullish outlook at this time.
Summing up, the situation in gold remains mixed and tense this week. We will continue to monitor the situation closely as the next several days appear to be quite critical. We will notify you accordingly when important developments take place. Later sections in this week’s Premium Update will provide more details as to the current state of the precious metals market.
Silver
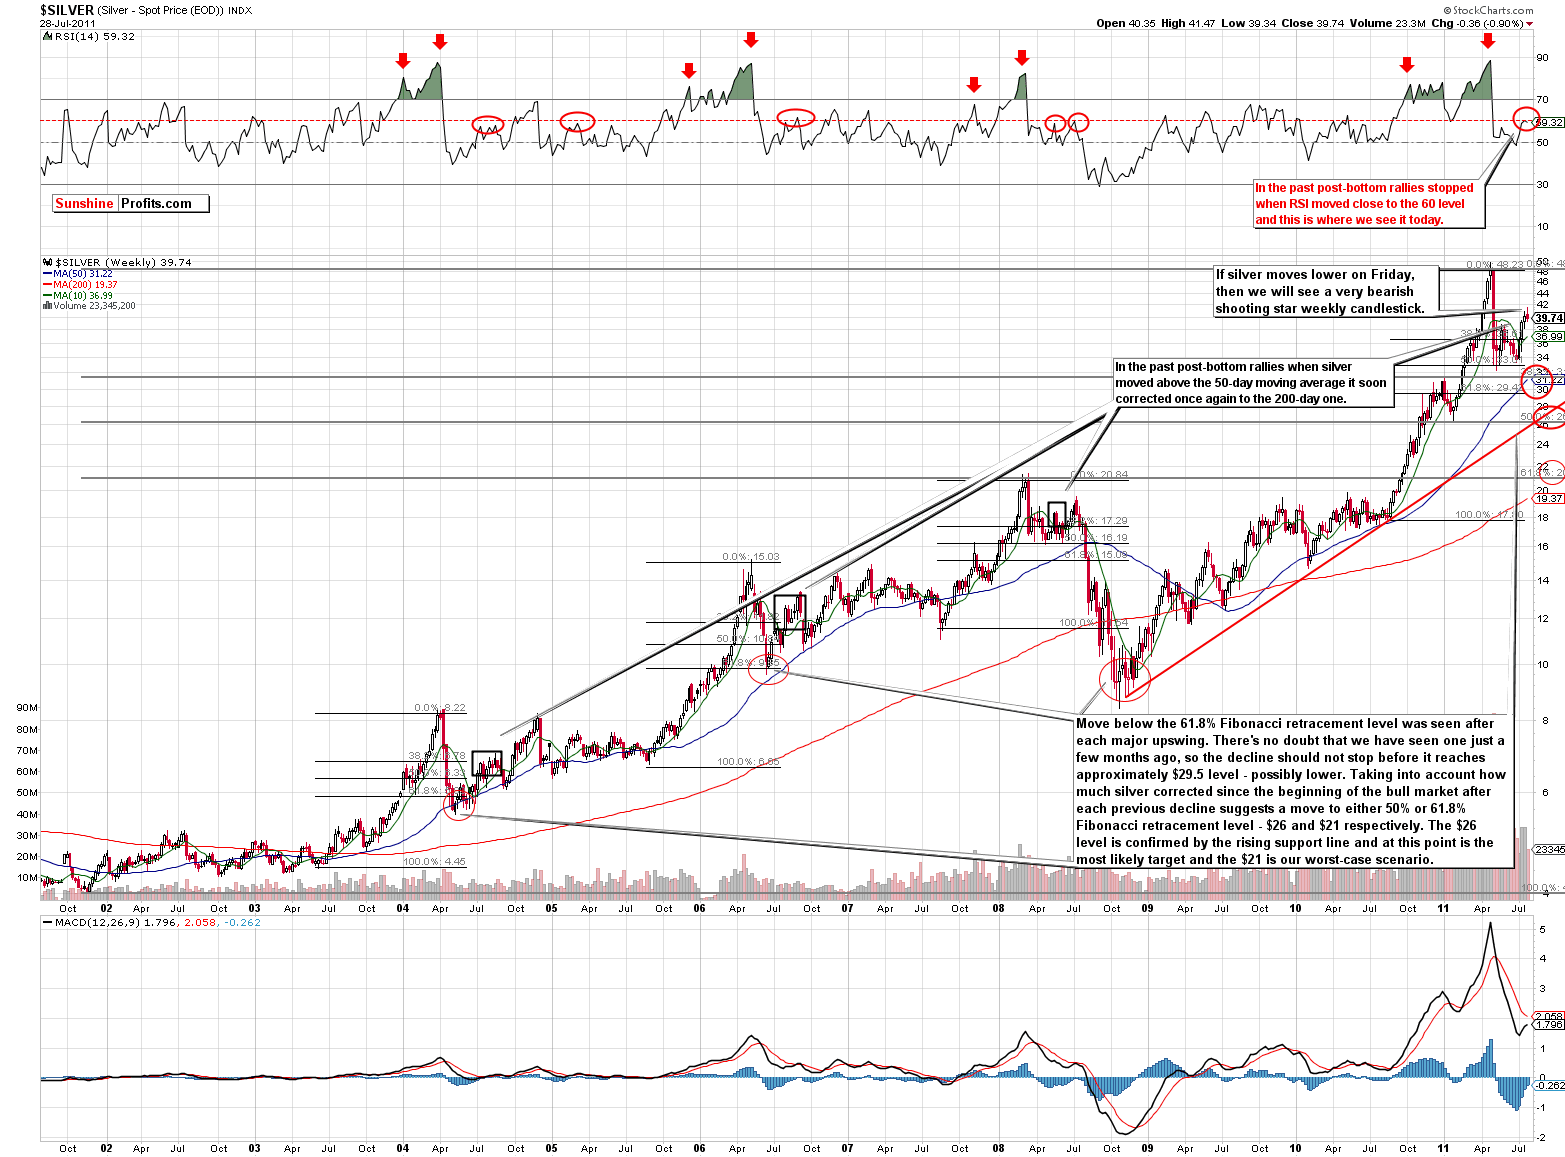
In this week’s very long-term chart for silver (please click the above chart to enlarge), the situation is very similar to what we saw last week. In last week’s Premium Update, we stated:
There’s a good possibility that we’re going to see a bearish shooting star candlestick pattern based on weekly prices if silver’s price declines on Friday. This pattern – especially when based upon weekly closing prices – is an important reversal sign. The odds of this happening appear to be fairly high. The situation therefore appears short-term bearish at this time.
Well, silver’s price did not decline last Friday so the shooting star candlestick pattern did not develop. But once again it appears that we are in an analogous situation - a price decline on Friday this week will clearly form a bearish candlestick pattern this time.
In other news, the RSI indicator, which is based on weekly closing prices, is presently close to 60. In similar past situations following major tops, this is generally the point at which silver’s rally has stopped. A decline back close to the 50-day moving average has often been seen and this would correspond to around the $31 level today. This could be where silver’s price goes in the weeks (more of an estimation than an official target at this time) ahead if the decline is indeed sharp but not extreme. The situation is somewhat unclear but such a decline is suggested by the current RSI level.
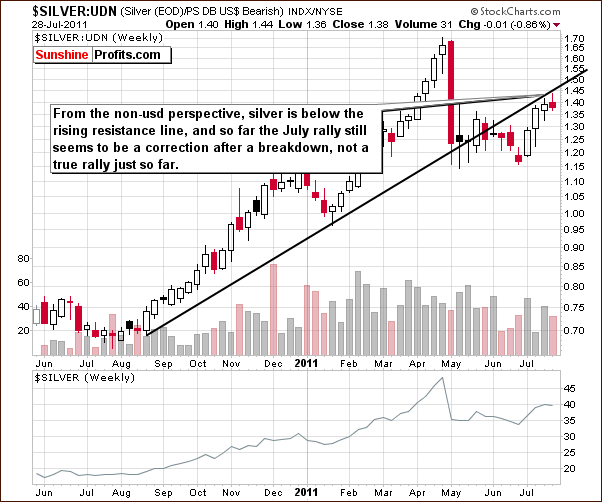
In silver’s long-term chart from a non-USD perspective, the white metal has moved below the rising support line. Even though there was a significant rally recently, silver’s price has still not moved back above the lower border of the trading channel and the situation is therefore not bullish at this time.
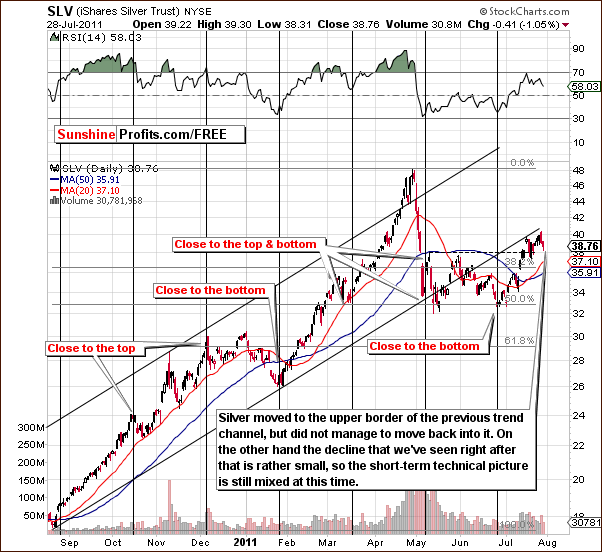
In the short-term SLV ETF chart this week, silver’s price moved to the previous support line, (which is now providing resistance) and then declined. The move down was not significant though, so the situation remains mixed and tense very much as we saw in the case of gold.
Summing up, additional price action is needed in order to confirm the bearish trend for silver as the recent price decline has been rather small. The long-term chart confirms this as a very real possibility at this time.
Gold and Silver Mining Stocks
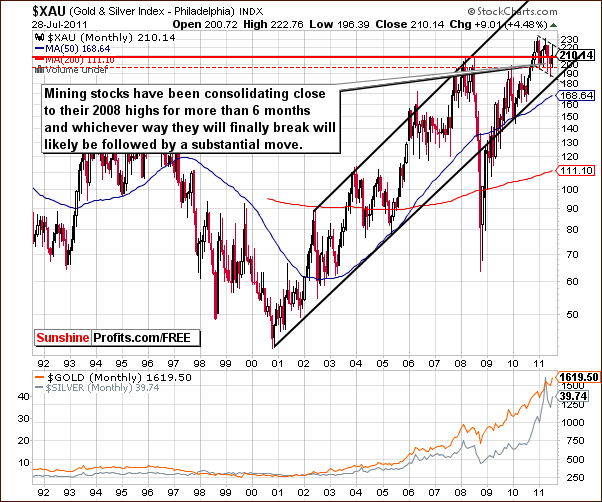
In this week’s very long-term XAU Index chart, once again we see the gold and silver mining stocks trading in a rather broad range (between dashed lines on the chart) around their 2008 highs. Whichever way the index moves from here, whether it be a breakout or a breakdown, will likely determine the next significant move for gold and silver mining stocks. There is a possibility that declines may be seen initially with an eventual rally to new highs seen towards the end of this year.
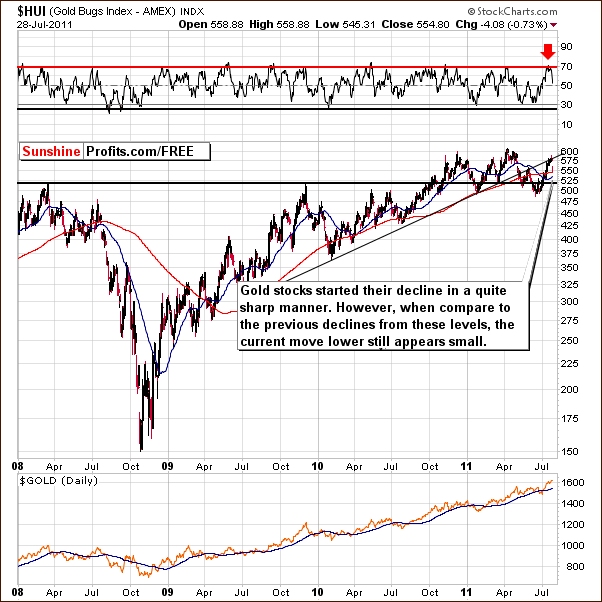
In this week’s long-term HUI Index chart, we have seen sharp declines after the index reached the resistance level and the RSI flashed a sell signal. The downturn was quite sharp but fairly small when compared to previous declines. It seems that further downward moves may still be seen from here.
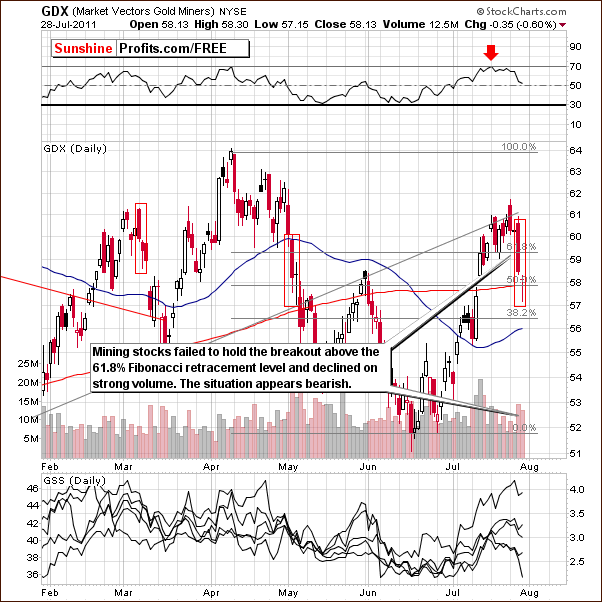
In this week’s short-term GDX ETF chart, we see that the miners have declined on significant volume and this chart is perhaps the most bearish of all this week. We will continue to watch the situation here especially in light of Thursday’s intra-day turnaround. The situation is still quite tense. In both early May and early March, significant periods of decline were temporarily interrupted by small contra-trend rallies. In both instances, the declines continued shortly thereafter.
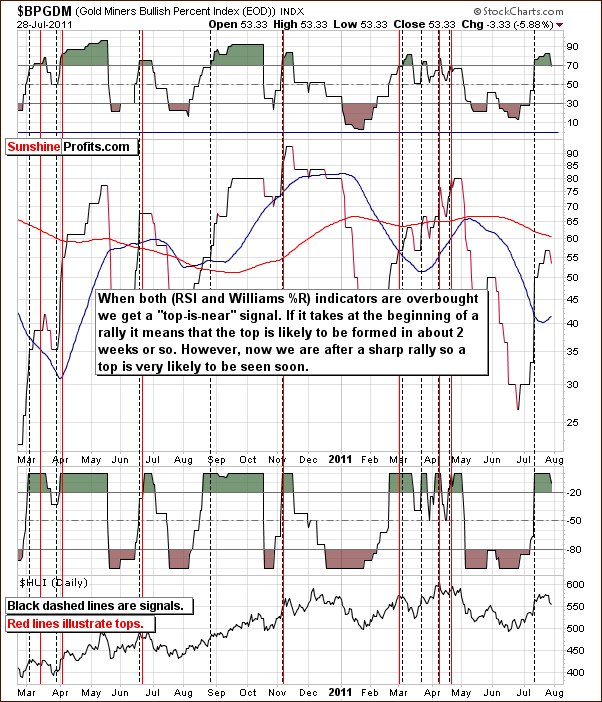
In the Gold Miner’s Bullish Percent Index, we no longer see the RSI in overbought status. This should not be taken to mean the decline is over based on the information visible in this chart alone. Such sentiment is best formulated by considering all charts and market trends simultaneously. Namely, we get a “buying opportunity” signal if both indicators: RSI and Williams’ %R become oversold (they move below 30 and -80 respectively).
Summing up, the situation in mining stocks appears quite bearish at this time. Recently, mining stocks appear to have led the precious metals sector higher and the rally was indeed significant. It seems now however, that the mining stocks could lead the sector on the whole to lower price levels.
Platinum
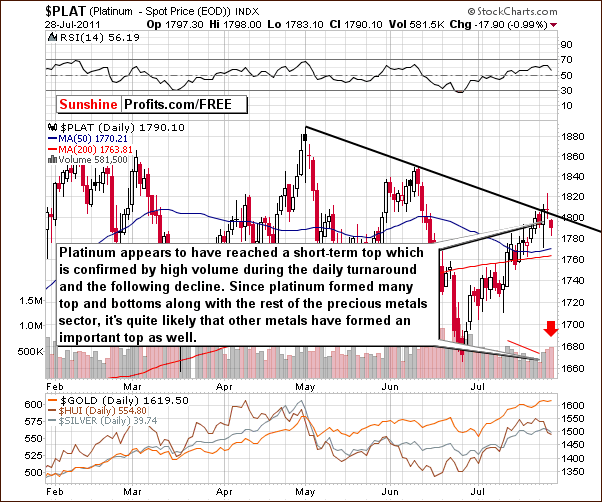
Our final chart this week is the short-term chart for platinum. It has been several months since we have included a platinum chart in our weekly update but this week it does provide us with some valuable information.
Platinum is now at a short-term resistance line which is clearly visible. A turnaround is seen in the chart and this is a very important development. This top took the form of an intraday reversal on significant volume and price continued to move lower on big volume on the following day. This is a bearish sign and has negative implications for precious metals which, in general, normally move in the same direction as platinum.
Letters from Subscribers
We would like to start this week's "letters" section with this quote:
The budget should be balanced, the Treasury should be refilled, public debt should be reduced, the arrogance of officialdom should be tempered and controlled, and the assistance to foreign lands should be curtailed lest Rome should become bankrupt. People must again learn to work, instead of living on public assistance.
Although it is attributed to Cicero (55BC), it is most likely a fake one. In a letter to The Chicago Tribune (20 April 1971), John H. Collins, Professor of History at Northern Illinois University, reported that the above-mentioned quote actually originated in A Pillar of Iron (1965), Taylor Caldwell's fictionalized account of the life of the senator.
For us, it makes no difference if it is a fake dated 1965, or a legitimate quote from Cicero dated 55BC. What it tells us is that back in 1965 (or even two thousand years earlier), they knew the truth about the proper way to run a country’s budget.
One question this week pertains to the topic of our essay—the debt ceiling. What happens if there is an impasse and the rating agencies will downgrade the US securities.
We think that it is a very possible scenario that regardless of the debt ceiling increase, the US will be eventually downgraded by one or more of the ratings agencies. Keep in mind that the world's largest pension, mutual, and sovereign wealth funds typically mandate investment only in AAA-rated securities. If there is a downgrade of US debt, those funds might face a situation where they must immediately sell off their primary reserve asset. You can imagine the effect of this on world markets. Gold would be the best safe haven for those funds as they look for a place to park their money.
A Subscriber sent us a link to a chart that he had been following for some time and said that it had proven to be rather accurate. He asked us to take a look at it. If the miners turn down in the next day or two (as implied by our latest message) it will be quite unusual, he said. The cycles on this chart don't look like a reversal is quite that imminent but with this debt crisis, anything is possible, he added.
Well, miners have in fact turned down, as we said in our message and right after we received this note. The above-mentioned indicator used to flash too many signals in the past months and it's difficult to assess its real usefulness, but it does seem to have potential for further development and we have added it to our things-to-investigate list. Thanks for sending it to us.
Another Subscriber sent us a letter about his short positioning in precious metals which is going sour given the recent upsurge. He essentially asked two questions: what's our strategy for the coming weeks and if silver's positive fundamentals are likely to cause the coming drop in the silver to be milder than after previous major tops.
Our strategy can be summarized in the following way - we're expecting to see a local bottom to be formed somewhere in mid-August (say, 10th-20th), however we treat this simply as a general guideline that could be quickly invalidated if precious metals market moves strongly higher or forms a reliable daily reversal candlestick on strong volume. At this point technical factors are in tune with the mid-August bottom theory, but we're constantly monitoring markets for anything that could signal a change in this tendency.
As far as silver's fundamentals are concerned - they are indeed positive, but - again - emotions drive prices in the short run, not cold logic and fundamental factors. Were fundamentals bad when silver truly plunged in 2008? No, they were quite favorable, and yet the massive decline took place. Right now we need to take into account the fact that at that time silver moved close to its 1980 high and it made a lot more people become interested in investing in silver - just because it was "hot". People might have been buying silver based on emotional reasons and to play on the short-term upswing - not because of the favorable fundamentals. The same group of investors/speculators could just as easily sell their holdings regardless of the fundamentals.
The same Subscriber said he would like to go out and garden without looking at the computer until mid-August, at which time he would close the short position. We say that with all the political turbulence going on in the U.S. and in the Eurozone, it is not a good idea to stop looking at the computer, and anyway, it’s too hot to spend all that time out in the sum gardening.
Summary
The situation in both the currency markets remains tense at this time. The Euro Index will likely confirm or invalidate a breakout very soon and the same holds true for the USD Index with respect to its breakdown. The days ahead are critical in determining the short-term direction for each of these currency markets. Stocks on the other hand have a bearish outlook at this time with their recent failure to move above resistance lines and with significant volume levels accompanying daily price declines. The financial no longer suggest a rally in the following weeks.
The implications for the precious metals are not crystal clear at this time. There is a slight bearish bias when evaluating the other markets and their likely impact on gold, silver and gold and silver mining stocks. This sentiment is also confirmed by the short-term platinum chart this week.
Gold moved higher this week but volume levels did not confirm any breakout and this prevents our outlook from being bullish for gold in the short term. The situation for silver is also bearish with the possibility of a much more bearish outlook on the table should prices decline on Friday. Gold and silver mining stocks seem to have begun sharp declines on their own and, although it’s not a sure bet, it seems that the short-term downtrend we have been expecting may indeed have begun. Normal seasonal trends also support the likelihood that gold and silver mining stocks will continue to decline and a mid-August final bottom appears to be a good possibility based on historical trends. We will continue to monitor all markets and report any significant developments or changes in our views to you.
Our next Premium Update is scheduled for Friday, August 5, 2011.
This completes this week's Premium Update.
Thank you for using the Premium Service. Have a great weekend and profitable week!
Sincerely,
Przemyslaw Radomski

