Today's Premium Update features a quick menu that should be helpful if you are interested in only some parts of the update or have little time to read the whole analysis. Please let us know what you think - if you like it, we will further develop this idea. If you don't like it, we will remove it. After all - we work for you and it's your website.
- Euro & USD Indices
- General Stock Market
- Correlation Matrix
- Gold
- Silver
- Mining Stocks
- SP Indicators
- Letters from Subscribers
- VIX
- US can't default
- Stop-loss orders
- Probability for a move above $1,800 in gold
- Summary
So, was Wednesday's $25 plunge in gold the consequence of a "fat finger?" technical selling? The expiration of options and futures contracts? Deflationary concerns? A stronger U.S. dollar?
One thing we know for sure is that gold can be as volatile as it is precious.
Apparently there were no fat-finger trades or technical errors according to the CME Group, which operates the U.S. COMEX gold futures market. There was market chatter of a large seller that apparently came into the market early in the morning. Others say it was a market-driven selloff with concerns over deflation as the main culprit. Fears that fiscal-cliff discussions will not succeed are sending a wave of deflation worries.
We sent out a Market Alert, as we have been doing every day this week, saying that the True Seasonal patterns are favorable for precious metals, the major bottom seems to have been reached when gold moved to its 300-day moving average and the fundamental situation favors higher precious metals prices. The short-term breakdown is not enough to invalidate the above. We said that we still believe that keeping long positions in gold, silver and mining stocks is a good idea. Please read the entire technical portion to get more specifics on our ideas on the market.
Regarding the fiscal-cliff discussion, here's what we previously wrote about this topic:
Let's see if we can guess what's going to happen: until the very last minute everyone will be fighting over the deal and then a consensus will be reached that will mean more money being created. Our initial thought is that precious metals will rally with the uncertainty regarding the fiscal cliff, and then they will correct (say, 38.2% of the rally will be seen by that time) on the news that more money will indeed be provided for free (i.e. taken by inflationary force from current USD holders). In other words, it could very well be a buy the rumor, sell the fact type of reaction - just like what we saw after the open-ended QE was announced.
Precious metals moved higher in the past few weeks despite the fiscal-cliff scare. Miners might have not rallied that much as metals because of this discussion, however, the implication is that the gains that miners didn’t make because of the fiscal-cliff fear will be seen when the agreement is made. We continue to expect the situation to be resolved by printing more money. No politician wants to be blamed for stocks’ and economy’s collapse (even a necessary one).
China is set to overtake India as the world's top gold consumer this year and it is already the world's largest gold producer. It is also seeking to challenge the status of the U.S. dollar as the world’s reserve currency and has set up direct currency deals with Japan, Russia, Brazil, and Indonesia. On the other hand, China has an interest in not toppling the value of the dollar since it owns a mountain load of US dollar-denominated debt.
The U.S. Treasury Department did not label China a currency manipulator in a report to Congress this week though the yuan“remains significantly undervalued” and needs to rise further. China “has substantially reduced the level of official intervention in exchange markets since the third quarter of 2011,” the Treasury said. The yuan has gained 9.3 percent in nominal terms and 12.6 percent in real terms against the dollar since June 2010.
The last time the U.S. designated another nation as a currency manipulator was in 1994, and you guessed it, it was China. Critics of China’s exchange rate policies, including former Republican presidential candidate Mitt Romney, say the nation deliberately suppresses the value of its currency, making its goods cheaper and costing jobs in the U.S.
China has only 2 percent of its reserves in gold, compared with the United States at 75 percent or Germany at 73.9%. In other words, China has a lot of catching up to do if it wants to play the currency game with the big boys, and so, it must buy more gold. To bring it up its reserves to the percentage of U.S. or German gold reserves would be just about impossible without sending tectonic shock waves throughout the gold market. And so, China is most probably building up its reserves quietly, patiently, over time, buying up all its local production. It does not export any of its gold and its gold imports have been rising year on year, estimated by the World Gold Council to likely reach 860 tons this year making China the world's largest gold importer.
Also, China is becoming increasingly influential in the international precious metals market. The number of Chinese refiners on the LBMA Good Delivery List, the register of approved gold producers, grew to 22, ranking just behind Japan with 23 refiners. The Shanghai Gold Exchange now boasts 33 financial members, and 3 million individual clients and more than 30 commercial banks are active in gold, offering both physical and paper gold.
U.S. Legislator Prefers to be Paid in Gold
A Republican state legislator in Montana is asking to be paid in gold and silver coins to guard against a collapse of the dollar. State Rep. Jerry O'Neil (R-Columbia Falls) wrote to the state's Office of Legislative Services on Friday making the request, noting that concerns about the national debt have prompted him to ask for payment in gold and silver coins "that are unadulterated with base metals." With a monthly salary of $1,800, that is roughly the value of one gold coin.
Speaking of items made of gold, those of you contemplating your Christmas shopping should take into consideration that all items listed in "12 Days of Christmas" now top $107,300. We’re talking seven swans, six geese and five golden rings etc. If you get all 364 items repeated throughout "The Twelve Days of Christmas" carol, you'll pay 6.1 percent more this year, according to the so-called Christmas Price Index that PNC Wealth Management updates annually.
To see how much five golden rings will cost you by Christmas time, let's turn to week's technical part with the analysis of the Euro Index. We will start with the long-term chart (charts courtesy by http://stockcharts.com.)
Euro & USD Indices
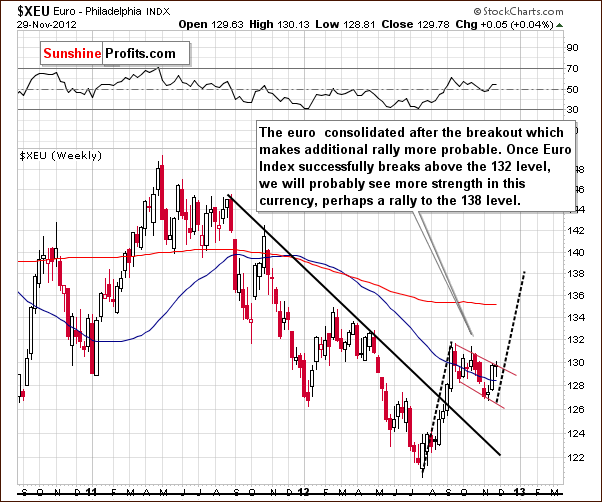
We begin this week with a look at the long-term Euro Index chart. We do this because the overall situation in the currency markets is much clearer from this perspective. There is a flag pattern seen here following a sharp rally which is also a post-breakout consolidation.
As soon as the euro rallies a bit more, an even bigger rally will likely be seen. While a move to 131 would be significant, we would prefer to see the index surpass the 132 level (September high) before declaring that a significant additional rally is very likely. The flag pattern, a form of consolidation, implies that higher index values are more likely than not. Perhaps the index could rally to as high as 138 in the coming weeks.
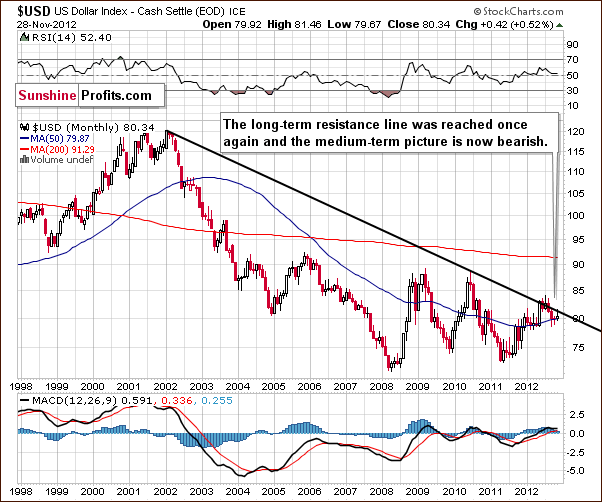
Turning now to the USD Index charts, we first look at the long-term perspective. As expected, we see the opposite of the situation with the Euro Index. Lower values are a clear possibility here, and a recent attempt to move above the long-term rising resistance line failed. This was very much in line with our comments in the last Premium Update on November 16, 2012:
The trend will remain down even if the USD Index moves to the last Fibonacci retracement level (around 82). With a cyclical turning point fast approaching, the Index is more likely than not to move lower from here from a technical perspective.
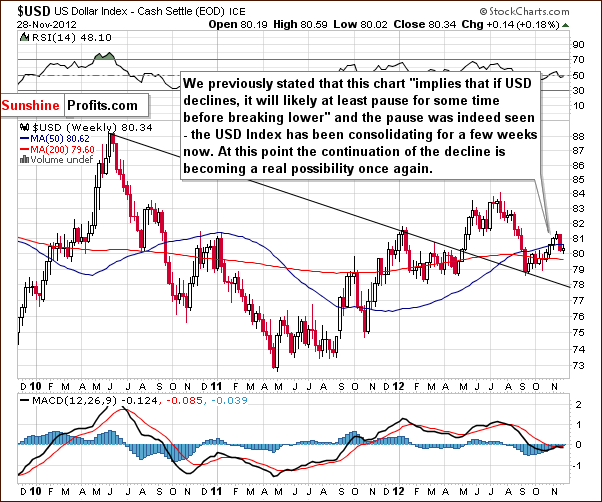
Turning now to the medium-term USD Index chart, a consolidation has been ongoing for over a month, and the index now appears ready to move lower. The decline and consolidation here are a reflection of the upswing and consolidation seen recently in the Euro Index.
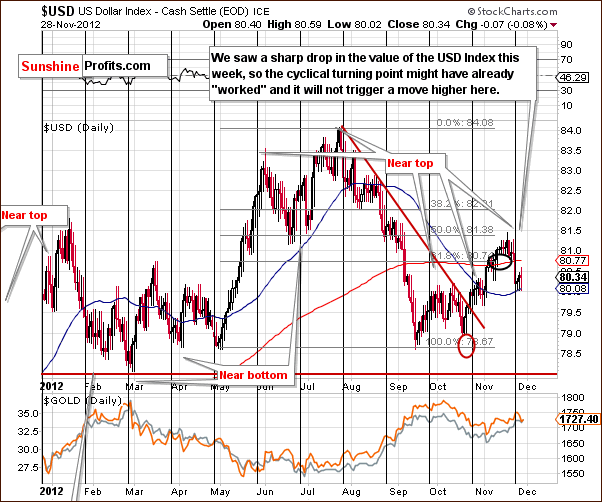
The outlook based upon this week’s short-term USD Index chart shows a picture which is not nearly as clear. The double bottom formation in September and October has distorted the long-term picture, and any short-term analysis is made difficult by the recent sharp decline around the cyclical turning point. We could still see a move to the upside related to this same cyclical turning point.
Summing up, the short-term situation is somewhat unclear but the long-term, medium-term and Euro Index charts all suggest that lower values are more probable than not for the USD Index in the medium term. The implications here are likewise medium-term bullish for the precious metals.
General Stock Market
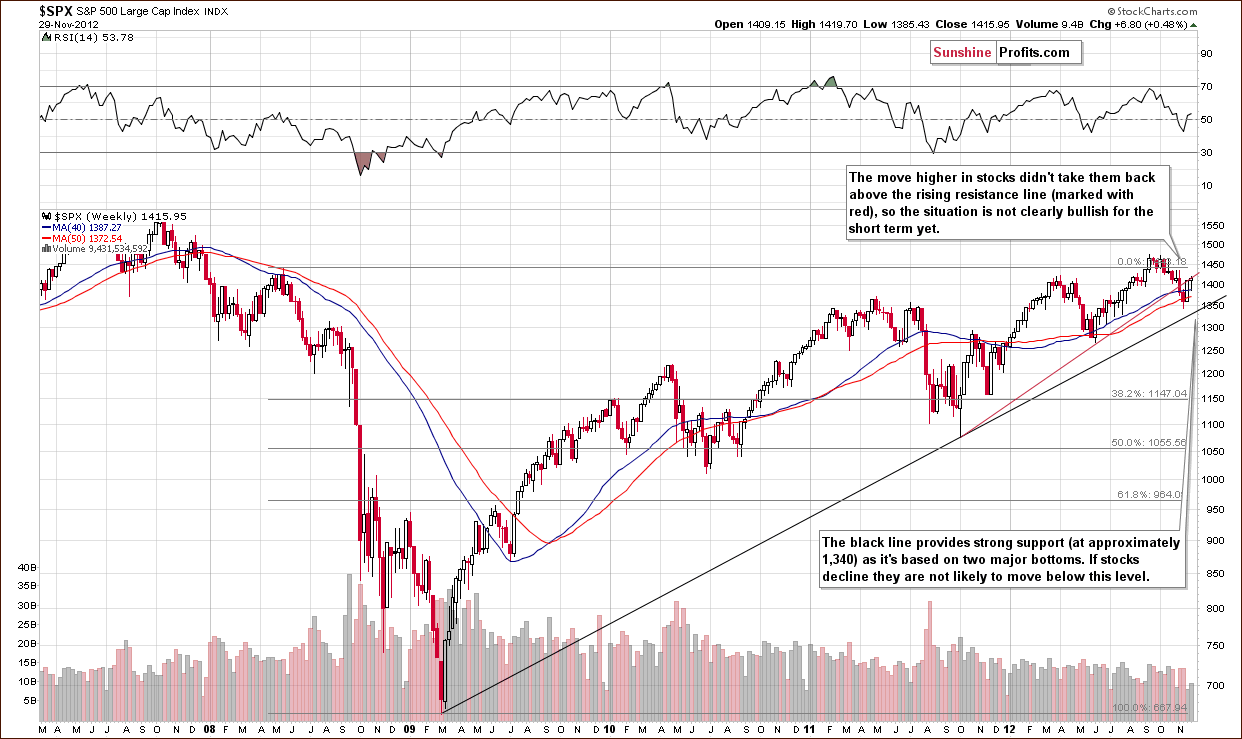
In the long-term S&P 500 Index chart (please note that you can click this or any other chart to enlarge it), stocks rallied significantly last week and moved a bit higher this week as well in spite of Wednesday’s heavy declines. Stock prices are now at the previously broken support line which is now a resistance line. There has not been a move above this line so the situation cannot be described as clearly bullish but rather simply mixed. If stocks do decline, it seems unlikely that they will move below their November low. Right now a strong long-term support line resides at this price level. In our view, the medium-term outlook remains favorable based on the long-term technical perspective. From the fundamental perspective, we expect to see a bigger rally once it is clear that the fiscal cliff will be avoided thanks to monetary easing.
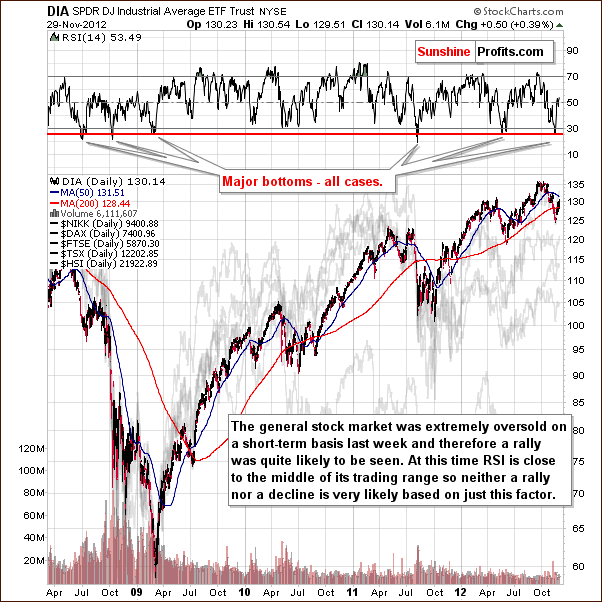
In the DIA ETF (a proxy for the Dow Jones Industrial Average), it seems that almost anything is possible. The situation was heavily oversold and a local bottom formed as we implied in our last Premium Update on November 16, 2012.
The RSI is well below 30, and this has only been seen a few times in recent years. We saw this once in 2011 and twice earlier this year and these generally coincided with major bottoms.
Right now, we could see addition weakness/ double bottom similar to what was seen on a bigger scale in mid-2011. Our best guess is that after some consolidation, the rally will continue as was seen in mid-2012.
Summing up, the situation in the general stock market is bullish for the medium term and mixed for the short term with a slightly bullish bias.
Correlation Matrix
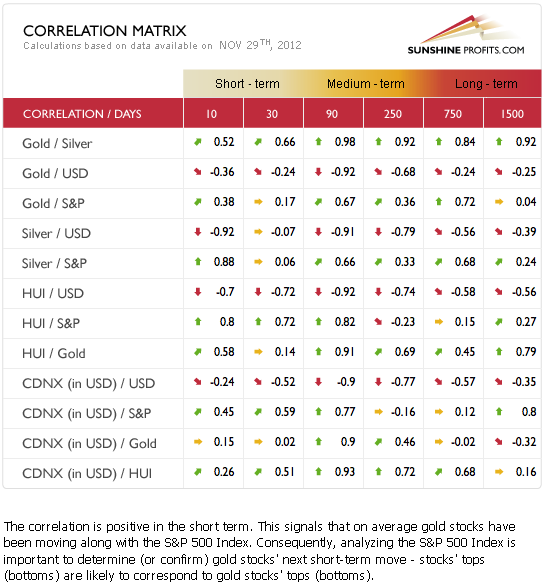
The Correlation Matrix is a tool which we have developed to analyze the impact of the currency markets and the general stock market upon the precious metals sector. In the last 30 trading days, the correlations have been quite weak. The only part of the precious metals sector that has really reacted to the correction of stock prices are the mining stocks. This was not seen with the precious metals. The fact that the metals did not follow stocks and decline significantly is bullish for the sector on the whole.
The decline in mining stocks concerns us a bit but could simply be the way in which the consolidation period comes to a close. Those who do not believe in gold stocks could be shaken out of the market at this time. This could explain what happened Wednesday when a heavy decline was seen in gold prices. Buyers overwhelmed sellers in the mining stock sector, however, and the miners closed higher.
The overall situation based on this week’s correlation coefficients and the currency and stock market analysis points to a situation slightly more bullish than not for the precious metals. As the situation in the USD Index gets more bearish and stocks’ outlook more bullish, the precious metals’ outlook will likewise become more bullish. The most interesting details of this development will be discussed in the sections analyzing the precious metals and the mining stocks in this week’s Premium Update. Let’s start with gold.
Gold
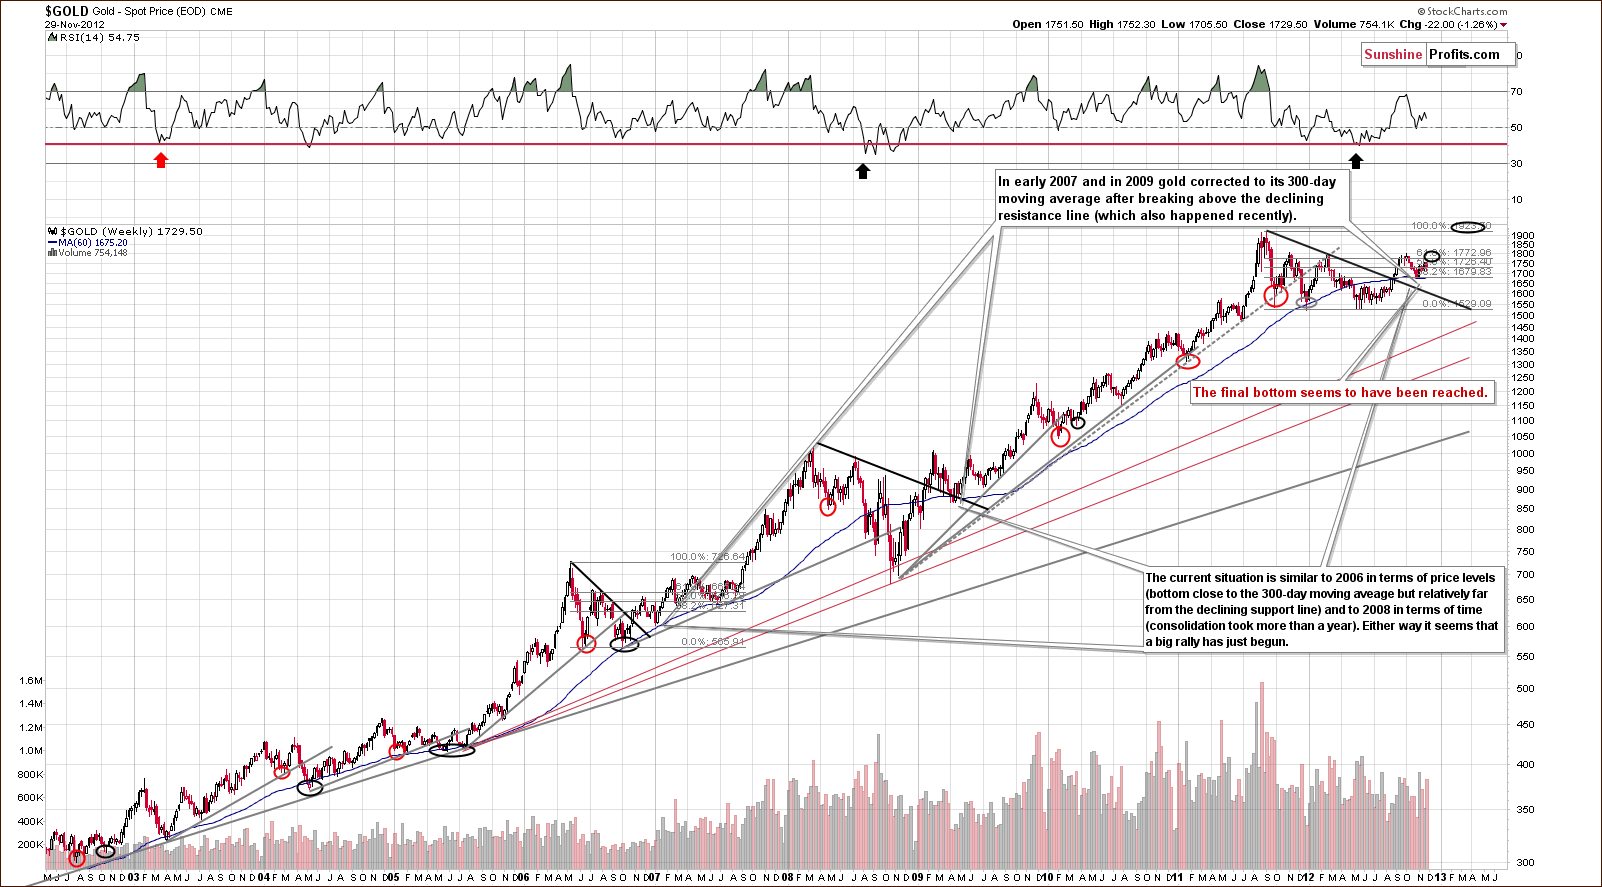
In gold’s very long-term chart (click to enlarge), there has been virtually no change in the past two weeks. This week’s correction is barely visible, but clearly local bottom forming at the 300-day moving average is a major development. This should be kept in mind when gold prices move up or down in the days and weeks ahead.
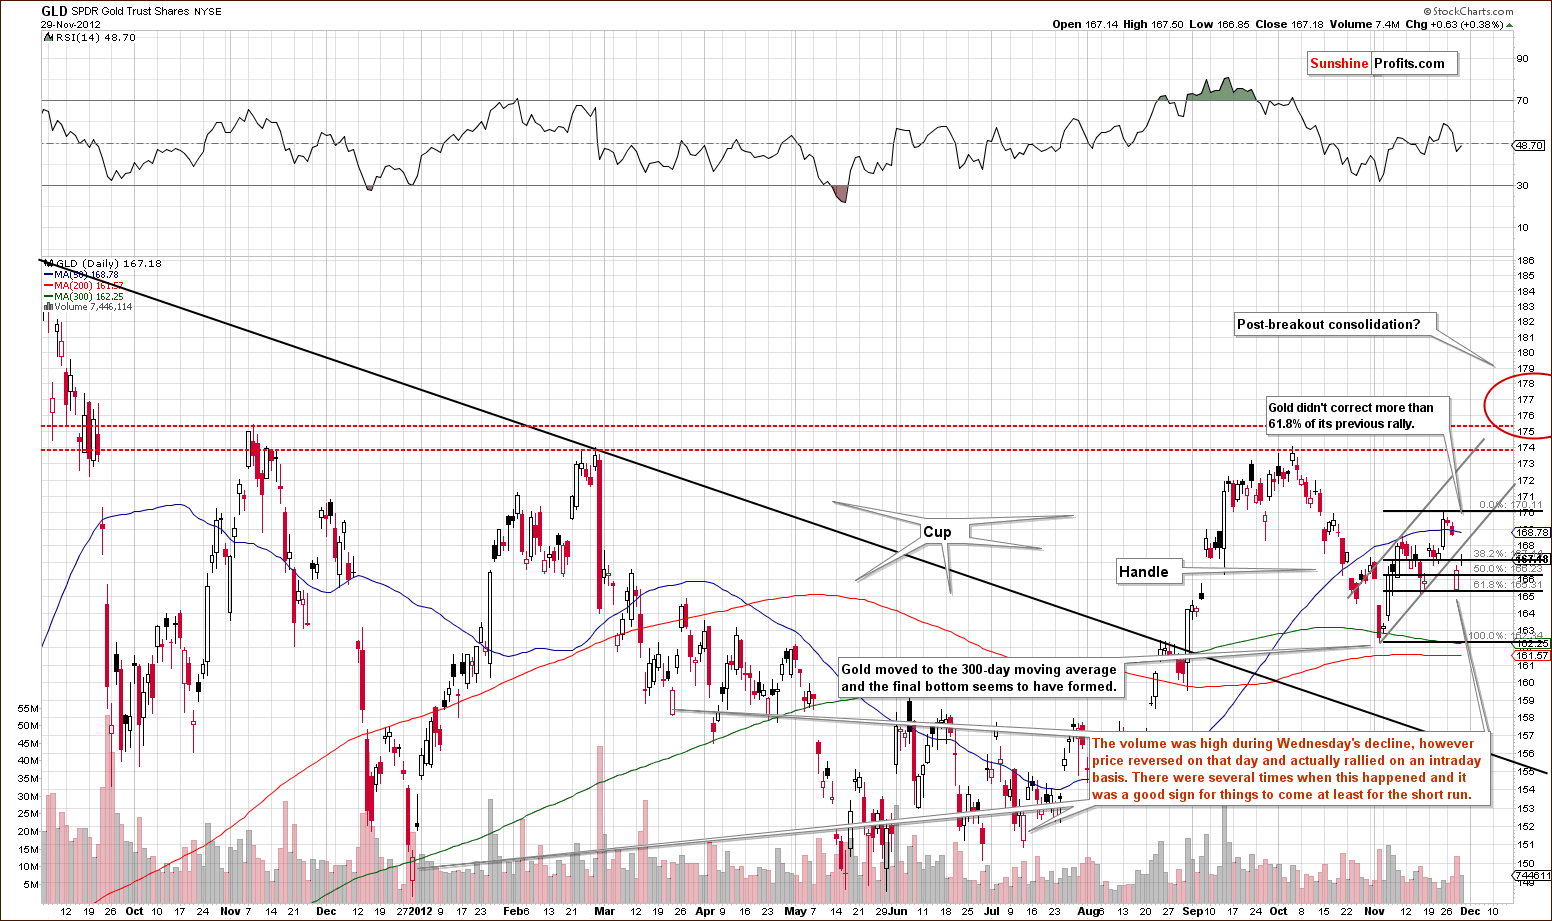
A look at this week’s medium-term GLD ETF chart reveals two interesting details. First, the size of the correction precisely to the 61.8% Fibonacci retracement level means that the uptrend is upheld and the decline is a correction not a reversal. Just in case we are wrong about this, we believe that keeping stop-loss orders is a good idea here. The worst-case (but still somewhat probable) scenario is a decline in an A-B-C correction pattern, which would mean a decline from here to $1,630. If this indeed materialized, we would expect that correction to be completed by the end of the year. A stop-loss order right below the $1,700 protects you against riding it all the way down.
Lower prices do not seem likely, however, as gold has already verified its move above the long-term declining resistance line by a month long correction which bottomed at the 300-day moving average. Higher prices now appear more likely. An intra-day reversal, where gold opened lower but closed higher was also seen recently. In two of three similar previous cases (marked in our chart), a major rally followed such an intra-day price move. In the remaining case, a local rally was seen.
The situation remains bullish for gold based on the above chart. The target level for the rally is slightly above the level of the October high. Prices will probably move above it and then consolidate for a week or two.
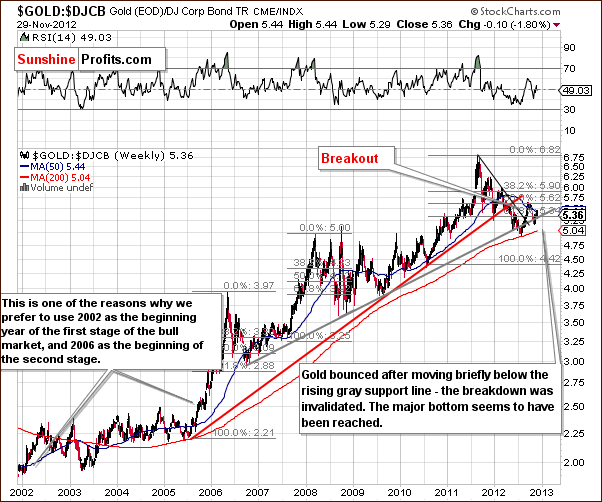
In the gold to bonds ratio chart, there has been very little change seen over the past two weeks. What we stated in our last Premium Update November 16, 2012is still up-to-date:
The situation continues to look bullish here. It seems that the bottom has been reached and higher values for the ratio and gold appear to be in the cards.
The ratio invalidated a small move below the rising support line, so the situation remains bullish today.
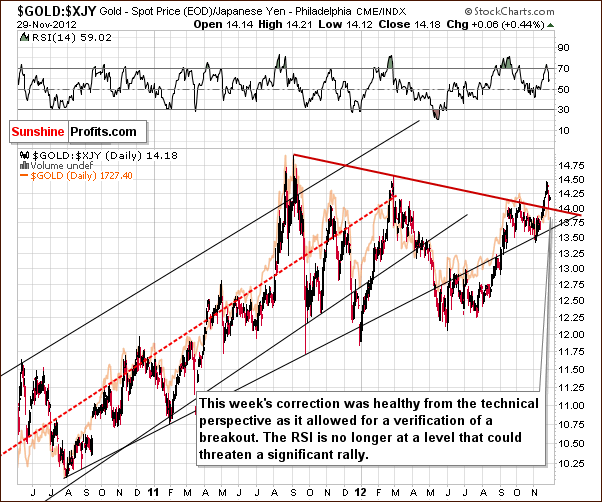
In this week’s chart of gold from the Japanese yen perspective, an interesting note is that when gold declined recently, it allowed the price in yen to verify a move above its declining resistance line. This breakout was verified, and the RSI is no long heavily overbought. The situation is clearly bullish.
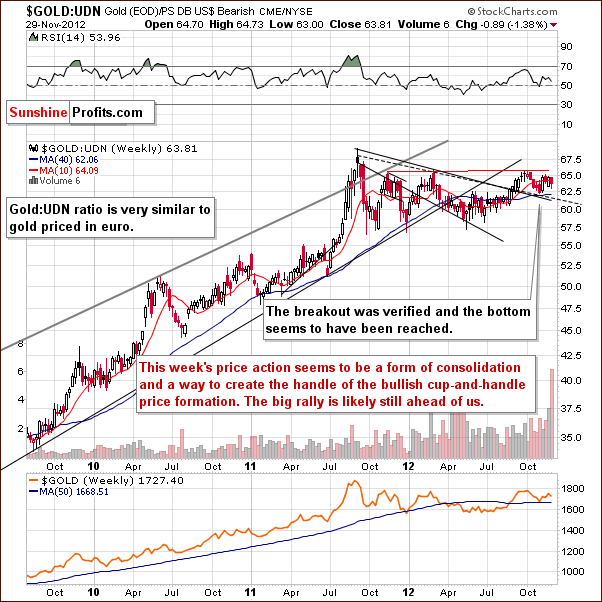
In this week’s chart of gold from the non-USD perspective which is similar to gold priced in euro, the index moved very little in the past few weeks. It has been consolidating and forming the handle of a bullish cup-and-handle trading pattern. The situation continues to be bullish here as well.
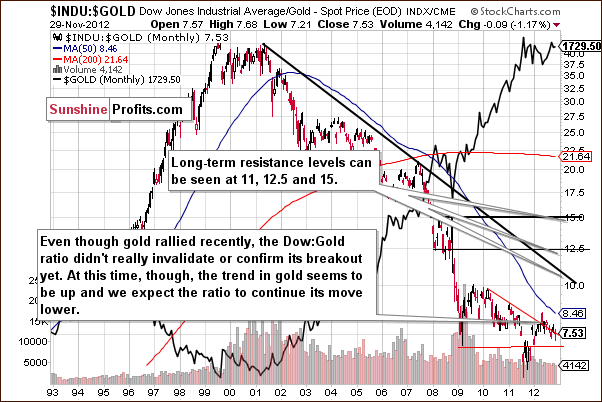
In this week’s Dow to gold ratio chart, no change has been seen, but we continue to monitor this ratio. A significant move in either direction could spark a bigger move that way. If gold continues to outperform stocks, a longer period of outperforming is likely. If, however, gold underperforms stocks, a bigger period of underperformance will likely be seen. We expect gold to outperform stocks, and it seems that a big move will soon be seen with this ratio declining sharply.
Summing up, the situation remains bullish for gold from the long-term, medium-term and short-term perspectives. The situation is not crystal clear, but bullish enough to justify long speculative and investment positions.
Silver
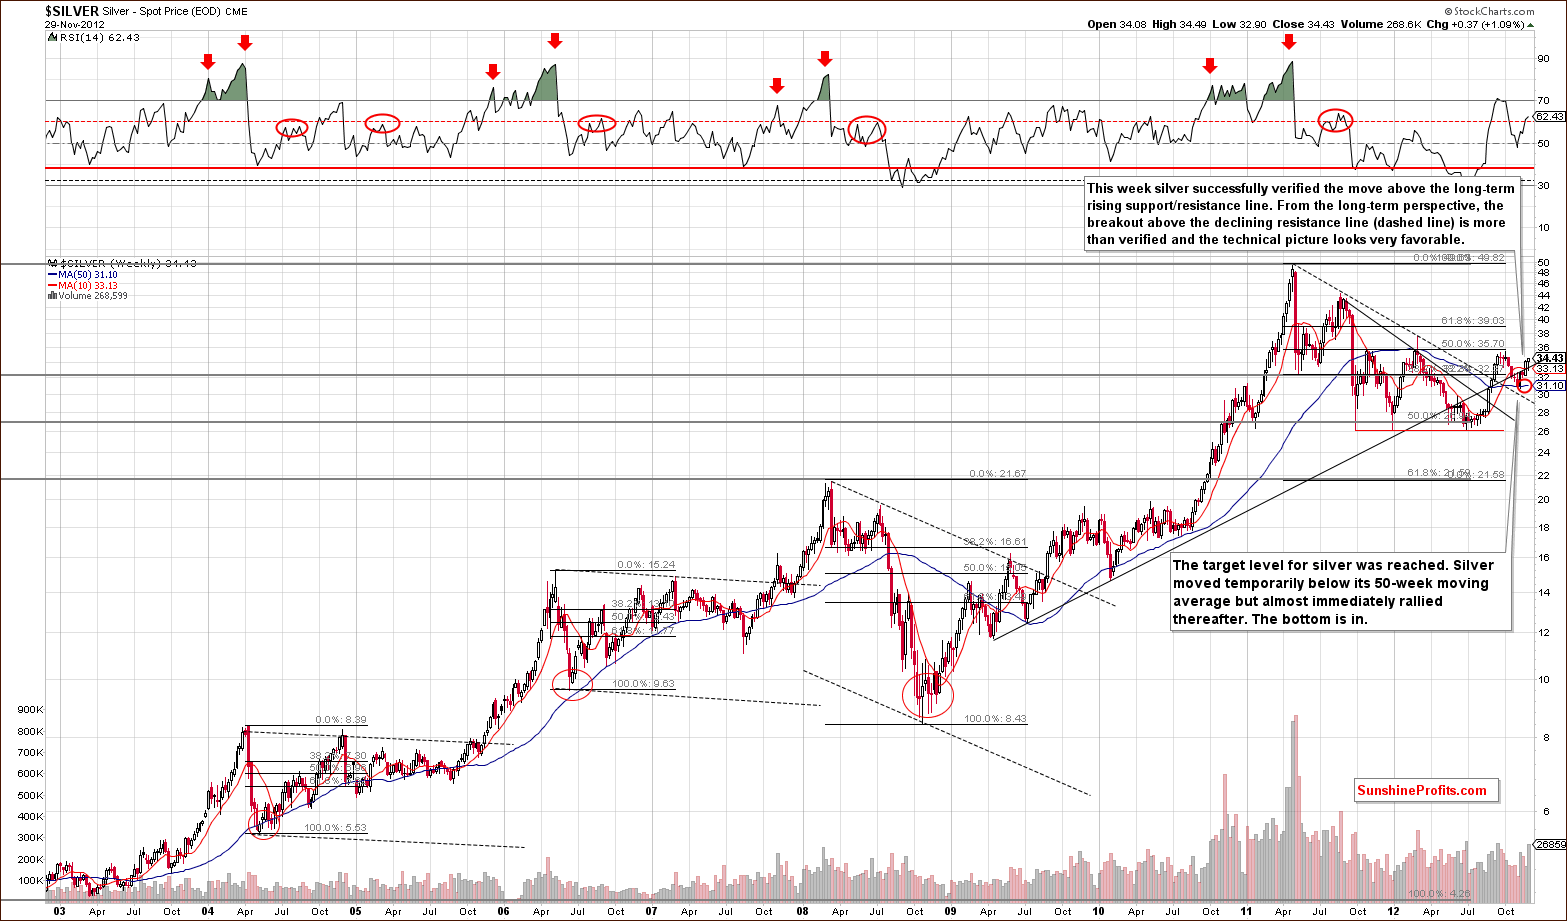
We begin our silver section with a look at silver’s long-term chart. The situation looks even better here than it does for gold, as silver has managed to move above its long-term rising resistance line. The breakout above the declining dashed resistance line has been clearly verified as well, and RSI levels are not overbought. The situation looks clearly bullish from this long-term point of view.
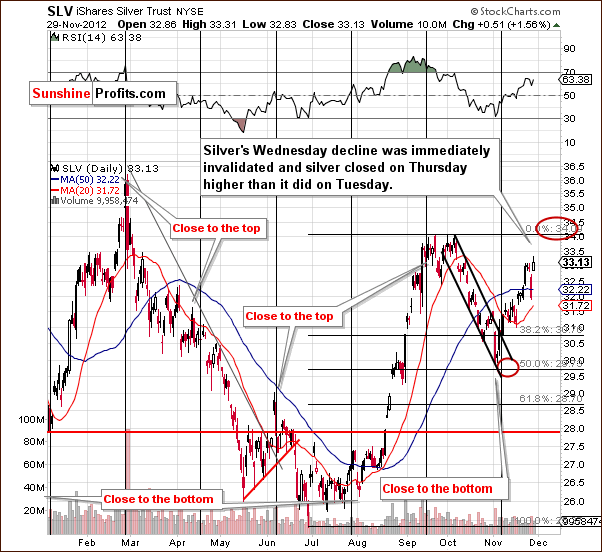
In the short-term SLV ETF chart this week, the bottom appears to have been reached right at the cyclical turning point. We discussed this in our Premium Update of November 9, 2012:
In the short-term SLV ETF chart, our downside target level has been reached somewhat early, and the bottom has formed close to the cyclical turning point. The situation is now bullish once again. It seems that a rally will be seen here – initially, to the $34 level or so.
Silver immediately rallied and showed strength. The likelihood of a move above the September-October highs in the coming week or two appears quite good (75% or so). We then expect to see a consolidation followed by yet higher prices.
Summing up, the situation for the white metal is even more bullish than is the outlook for gold based on the exceptional strength silver has shown this week.
Mining Stocks
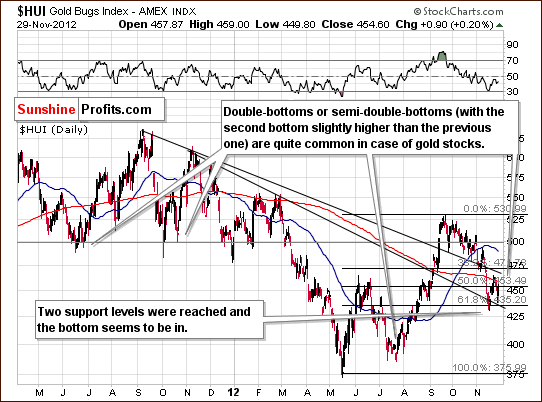
In this week’s medium-term HUI Index chart we see that even though gold stocks declined on a short-term basis, what happened this week was not all that uncommon from the long-term perspective. The miners are known for bottoms with double-bottom formations or “semi-double-bottoms”, where the second bottom is a bit higher than the first. The general implications are bullish because a strong rally usually follows a second bottom. With the RSI below 50, the situation is not overbought. The support line held and the HUI Index is now above $450.
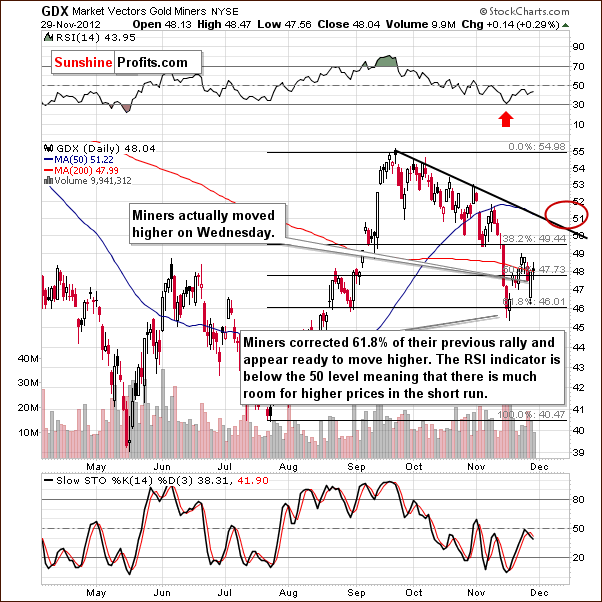
In the GDX ETF short-term chart, we saw a decline which corrected 61.8% of the previous rally. This makes it somewhat similar to the decline seen in gold. On Wednesday, gold corrected and the mining stocks actually closed higher. The situation remains bullish even though the miners are tied to the general stock market.
Given the situation in stocks and the significant pessimism and fiscal cliff fears, it seems that the bottom is in. As the saying goes, “it’s a good time to buy when there’s blood on the street”. With the RSI below the 50 level, there is clearly room for mining stock prices to move higher.
At this time we expect miners to consolidate a bit after moving above the declining resistance line and then continue their rally.
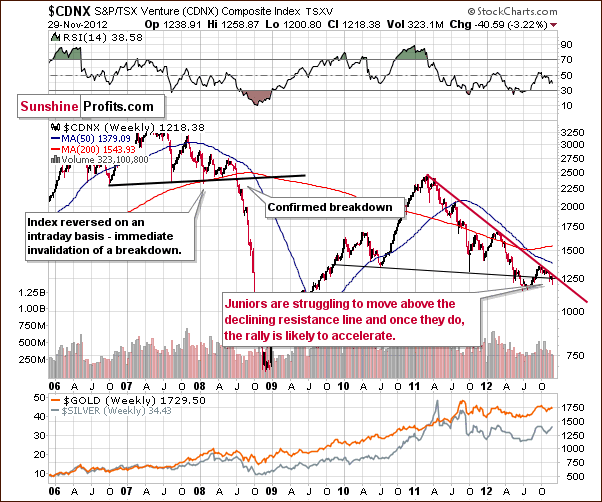
In the Toronto Stock Exchange Venture Index (which is a proxy for the junior miners as so many of them are included in it), the index is at a critical point with a breakout or a breakdown imminent. It seems probable that a breakout will be seen given the positive outlook for gold and silver. Moreover, the index has been correcting for a year and a half which is more than enough – the rally can “easily” emerge here as there is definitely no “excessive optimism” about the junior sector. The outlook is bullish for the juniors although the breakout has not yet been seen.
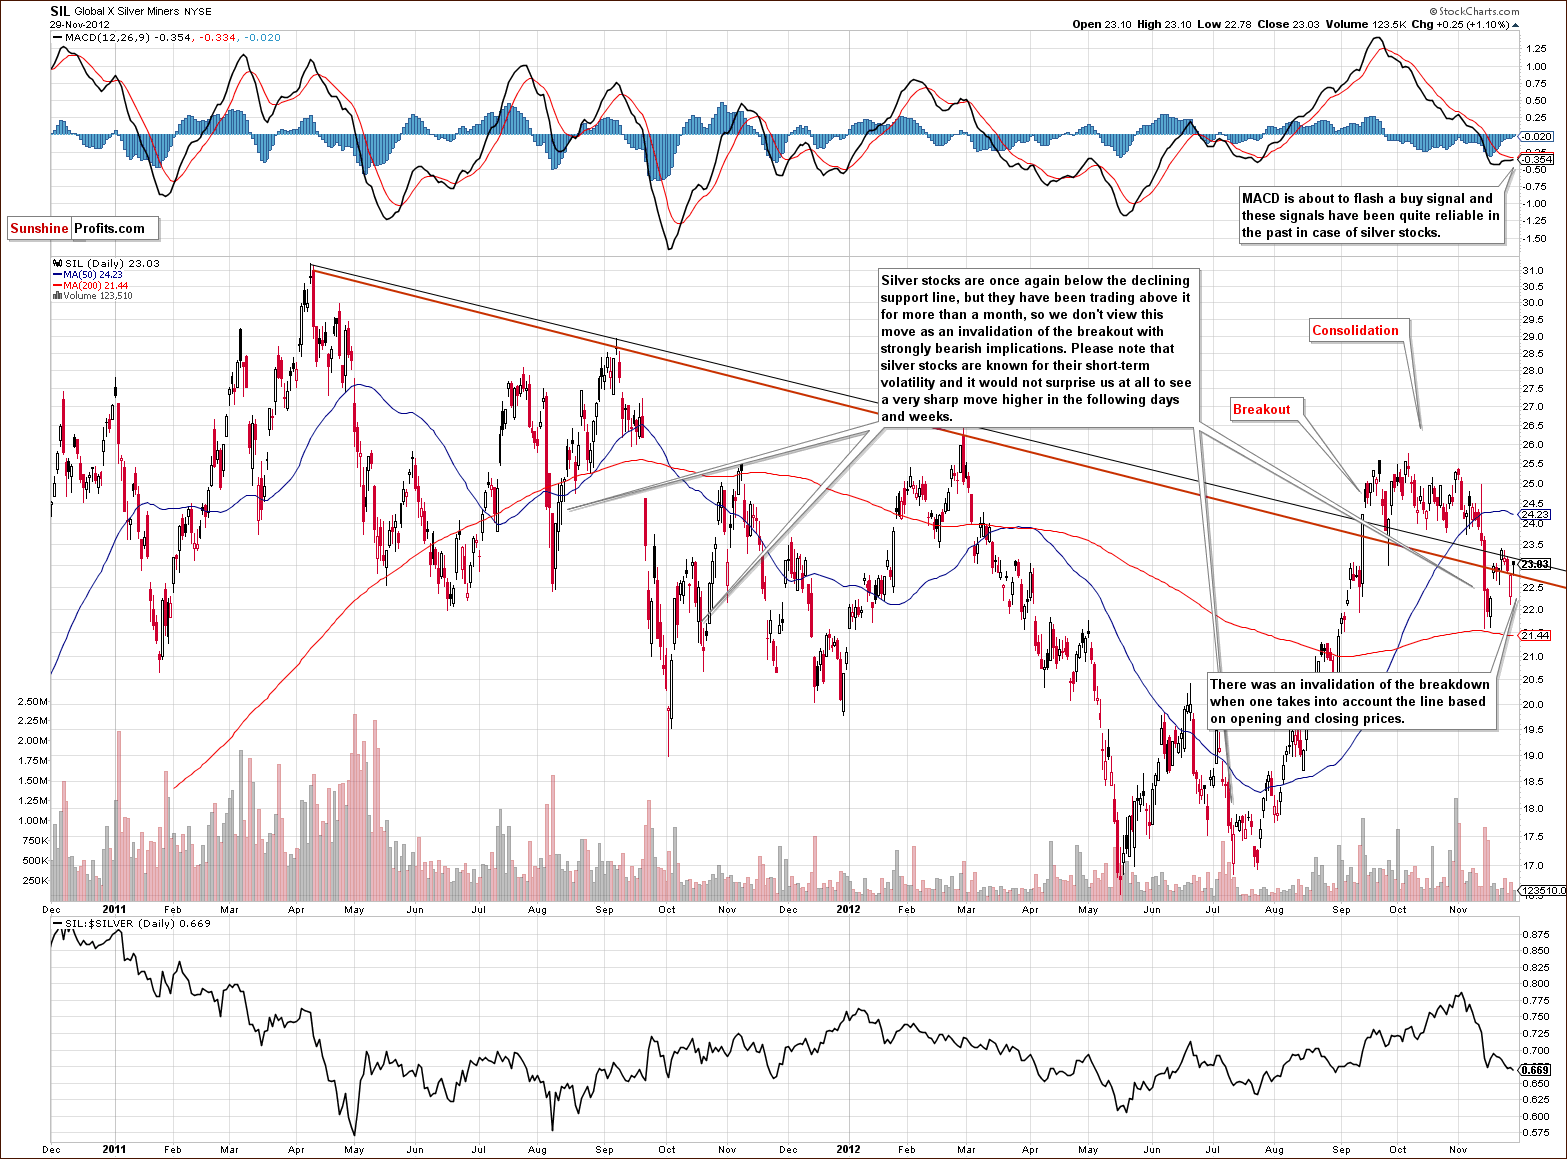
This week we again include the long-term Global X Silver Miners (proxy for silver stocks) chart. A breakdown below a support line created by open and closing prices was quickly invalidated. This supports a bullish outlook for silver stocks and will likely be emphasized soon by the MACD Indicator which will likely provide a buy signal this week. The last time such a situation was seen was in early-July, and a major rally followed.
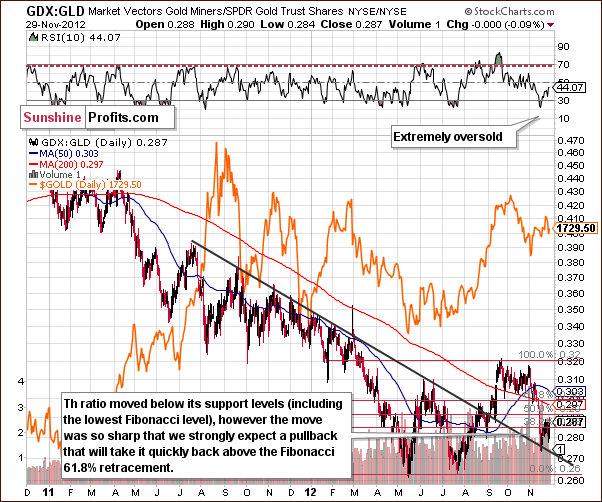
In the miners to gold ratio chart, the ratio which seemed to have bottomed in the previous decline is now moving back up and is above the 61.8% Fibonacci retracement level if taking the July to September rally into account. The extremely oversold situation did not stay oversold for long. The miners rallied and additional rally is expected in the months ahead, especially in view of what is seen on the following chart.
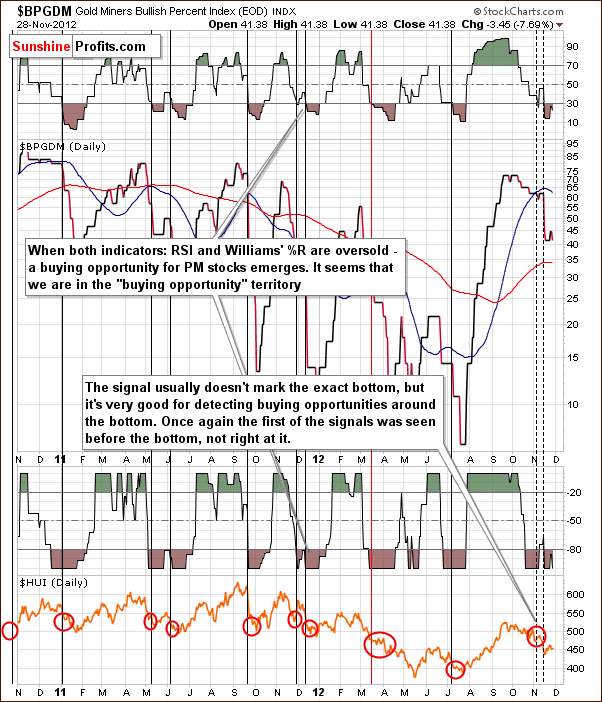
In the Gold Miners Bullish Percent Index chart, we have a situation where both the RSI and Williams’ % R indicators are oversold. This indicates that the bottom is close or at hand and the signal has flashed twice recently. The first was ahead of a rally and the second was right at the bottom. The implications are clearly bullish for the medium term.
Summing up, the situation in mining stocks remains bullish.
SP Indicators
This week we saw 2 buy signals from our indicators from the SP Short Term Gold Stock Bottom Indicator and the SP Gold Stock Extreme Indicator #2.
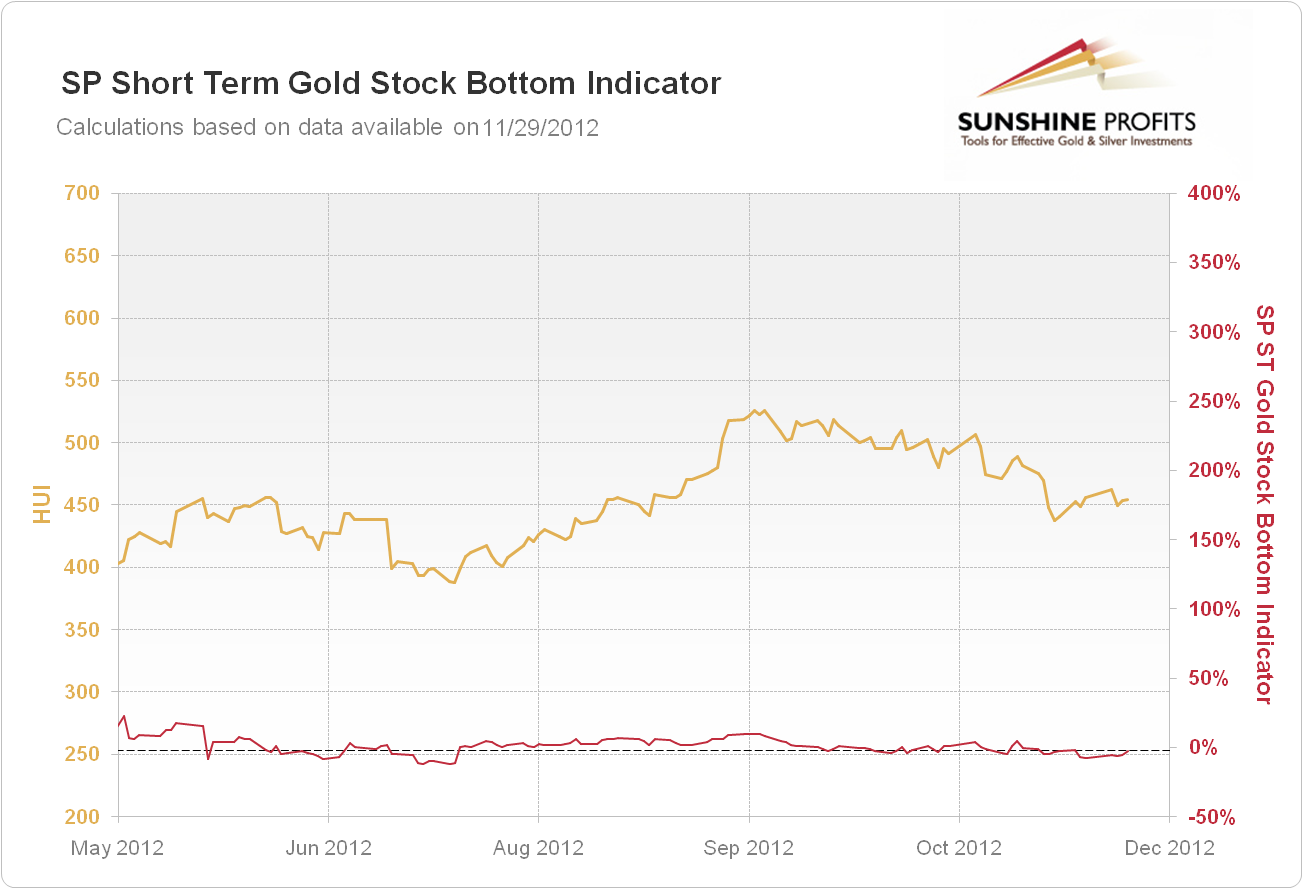
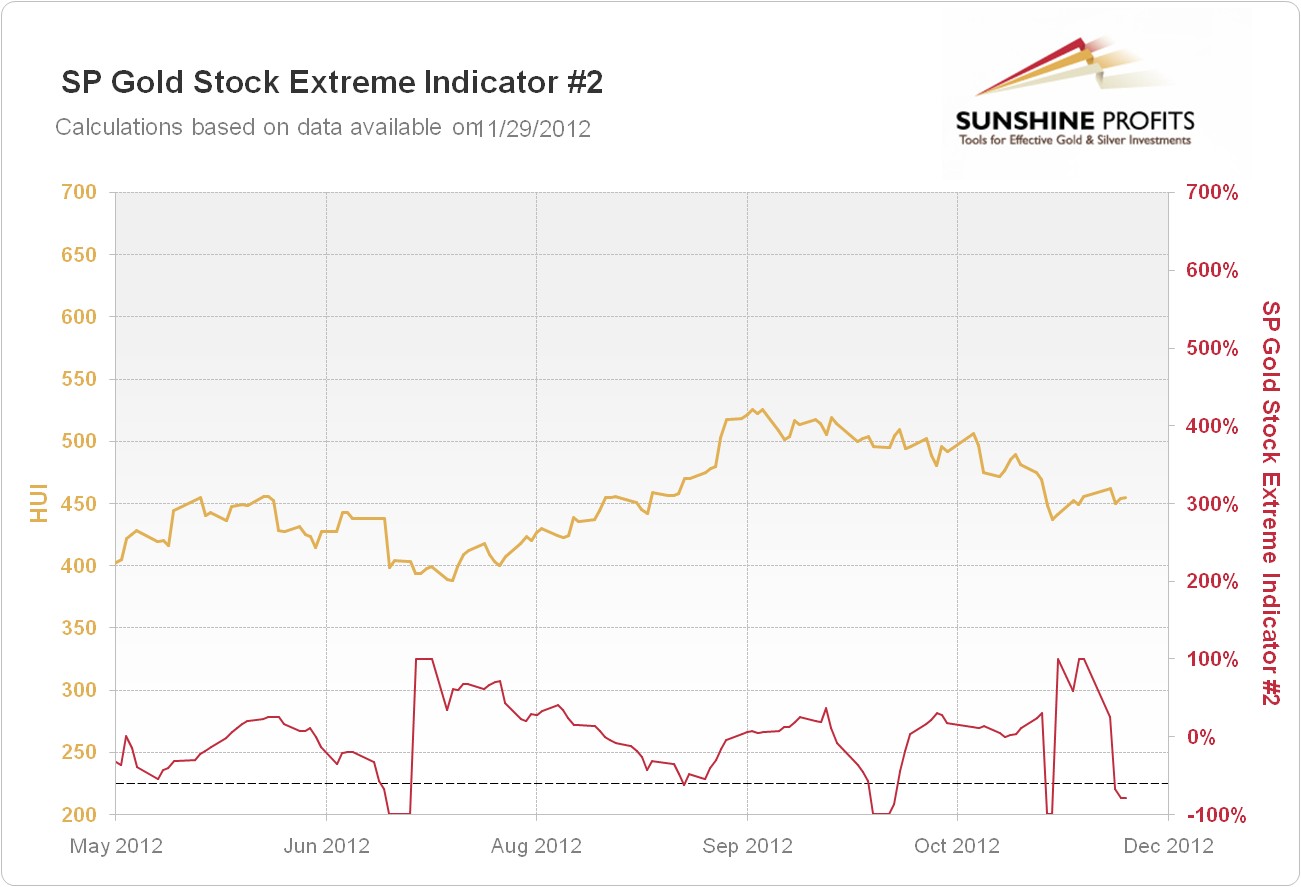
The second one is stronger and suggests opening long positions for gold, silver and mining stocks with a 2-week trade in mind. We have previously opened long positions so the only implication here is that we should keep these positions open for at least another two weeks.
This is something that confirms points made when analyzing charts subjectively, however, please keep in mind that we also use these signals as their separate source, which allows for diversification that decreases the amount of risk associated with trading. If you haven’t done so already, we suggest examining our report on gold & silver portfolio structuring and asking us questions if something is unclear. We have also replied to a question about various types of signals (why can’t we just give you one type of signals) in the October 12, 2012 Premium Update. It's in the Letters from Subscribers section, and the last out of 4 questions that we replied to in that report.
Letters
Q: I bought 200 shares of UVXY (ProShares Ultra VIX Short-Term Futures ETF) @ $20.10 today which is an all-time low (a year ago this ETF traded at over $132 per share). Needless to say, with the VIX at around 15-16, there appears to be too much complacency right now given all the debt problems, the fiscal cliff, and the market's ever-increasing volatility.
Anyway, I thought that this would be a very good six month hold, at least (it dropped over 7 points last week alone). What do you think?
A: The UVXY ETF is indeed at its all-time low, but please keep in mind that it's been around for only a little more than a year. It's based on the VIX Index and the index itself is not at an all-time low. It would have to drop by more than 30% to be at its all-time lows. The long-term support (created by 2010, 2011 and 2012 lows) is right now at 13 and the index is at 15.21 at the moment of writing these words. However, it does seem that we will either have a plunge in stock prices or a rally (if they move above their previous highs). So in terms of a 6-month trade, we think the odds are in your favor.
Q: I enjoyed Mr. Radomski's article "Gold as Portfolio Insurance." However, the comment "...This might reflect investors’ fear that the US government will eventually default and their belief that gold may be a safe haven in case of such a development" is correct only in the sensethat investors may (illogically) fear US default, because they are ignorant of the fact that since all US government obligations are denominated in US dollars, the US will never default. No country which is the monopoly issuer of its own currency need ever default on debts denominated in that currency. Cf. "Soft Currency Economics" (available in e-reader form on Amazon), or "The Seven Deadly Innocent Frauds of Economic Policy", both authored by Warren Mosler.http://moslereconomics.com/
A: Good point, and this claim is technically true - what we wrote is not entirely precise and we apologize for the confusion. We made a simplification to convey the message in clearer language. The point is that if the US government’s obligations are so huge that they cannot be met otherwise than by hyperinflation then we will not have a default in a technical sense, but we will have it practically. This is the case because the value of debt will be lowered so much through hyperinflation that whatever is paid off will effectively (in real terms) only be a tiny fraction of what was owed. Therefore, even though technically the debt would be repaid, in real terms, it wouldn't. Would a semantic discussion make any difference for USD holders and precious metals investors? No - and this is why we wrote about the fear of default. The implications remain unchanged.
Q: You have suggested putting a stop order on our short term long positions. If the market goes under $1,695, does this automatically mean that it will trade to $1,620?
Might it go to $1,685 or $1,640 or the November low $1,672.5? Would these levels be good buying points?
If the market does trade below this level, how long do you think that would last? Best regards.
A: If gold moves below $1,695 we would expect it to stay there for no more than 2 months and we would expect the bottom to form close to the end of the year. We don’t think this is the most likely outcome, though. We believe that precious metals will manage to rally without another big ($50+) decline first.
If gold did decline, there would also be serious support close to the $1,670 level (300-day moving average), so gold might bottom there. Again, we remain bullish.
Q: What probability do your technical indicators show for gold going over $1,800--and staying over $1,800--and if so, by when?
A: We have no indicators for estimating such a probability (actually, it is the "staying there" part that makes it practically impossible to calculate even if we made some statistical assumptions). Our best guess is gold will move above $1,800 before the end of the year and then consolidate above this level for a week or several weeks, at which point the rally would continue.
Summary
The short-term situation in the USD Index is a bit unclear but the long-term analysis and the Euro Index provide useful details. They indicate that the outlook for the USD Index is more bearish than not for the weeks ahead, and this has bullish implications for the precious metals.
The same can be said for the general stock market. The short-term situation is not clear because a breakdown below the rising support line has not been invalidated. If stocks move lower, than the next support line is not far away. The downside is therefore limited whereas the upside potential is much greater. Technically, the medium-term trend in stocks is up plus there are fundamental factors for increasing nominal (!) prices of stocks and other assets like open-ended QE. The implications are therefore more bullish than not for stocks, especially the mining stocks which will move higher if metals continue their rally and that is very likely in our view.
This week’s decline in gold prices was quite significant but has reversed on an intra-day basis, with a rally on the following day. This is a bullish sign, and, in the past, a rally was generally seen next. Exceptional strength was seen in silver and the SLV ETF, and this is also a bullish sign for things to come.
The miners actually moved higher Wednesday when gold prices declined. This is a bullish signal for the mining stocks, which could have been depressed by recent fiscal cliff discussions. Once it’s obvious that more money will be printed, they could catch up with a vengeance. It seems better to be on the long side of the market today with a stop-loss in place. This will expose you to gains while protecting against losses.
Trading – PR: Long position in gold, silver and mining stocks
Trading – SP Indicators: Long position in gold, silver and mining stocks with an additional weekly trade in mind (however, this period will be probably prolonged as the SP Extreme #2 indicator is below its signal line and likely to move above it, thus generating another 2-week buy signal)
The stop-loss prices for long positions are: $1,695 for gold, $32.7 for silver and 430 for the HUI Index.
| Portfolio's Part | Position |
|---|---|
| Trading: Mining stocks | Long |
| Trading: Gold | Long |
| Trading: Silver | Long |
| Long-term investments | Long |
Thank you for using the Premium Service. Have a profitable week and a great weekend!
This completes this week’s Premium Update. Our next Premium Update is scheduled for December 7, 2012.
As we like to over-deliver in our promises, we decided to keep sending you Market Alerts on daily basis at least until the end of December with the exception of Fridays, when Premium Updates are posted (we will issue an alert if what we wrote in the update becomes outdated on the same day it is posted, though).
Thank you.
Sincerely,
Przemyslaw Radomski, CFA


