
If we had an ounce of gold for every time we wrote the word “Greece” in the Premium Updates this past year we would have a nice pile by now. Yes, Greece just keeps popping up. Europeans are frustrated over Greece's ability to hurt the continent’s economy. Because Greece uses the euro, its fiscal problems can weaken the currency and lead to higher interest rates for all Europeans. It is not surprising that a February poll found that a majority of Germans want Greece out of the euro zone. But for now it seems they are willing to do another bailout, which is why gold steadied around its highest in nearly four weeks on Tuesday, but gave up earlier gains after a report that Germany could smooth the way for Greece to get a bailout. (Wednesday gold gained $8, or 0.5%, to $1,544.60 an ounce on the Comex division of the New York Mercantile Exchange on report that showed that U.S. employers added fewer private-sector jobs than expected and that growth in the manufacturing sector slowed down.)
Meanwhile, European officials met to draft options for a second bailout package for Greece to help relieve the country of its massive debt burden. It is with great reluctance that European governments have come to the conclusion that an additional 60 billion euros now, while politically unappealing, would be less costly over the long run than the unquantifiable public money that would be needed if a restructuring of Greece’s debt produced a contagion that spread to Portugal and Ireland, possibly Spain and to the financial system as a whole.
So far, nobody has come up with an answer to the question of how an economy already in free fall will generate the growth to produce the needed budgetary surplus to start paying down its debt. A year ago panicking Greeks were willing to pay large premiums over the market price of gold to secure their savings. A crisis of confidence about the euro causes investors to fly to safety, which includes precious metals. Although Greece is the most immediate problem, the other dominoes are lined up.
One of these days it is likely that Greece will have to restructure its debt (a polite way of saying default.) We’ve heard talk of that ever since the crisis began, but have you ever wondered how events would unfold if that were to actually take place? This week Moody's became the latest agency to warn of a chain reaction of severe consequences for the 17-nation euro area if Greece were allowed to default next month, when it faces a 13.4 billion euro funding crunch. Ireland and Portugal would be next to go before the firing squad. A Greek default would hit American exports hard. The dollar would strengthen relative to the euro, and that would make American exports more expensive for Europeans. Greece would likely leave the euro zone and return to its former currency, the drachma, which would be severely devalued against the euro.
We recently saw an article in the Telegraph that spells out some more possible consequences of a Greek default. It doesn’t mention what will happen to the price of gold in such an event, but if history is any guide, it will shoot up--substantially. Take a look at some of the points made in the Telegraph article about what could happen if Greece were to default:
- Every bank in Greece will instantly go insolvent.
- The Greek government will nationalize every bank in Greece.
- The Greek government will forbid withdrawals from Greek banks. (Since the crisis 60 billion euros in deposits have been withdrawn from Greek banks, about a quarter of the country’s output. Bankers in Athens said that outflows were particularly severe last Thursday and Friday after comments — later described as rhetorical — by a Greek politician about the possibility that Greece could stop using the euro.)
· To prevent Greek depositors from rioting on the streets, Argentina-2002-style (when the Argentinian president had to flee by helicopter from the roof of the presidential palace to evade a mob of such depositors), the Greek government will declare a curfew, perhaps even general martial law.
· Greece will redenominate its debts into “New Drachmas” or whatever it calls the new currency (this is a classic ploy of countries defaulting)
· The New Drachma will devalue by some 30-70 per cent (probably around 50 per cent, though perhaps more), effectively defaulting on 50 per cent or more of all Greek euro-denominated debts.
· The Irish will, within a few days, walk away from the debts of its banking system.
· The Portuguese government will wait to see whether there is chaos in Greece before deciding whether to default in turn.
· A number of French and German banks will make sufficient losses that they no longer meet regulatory capital adequacy requirements
· The European Central Bank will become insolvent, given its very high exposure to Greek government debt, and to Greek banking sector and Irish banking sector debt.
· The French and German governments will meet to decide whether (a) to recapitalise the ECB, or (b) to allow the ECB to print money to restore its solvency. (Because the ECB has relatively little foreign currency-denominated exposure, it could in principle print its way out, but this is forbidden by its founding charter. On the other hand, the EU Treaty explicitly, and in terms, forbids the form of bailouts used for Greece, Portugal and Ireland, but a little thing like their being blatantly illegal hasn’t prevented that from happening, so it’s not intrinsically obvious that its being illegal for the ECB to print its way out will prove much of a hurdle.)
It’s not a pretty picture. This is why we like to be invested in gold.
To see what can happen when a country begins to slide down the precipice take a look at what has been happening recently in Belarus, a country that is not exactly on our radar screen this week. The Belarus economy is in a free fall and citizens of that former Soviet republic of 10 million are desperately trying to get out of their own currency. Anyone who has some gold stashed away must feel like a king. The national currency, the ruble, has lost in recent weeks between 50 percent and 200 percent of its value (depending on whether it’s the official rate or the black market rate.) Salaries and life savings are evaporating and panicked Belarusians are trying to sell their rapidly depreciating rubles for more stable currencies or even for sugar, salt and rice. However, it seems that the banks themselves have run out of dollars and euros, or are restricting cash trades.
Don’t make the mistake of thinking that things like that can only happen in a country like Greece or Belarus. The best way to be prepared for bad times is to have gold. It has proven itself over the course of thousands of years of human history.
We know that in the long term gold will go up. To see how the yellow metal will behave in the short term, let’s turn to this week's technical part with the analysis of the Euro Index (charts courtesy by http://stockcharts.com.)
Euro - USD Indices
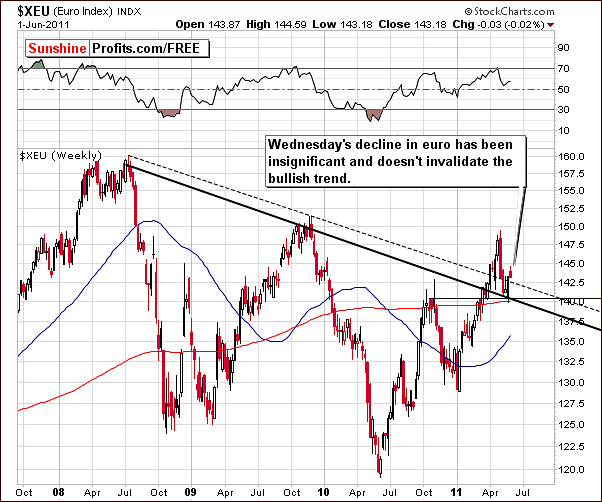
In the long-term Euro Index chart this week, there have been some interesting developments. We have seen a confirmation of the recent breakout and a further verification of it. It is significant that index levels are above both declining support lines and Wednesday’s downturn appears to be nothing more than a small correction. In short, the price action seen this week does not appear to have been overly bearish in nature.
Since the situation in the Euro Index appears bullish, one would expect the USD picture to be bearish. However, that is not really the case.
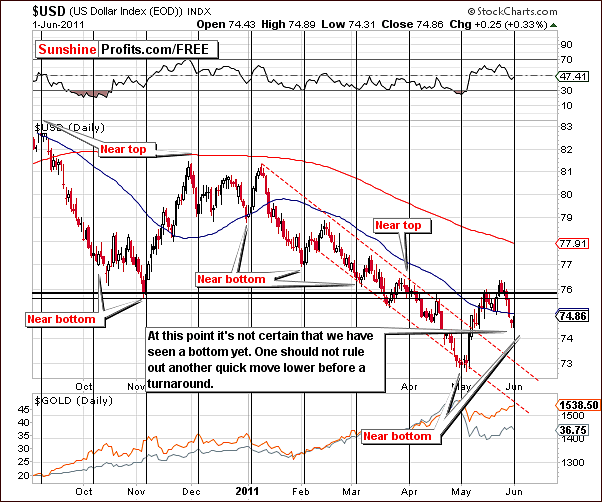
In this week’s short-term USD Index chart we see that the USD Index is right at a cyclical turning point and it is likely that a reversal will be seen to the upside at least on a temporary basis quite soon. The cyclical turning point lines in our chart represent an estimated time for the reversal to be seen. It appears at this time that the dollar is close to a local bottom.
Please note that these moves have taken place on a “near to” basis in the past, so the bottom could not yet be in, but we’re expecting it to be formed in the following days.
Again, it could be the case that we are actually seeing the beginning of a small rally. The real questions are “is the bottom in?” and “is a rally likely to follow?” If so, it is likely that a decline will be seen in the Euro Index. The medium-term picture for euro remains bullish (even though there are fundamental reasons for the tendency to change as stated in the first part of this update), so the decline could probably end up being a retest of previous lows or something similar. These local moves could be dangerous to precious metals prices; more will be discussed later on.
Summing up, the risk of higher USD Index levels is quite significant and would impact the precious metals sector in a negative way. It appears that this is a factor that must be watched closely in the days ahead and caution is warranted with respect to speculative long positions in the precious metals sector.
General Stock Market
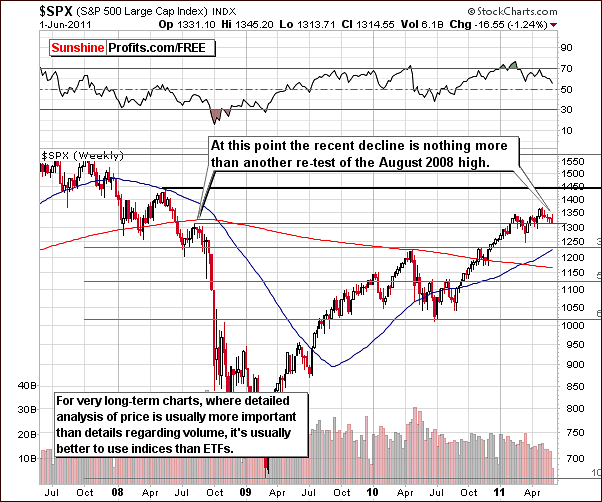
In the very long-term general stock market chart this week, once again we see the S&P 500 Index at the level of the August 2008 highs. From this perspective, the recent declines appear to simply be a retest of this support line. Current index levels still hold a long-term bullish position as far as this chart is concerned.
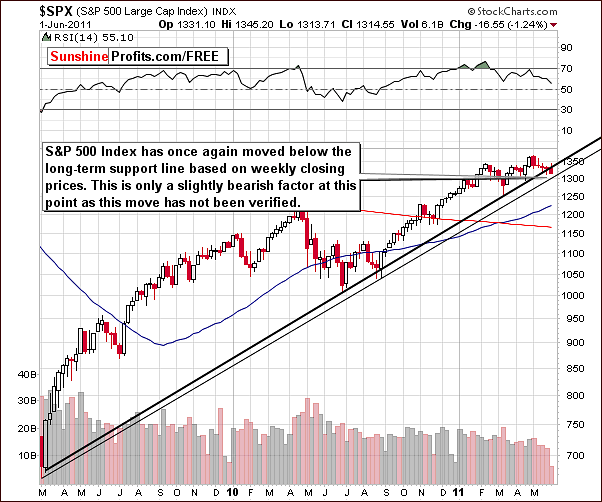
In the medium-term chart this week, we see that index values have moved below the rising support line created from the local bottoms of weekly closing prices in 2009 and 2010. Wednesday volatile downward move is viewed as only slightly bearish at this time since the move has not been verified. Naturally, what we are seeing on the last candlestick on the chart is not a weekly closing price as we’ve based this chart on the data available on Wednesday.
Another strong support line based on weekly lows is just below Wednesday’s closing level (1,300) and could provide support if the move below the first support line is verified. Whatever the case, the downturn appears only to be a temporary move at this time.
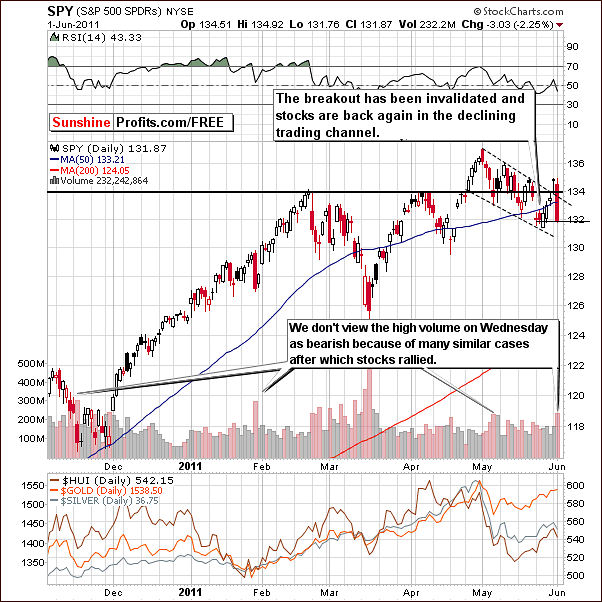
In this week’s short-term chart, the situation appears less bullish. The SPY ETF price level is very close to the closing price levels seen last week but we are in a special situation at this time. Prices failed to break out and subsequently moved back into the trading channel on Wednesday. This action is referred to as a fake out and is quite bearish in nature.
So the situation is now less bullish than before, but it still does remain slightly bullish at this time based on the long- and medium-term charts discussed earlier. Volume levels have been significant, however this is not an overly bearish factor since, on many occasions in the past, similar volume patterns have been followed by an ensuing rally.
Once again we have included the chart featuring the XBD Broker-Dealer Index as a proxy for the financial sector. Last week we wrote the following:
We can see that the financials have been underperforming stocks in recent months. Normally this is bad news for the general stock market. The key point here, however, is the relationship between the financials and all other stocks.
Simply put, the divergence between the two is not a short-term trading signal. It merely suggests that there is likely to be a turnaround in the general stock market, but we must keep in mind that this signal is not precise – it could easily take one to two months to materialize if it’s not confirmed by any other signal. It seems best to treat this signal as a yellow warning flag of caution which indicates that, at some point, stocks will top out and the subsequent decline could be significant.
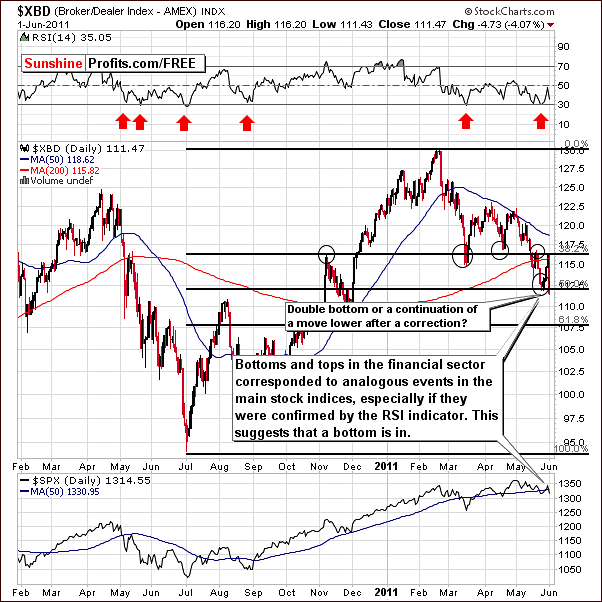
Other factors to keep in mind when analyzing the financials are that they have been reliable in the past and may indicate a short-term bullish trend for stocks if we take short-term tops and bottoms into account. Often when financials reach their support level and a buy signal is confirmed by their RSI level, a local bottom may very well be seen in the general stock market. This appears to be the case now and stocks appear to be at or close to a local bottom at this time.
This is consistent with general seasonal trends of the past which show stocks frequently rally into the first week of June and then decline. It seems, therefore, that the general stock market will likely move higher for the next week.
We have indeed seen the previously-mentioned rally, but once financials moved to their Fibonacci retracement level, they have changed direction very quickly. In other words, a slight move upwards met resistance and the financials declined once again back to the level of previous lows.
The situation remains quite tense at this time; something is definitely going on but it is blurred as to precisely what. It could be that a verification of the breakdown below the Fibonacci retracement level is under way or that a double bottom is forming. The days ahead will likely provide additional clues. Neither of these two likely possibilities has been confirmed at this time.
Summing up, the situation in the stock market is still bullish but less bullish than it was the case a week ago. Let’s take a look at the current readings from the correlation matrix to see what all of the above means for gold and silver investors.
Correlation Matrix
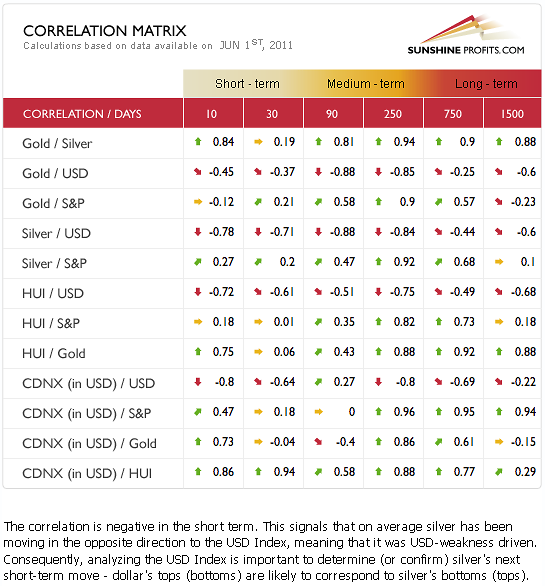
In this week’s Correlation Matrix, we see that the general stock market and the short-term moves in gold, silver and mining stocks show very little correlation. Stocks have moved lower for several weeks while the precious metals sector has been recovering. Although daily moves sometimes appear related, the relationship is quite weak.
Consequently, the fact that we have an unclear situation in the main stock indices is not really a major disadvantage as a move in either direction is not very likely to have a strong impact on the precious metals sector.
The currency markets appear much more important to the precious metals sector as the correlations between the two were more significant. The USD Index being at or close to a cyclical turning point is therefore of bigger importance to precious metals investors than the lack of clarity in stocks. Naturally, it is likely to have a much greater impact upon gold, silver and gold and silver mining stocks than Wednesday’s decline in the general stock market.
Based on the above, we would describe the current situation as being in “Watch Out” territory.
With the above in mind, let’s take a look at directly at the precious metals sector.
Gold
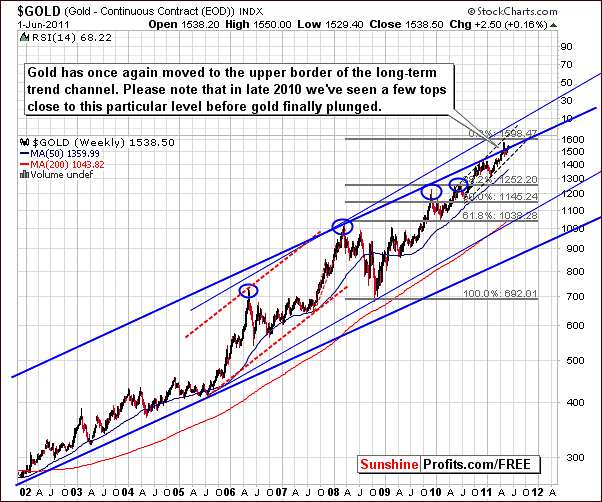
In the very long-term chart for gold this week, we see that its price has moved insignificantly above the rising trend channel. Last week we discussed this possibility stating that “here we can see that gold has risen above the upper border of the very long-term resistance line. This line was actually broken temporarily and a similar price action seen late in 2010 leads us to believe that we may see a similar pattern here.”
We are now seeing this as gold did not manage to truly break out this week and it does not appear likely that it will do so. The upper border of the trend channel will likely keep the current rally in check and the most probable development seems to be that gold could move to its previous highs before then heading lower.
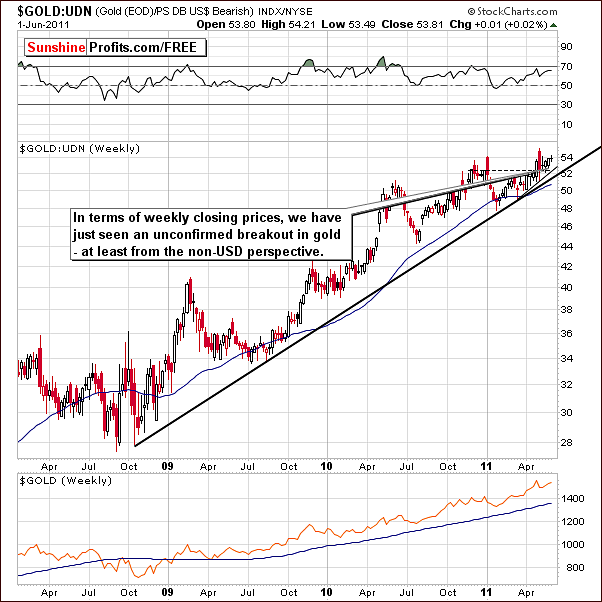
In gold’s long-term chart from a non-USD perspective, we see some bullish factors this week. Price levels are at their highest point for the year, excluding the early-May highs and the early-2011 high. However, if we take weekly closing prices into account, gold has just moved to new highs.
This is a bullish trend and we also have a bullish price pattern in place as well. The cup and handle pattern can be seen in the chart of 2011 prices (Jan – Apr being cup and May being handle). This is a very bullish pattern but it is still too early to place a great deal of faith in this due to the information provided by other gold charts this week. It does not seem a good time to bet on a medium-term rally here especially in view of the week seasonal tendencies for gold at this time.
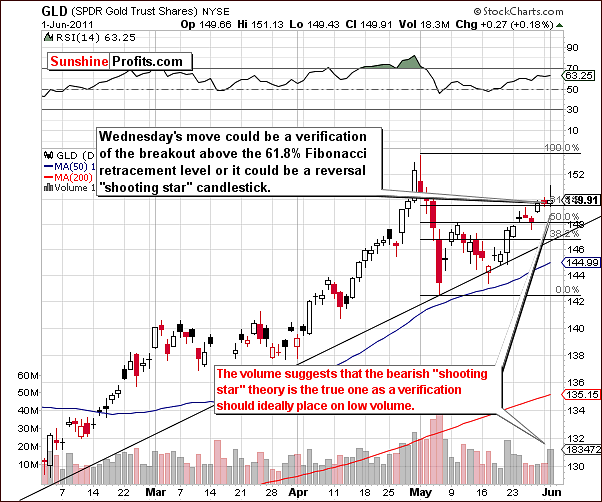
In this week’s short term GLD ETF chart, we have an important cautionary note. Wednesday’s intra-day price action rally and reversal could be viewed as a breakout above the 61.8% Fibonacci retracement level or a bearish shooting star candlestick. The latter is one of the most reliable patterns signaling the reversal of a trend. Generally this is confirmed by high volume and we have seen high volume significantly above those of previous days. Normally, the verification of a breakout is accompanied by low volume so this appears not to be the case at hand.
The situation is certainly quite risky at this time. Several bullish factors were seen in previous charts but the shooting star candlestick pattern, high volume levels, and expected turnaround in the USD Index leads us to view closing speculative long positions in gold as a good idea right now. Although gold may still go a bit higher in the following days, the probability of a decline from here based on Wednesday’s price volume action has increased significantly.
The risk-reward ratio now points to closing one’s positions and realizing profits that you’ve generated based on the May 5th, 2011 Market Alert, where we suggested opening speculative long positions.
Summing up, the recent contra-trend rally appears to be approaching its end and with the expected downturn close at hand, bearish factors have surfaced this week which have increased the risk of holding speculative long positions. It seems that the time has come to exit rather than enter these types of ventures.
Silver
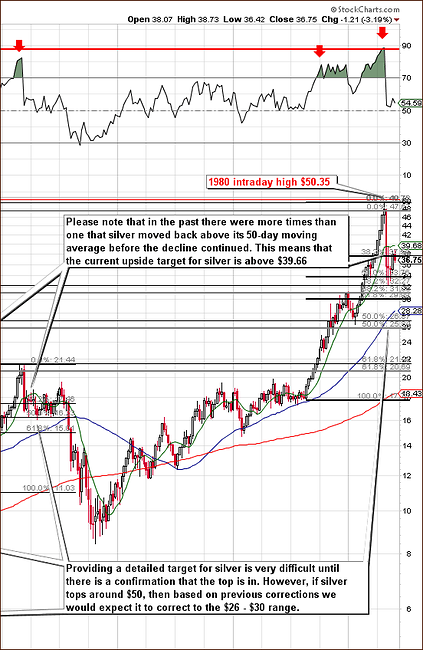
We once again begin our analysis with the very long-term chart (clicking on it will enlarge it) as a reminder that in many similar declines in the past the price moved back above the 50-day moving average before the decline continued. In this case, it would mean a move above the $39.68 level, which is not something that we have seen recently and therefore it does not appear that a decline is imminent at this time – we could still see a sharp rally above this level before the decline continues.
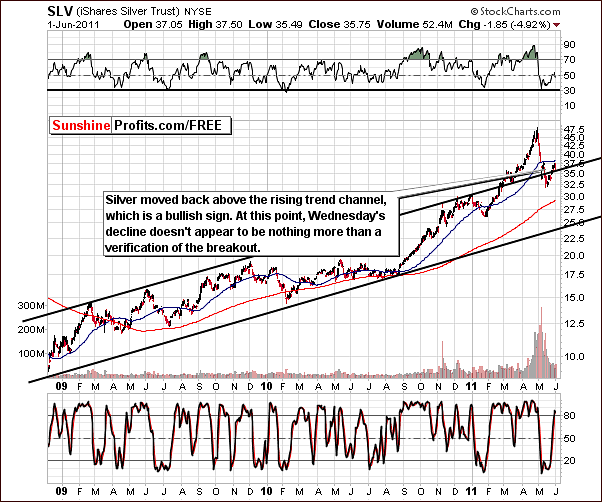
In this week’s medium-term chart for silver, we have seen a move back above the rising trend channel and the decline seen on Wednesday appears to be nothing more than a verification of the breakout. Therefore, higher prices appear to be quite possible from here for the SLV ETF.
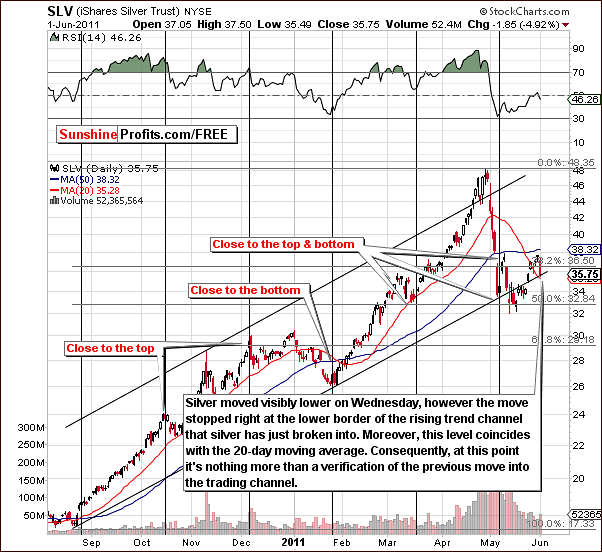
In the short-term chart this week, we see another verification. In this case, the price levels are back within the rising trend channel and have moved above the 20-day moving average. This has been an important support and resistance line many times in the past.
Prices have recently moved above it and then declined (on Wednesday) back to it which at this point is nothing more than a confirmation of the previous move above the aforementioned resistance levels.
Summing up, silver appears to be in a more bullish trend than does gold at this time even in view of Wednesday’s decline and additional support levels are in play. However, based on the situation in the USD Index, it does not appear to be worth betting on silver’s rally in the short run at this time.
Gold and Silver Mining Stocks
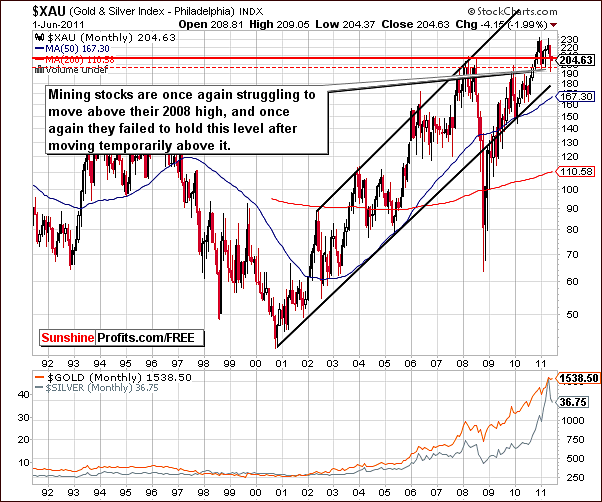
In the very long-term XAU Index chart (gold and silver mining stocks) this week, we continue to see a battle for moving above the level of the 2008 highs. On Wednesday, mining stocks failed to hold the gains above these 2008 level. This is a development which has been seen many times in the past and the situation here is inconclusive at this time.
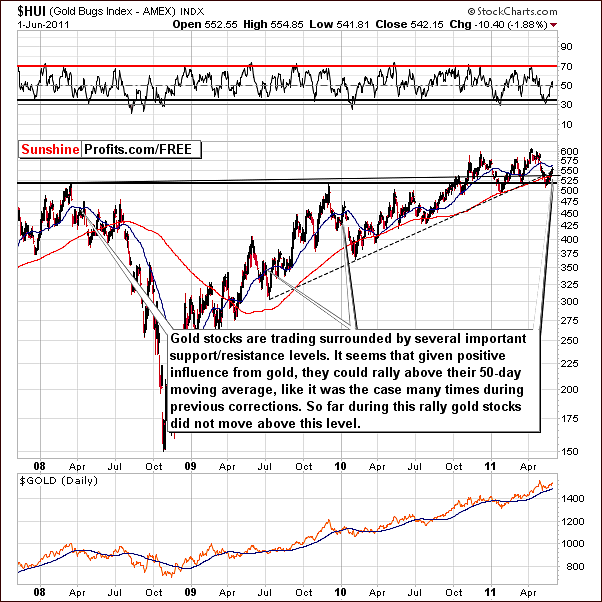
In this week’s HUI Index chart, we have a clearer picture concerning gold mining stocks. Index levels did not move above the 50-day moving average as was seen in the recent past during very similar price moves. Since history tends to rhyme, we would expect to see a similar temporary breakout to be seen before the decline is resumed.
All in all, the chart above provides rather bullish information, however the risk of a downturn is relatively high based on the situation in gold and in the USD Index.
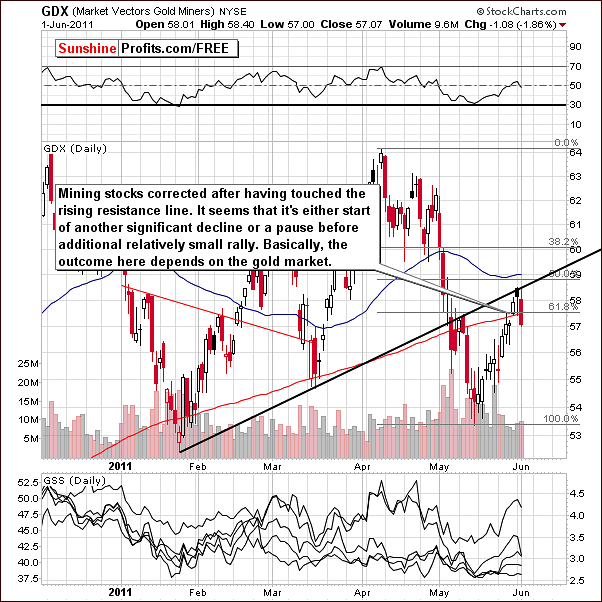
Our final mining chart this week is the GDX ETF chart. Here the rising resistance line has been touched and although stocks bounced off, the decline was not severe. Therefore, the short-term uptrend appears to still be in place. In actuality, the direction of the next trend depends on the gold market and on the USD Index (both directly and indirectly through gold) and the situation is quite tense at this time.
Summing up, the situation for gold and silver mining stocks can be described this week as inconclusive, risky or tense. Taking previous declines into account makes one expect another move higher so that gold stocks move above their 50-day moving average, but this is not likely to happen without support from gold and – as mentioned earlier in this report – the situation on the gold market has become rather risky itself.
Summary
The USD Index is right at a cyclical turning point and the risk of a brief temporary turnaround is quite high. This is in spite of the outlook for the euro which remains somewhat bullish, which, of course, is bearish news for the dollar. The currency markets appear to be more important than stocks are to the precious metals sector at this time.
The general stock market now appears to be less bullish than in week’s past but still has a slightly bullish outlook at least for the short term. Still, it no longer appears to have a decisive short-term influence upon the precious metals.
Concerning gold, it is important to keep in mind that the dollar could rally soon and along with seasonal implications for the yellow metal, it now may be a good idea to close long speculative positions. The turnaround risk for gold prices is high at this time and the important shooting star candlestick pattern should not be ignored.
The risk/reward ratio is no longer favorable for speculative long positions in gold. It is possible that the current contra-trend rally could continue for a few days or so but we believe it is not worth betting on at this time.
At the same time we don’t think that the situation is bearish enough to open speculative short positions – at least not yet. The same goes for the long-term positions. No action seems warranted with respect to long-term investments at this time (we don’t recommend selling them). We will continue to monitor the situation and report to you accordingly.
Our next Premium Update is scheduled for Friday, June 10, 2011. The monthly Juniors section is not included this week due to our editor completing his Level II CFA exam on Saturday. It will be part on next week’s Premium Update once again. We apologize for the inconvenience.
This completes this week's Premium Update.
Thank you for using the Premium Service. Have a great weekend and profitable week!
Sincerely,
Przemyslaw Radomski

