
This week we turn our attention to the East to catch up with events in that part of the world that could influence the global economy and the price of precious metals.
The Korean Peninsula
This week we saw rising tensions between North and South Korea following the sinking of a South Korean ship. Political tensions between North and South Korea have risen since a team of international investigators concluded that Pyongyang was responsible for the deadly sinking of a South Korean naval warship in March. Given how unpredictable and paranoid the North Koreans can be it would be a mistake to dismiss the events as global tensions often affect the price of gold.
North Korea said this week it will "totally freeze" relations with South Korea and pull out of a nonaggression pact with Seoul, marking the widest rift between the Koreas in two decades. It also raised questions over the next moves by the regime in Pyongyang and its main ally, China. Chinese officials avoided open censure of Pyongyang and repeated their position that all sides should exercise restraint. Meanwhile, the North told its troops and people last week to prepare for confrontation with the South.
Gold prices gained this week as tensions on the Korean peninsula and worries about Europe sparked safe-haven bullion buying.
China, Trade and the Yuan
American and Chinese officials met this week to discuss a variety of issues, including important economic ones. When it comes to dealing with China, Timothy Geithner is one of the most culturally savvy Treasury Secretaries in U.S. history. He studied at Chinese universities and speaks some Mandarin. He and other American officials had a few items in their agenda; to push Beijing to level the playing field for U.S. companies operating in China. Hilary Clinton said the U.S. would seek greater openness in regulations, nondiscrimination, fair access to markets and strong enforcement of intellectual property rights, all important elements in fulfilling President Barack Obama's pledge to double U.S. exports within five years and create 2 million jobs.
Then there is the issue of the trade advantage Beijing has because of an undervalued Chinese currency. As the European financial crisis deepens, Beijing appears to be pulling back from expected moves to loosen its currency's peg to the U.S. dollar, saying the euro's slide to four-year lows against the dollar is putting too heavy a burden on its own exporters. Some economists say the yuan (renminbi) is undervalued by up to 40 percent against the dollar, giving Chinese exporters an unfair advantage in overseas markets. The immense U.S. trade deficit with China remains a sore point. The United States is far from alone in calling for China to let the yuan rise. Government officials in Singapore, India and Brazil have also called publicly in the last three weeks for the Chinese government to break the yuan's peg to the dollar. In public at least, China has given no real ground on any of these top issues.
China's Euro Troubles
The pain of the European debt crisis is spreading as the plummeting euro makes Chinese companies less competitive in Europe, their largest market, and complicates any move to break the Chinese currency's peg to the dollar. The euro has plunged against the yuan in recent weeks, at one point last week reaching its lowest level since late 2002.
Even China - the world's fastest-growing major economy- is not immune to the crisis that started in Greece and threatens to spread across much of Europe. The yuan has risen about 14.5 percent against the euro during the last four months.
Thursday shares on Wall Street jumped at the open, to a considerable extent on assurances by Chinese authorities that Europe would remain an important market for investment. A statement by the People's Bank of China dismissed reports that the State Administration of Foreign Exchange, which is responsible for assets of more than $600 billion, was evaluating its investment in euro-zone debt.
Still, the massive coverage that the European problems have gained recently suggests that the decline in the euro might be over, or very close to being over.
India-Great Urban Migration
McKinsey Global Institute (MGI), prestigious consulting firm, believes India is on the verge of the second-greatest urban migration the world has ever seen. In their new report India's Urban Awakening, MGI says India's urban population could swell to 590 million-nearly twice the size of the United States-by 2030. India would need to build a city the size of Chicago every year for the next 20 years in order to create enough commercial/residential space to meet the needs of its growing population.
MGI says India will have "68 cities with populations of more than 1 million, 13 cities with more than 4 million people and 6 mega cities with populations of 10 million or more."
MGI says the Indian economy is expected to befive times greater by 2030, with urban centers being the key driver of this growth. It projects India's labor force to increase by 270 million-70 percent from urban jobs. This new labor force will also be relatively young compared to other BRIC countries.
While these numbers are amazing, perhaps the most important statistic for us is the projected growth of India's middle class. MGI estimates that India will have 91 million middle class households by 2030, that's more than a 300 percent increase from the 22 million they have today.
Historically, gold has been a preferred form of savings in India as well as in China and many of the other Asian countries. With incomes rising as more people enter the middle class, and with the numbers of the wealthy class increasing, it is more than likely that some of this new found wealth will flow into gold.
While these great, historic changes will take place in the far future, let's take a look at what is in store in the more immediate future. Let's begin this week's technical part with the analysis of the U.S. Dollar. Let's start with the long-term USD Index chart (charts courtesy by http://stockcharts.com.)
USD and Euro Indices
This week we have combined the USD index along with the Euro index together in our opening section. As was discussed last week, the euro accounts for more than 50% of the USD index and is still a major factor worldwide, impacting all global markets. Last week we saw the USD approach the 87 level and stated that a correction was likely to begin very soon. This was supported by an RSI trending in an overbought range at the time.
What we've seen this week is what could be called a short-term correction followed by a small rally. This may be nothing more than a double-top pattern. The 87 level was not decisively broken and the USD is currently around 86.3. The remarkable point seen in the above chart is the positive reaction of the PM sector. Taking the last USD rally into account and comparing the reaction to gold and silver, we see significant strength in precious metals. They have managed to rally along with the currency they're priced in, a very positive sign.

This week's short-term chart shows little more than what we saw in last week's update. We remain close to the mid-May level, having moved slightly lower. It is a tough call today as to whether we've seen a double-top or have a verification of a breakout. The precious metals managed to rise this week along with higher levels seen in the USD index. For this reason, we remain bullish regardless of whether the double-top or breakout actually becomes the reality.
Last week, we emphasized the need to monitor the performance of precious metals with the USD being a very important factor. Given that we continue to see positive trends in the PM sector, we look ahead to the likelihood that a correction will be seen in the USD index. In the past downswings in the USD used to result in rising PM prices. There is one factor that might suggest that this will not be the case, and that is the possibility that the last rally in PMs was caused by massive buying by European Investors. In this case, gold might move slightly lower if USD Index declines (euro rises). So far there is only a small probability that this will be the case, but we will continue to monitor the market for signs of weakness and report to you accordingly.

This week saw little change in the euro index. The long-term chart is nearly identical to what we published last week. Here, we have a double-bottom formation, which as one would expect, is the reverse of the double-top pattern that we see in the USD Index. Once again, whether we actually have a double-bottom or a breakdown and verification of it remains to be seen. The long-term chart points to bullish implications for the Euro Index and bearish for the USD Index.
We will continue to monitor gold and silver relative to the changes in this particular market. There is a possibility that the recent upswing seen in precious metals is due to European investors flocking to gold and silver given the weakness of the euro. Should they reverse their course and increase demand for the euro as it recovers, US investors could absorb the available gold and silver. This would be consistent with what has been seen in the past (more on that in the gold section later in this update.)
Summing up, this week has seen little change in the USD index and the points made in last week's update are still valid. The weakness of the USD must be monitored continually going forward and it will be equally important to see how the PM sector performs. We have seen some indications, however slight, which make it seem likely that precious metals will go higher from here.
General Stock Market

As for the general stock market, it provides us with much clearer implications for precious metals as compared to what we found in the USD and euro charts. Whereas the previous section gave several two-sided possibilities depending on which signal was favored, there is much greater clarity here.
In the very long-term chart above, we see very little change from last week. The implications which need to be re-emphasized here are the support levels which have been reached and the significance of the spike in volume based on weekly closing prices. Thursday's closing level, slightly more than 110, is above the 50-week moving average and also above the 50% Fibonacci retracement level. This is in line with what we expected and reported in last week's update.

This week we see a rebound in the long-term chart and this move caused the SPY/ETF to close above the declining black line seen above which is the multi-year resistance level. This line has now become a support level. We also see that the close is above the 200-day moving average line in the range of 110. Confirmation that the bottom is in is seen by a spike in volume as well as the low RSI level. Volume levels have not been declining recently (taking weeks into account), similar to what was seen in a 2008 pattern. This indicates that further declines are unlikely at least in the short run. To the contrary, we expect the general stock market to move higher and precious metals to do the same based on the technical signals visible in the above chart.
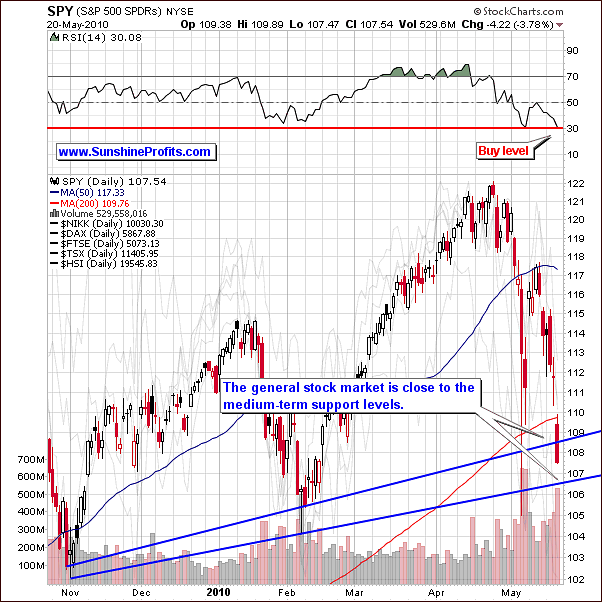
The short-term chart provides us with more timing details. This week we saw huge volatility as the general stock market tested (and verified) its support levels and finally closed above the 200-day moving average. This level is decisively above the rising support lines, regardless of which is selected.
The recent move up was not on huge volume nor were the volume levels extremely low. This trend is common in the early stages of a rally and therefore is not taken to be a bearish sign. This is also confirmed by the RSI level. In short, higher prices for the general stock market appear likely, a bullish short-term sign for precious metals.
Summing up, the general stock market moved up this week as expected and there are signs the rally will continue. Support levels are in place and volume levels indicated some strength in the recent upswing. Furthermore, we do not see some of the negative signs common in past bearish markets. In short, analyses of this week's charts indicate a bullish period ahead for both the general stock market and the PM sectors.
Correlations
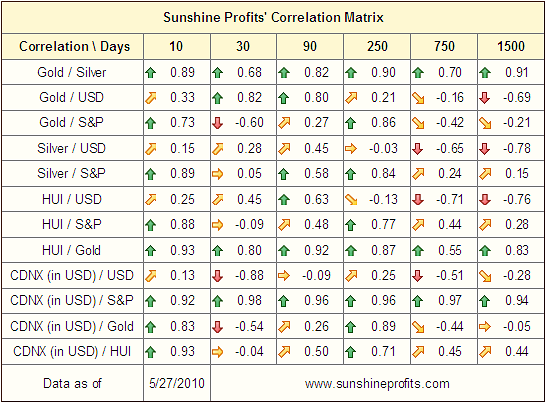
The correlation matrix, which was deemed to be of little use last week and therefore not published in the update, does give us better insight today. In the very short-term, 10-trading-day column above we see that gold, silver and HUI gold stocks show a high correlation with the S&P 500 Index. This is due to the fact that recently we have seen uptrends across these markets. Perhaps the signals coming from analysis of the metals themselves relative to the general stock market are most important. We base this on what we've seen regarding the USD index which has had a positive correlation with the PM sector stocks in the 30-day column above but is clearly wearing off as seen in the very low correlation coefficients found in the short-term column. Gold, silver and mining stocks have recently moved more independently, perhaps indicating an impact from the euro as opposed to the USD.
Summing up, the general stock market is providing us with more reliable short-term indicators as to where precious metals may go. All in all, this is a short-term bullish sign for the PM sector.
Gold
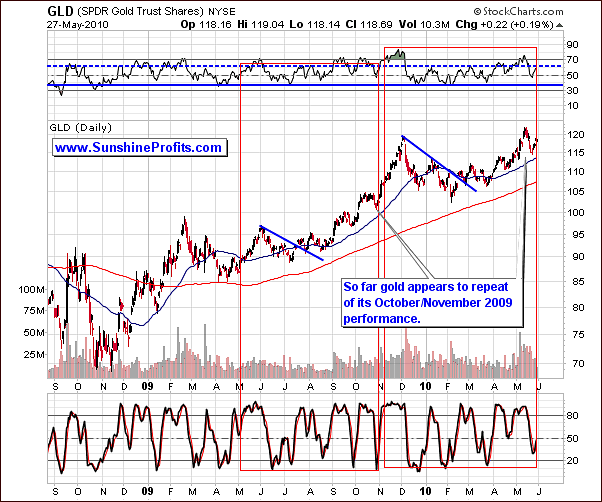
We see a situation similar to what we reported last week in the long-term gold chart. The self-similar pattern is again useful and indicates we may be seeing a repetition of October-November 2009. This is confirmed by both the RSI level and the shape of the stochastic indicator.
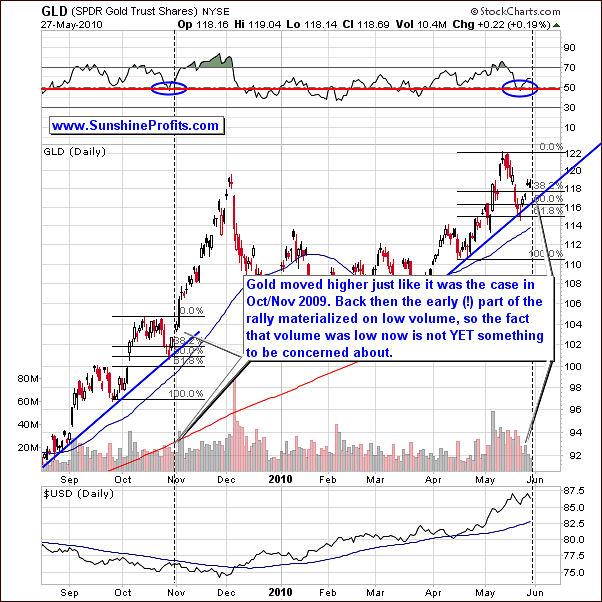
The short-term chart this week may appear quite perplexing at first glance. The price has perfectly followed the Oct-Nov 2009 pattern, but we have not seen huge volume levels. What one needs to keep in mind here is that at the beginning of November, volume levels initially were quite low (before the point marked with vertical dashed line), followed shortly thereafter by a tremendous increase (right after the point marked with the vertical dashed line.) The second thing that one needs to recall here is the fact that the scale of the pattern is bigger this time, which means that a few additional days on low volume are not necessarily a bearish sign. Still, if we don't see higher volume along with rising prices next week it will make us concerned about the existence of this particular rally.
So far the RSI and the stochastic indicators confirm a probable repetition of November's 2009 rally. Again, additional confirmation in the form of an upswing on huge volume is needed before we are ready to state that higher prices are very likely.
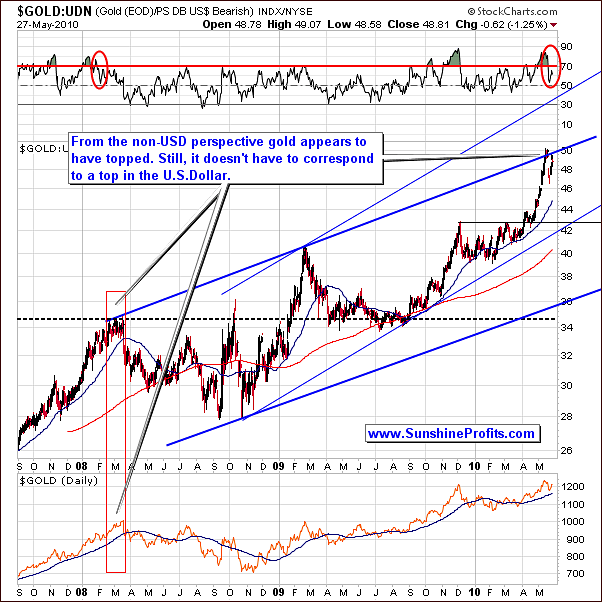
Looking at gold from a non-USD perspective (approximately - gold in euro), we see confirmation of points made in last week's update. Recall that we discussed how it did not seem that gold had reached its ultimate top in USD, although the opposite was true concerning non-USD markets. So far, this observation still holds true. Although we have seen a decline in gold prices this week in both USD and non-USD markets, volume levels and a rise in RSI levels confirm our prior theory. Strong similarities are seen when looking back to early 2008.
It still appears likely that gold will not go much higher from a non-USD perspective. However, we still see indications that gold will move higher on the USD side.
There's one more thing that we'd like to comment on regarding the "is this 2008 all over again" question and that the way that gold is likely to react even if we get a substantial decline from here in the main stock indices. We all remember how gold (and also the rest of the precious metals sector) reacted to the severe plunge in the world's main stock indices - it was far from amazing. In fact, gold got smashed along with everything else, as many (institutional) investors were required to raise cash
Here's how it can develop:
A hedge fund manager sees that his stocks are declining, so he thinks of selling some of his other investments (including gold), as this he recalls that everything declined back in 2008. However, before clicking the "sell" after having selected his gold position on his trading platform he decides to give this idea a second thought.
Hey - wait a second - gold moved temporarily lower, but just a year and a half after the decline started it moved about 20% higher, so in fact that decline was just a temporary phenomenon. In hindsight - there was nothing to be worried about - in fact, why did I sell back then?! Fundamentals didn't deteriorate, so why did I jump out of my gold position, when everyone else did? Hmm... I guess I panicked with everyone else. There were some margin calls that I needed to comply with, but there were other ways of raising that cash besides selling gold. Well, I can't fix what already happened, but I sure can learn on the past mistakes and make better decision this time.
Let's take a look at our quant team report... Wow! There's no way I'm selling gold this time! The correlation coefficient based on the last 3 years equals -0.42, which means that on average gold used to move rather in the opposite direction to stocks, so maybe if stocks decline from here, gold won't fall at all... It's a tough call, but even if it moves down temporarily, it's still likely to rebound soon and move to new highs, so why would I risk not getting back in near the bottom?
Besides, I know that John, Andy, Michael, and Daniel have also noticed gold's extraordinary performance just after the bottom was put and their quant team's have the same correlation coefficient, as we have and I sure don't want to have a lower rate of return than they do! So, I'm keeping my gold this time - I will have no trouble in explaining this action to my clients since they are aware of gold's performance.
As you may see, the above thought process appears rational, and if many institutional investors follow it, it might result in the decline in gold being minimal even if the general stock market plunges. After all, if many wealthy investors (that might influence the market) decide not to sell because they will believe the coming downturn is just a very temporary phenomenon, such downturn may not materialize at all.
Summing up, overall the situation for gold appears bullish. However, it is unclear if we are seeing the early stages of a big rally like November 2009. We would need to see a confirmation in the form of a visible upswing along with very large volume levels before stating that higher prices are likely.
Silver
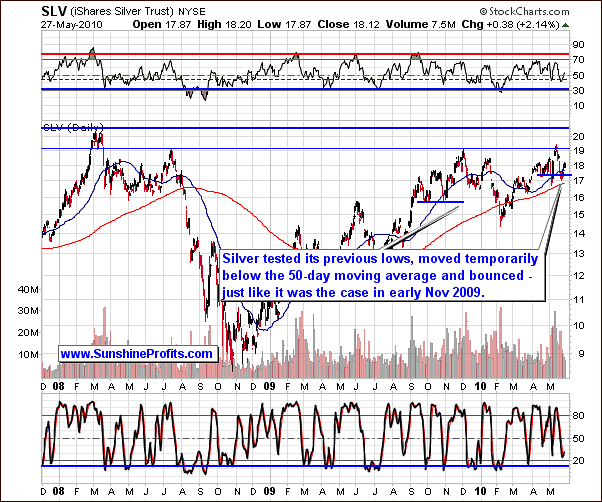
Moving on to silver, we can further emphasize what we have seen recently with respect to the self-similar pattern. It is clearly present today.
Silver declined to just below its 50-day moving average, back to the level of its previous lows, and then moved back above the 50-day line. Basically this was a replication of what we saw in October-November 2009.
So what does this tell us about silver's future? The above chart suggests that we will see higher prices in the coming weeks. However, this is in stark contrast to silver's seasonal tendencies. Recall that last week we emphasized the historical down-trends in the price of silver during the month of June, but at this point this is the only thing pointing to lower prices. The RSI is rising from a level just below 50 and the stochastic indicator has moved up from 20. Its shape gives support to a bullish period ahead for silver.
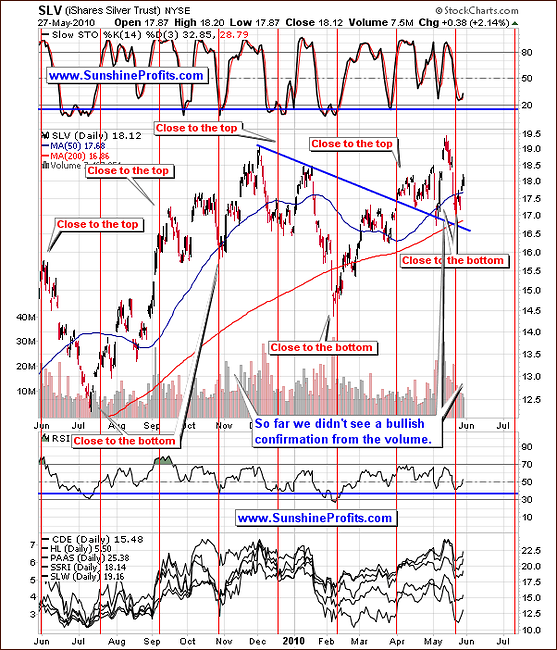
The short-term chart for silver this week gives rise to concern about volume levels. We do not see any confirmation of bullish sentiment here. On the contrary, this was in fact clearly evident last November. So the strong suggestion here is that caution is warranted at this time for silver. We will continue to monitor for weakness in the white metal and promptly report any developments to our Subscribers with a Market Alert or Premium Update.
Please note that the SLV ETF dropped to the 50-day moving average and verified it as a support just before a big rally materialized in the following weeks. So, if SLV moves lower to $17.70 ($18.05 in spot silver) on low volume, it would not be a sell signal. Conversely, if silver holds and this level provides strong support, a rally will be very likely.
Summing up, increased volume levels may come soon for silver, perhaps in the next few days. This is similar to what we discussed in the earlier gold section. The self-similar pattern is very much in play with a magnitude and timeframe nearly 50% larger than in the past. Should the volume rise in the next few days, it is likely that a rally will follow. On the other hand, we may see silver follow its seasonal pattern, severely slumping in early June. We will continue to monitor this closely and report to our Subscribers accordingly when we have more information. The bottom line is that we are cautiously bullish on silver.
Precious Metals Stocks
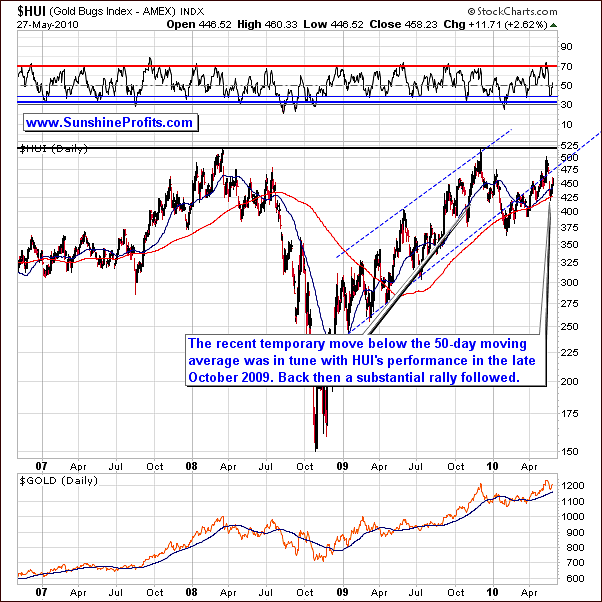
With respect to the precious metal sector this week, the HUI long-term chart last week seemed close to a bottom. It had approached its 50-day and 200-day moving averages and the RSI had moved to a probable low. This suggestion was that a bottom had been reached and a turnaround was likely.
This is exactly what we've seen this week. The fact that it is clearly seen in the long-term chart implies that the turnaround was quite sizable. The self-similar pattern appears to be confirmed by the performance of the precious metal stocks. In the past, when the HUI index moved sharply below its 50-day moving average and the RSI moved below its lower channel, a sharp turnaround with vengeance began a significant rally.
Perhaps this is what we've seen in the past week. The RSI rebounded and the HUI index rose sharply higher after bottoming below the 50-day moving average. If history repeats itself, as it so often does, the HUI index chart suggests that higher prices will be seen in the coming weeks.
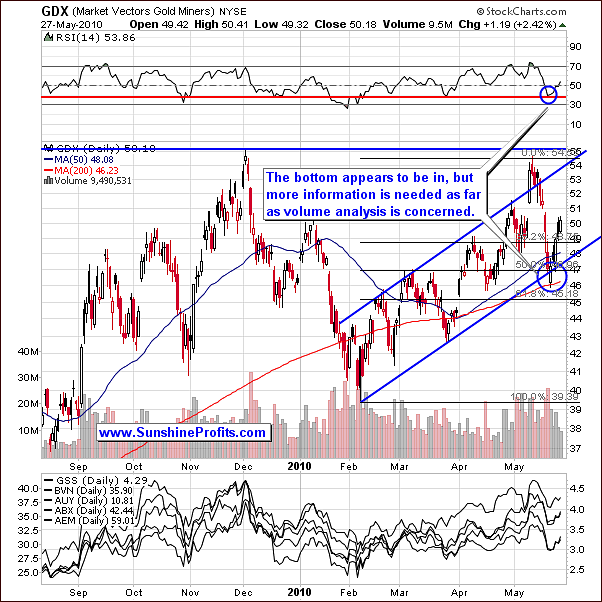
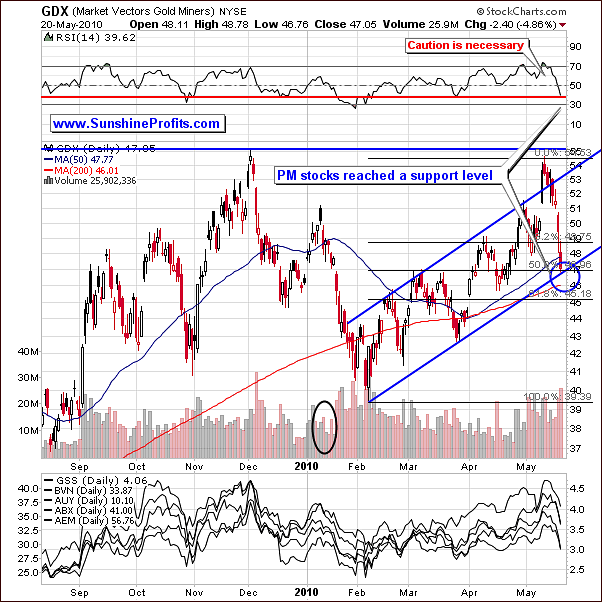
The GDX/ETF chart also leaves us with questions, mainly concerning volume levels. Precious metals stocks bottomed exactly at the support level indicated last week along with the RSI moving horizontally along the red line/bottom level in the above chart. The GDX presently is at the $50 level and the question is where do we go from here?
Analyses of previous patterns indicate the possibility of a sharp rally. Once again, however, low volume is a big concern. This phenomenon sometimes indicates diminished buying power, which in turn leads to lower prices.
Still, we need to take the scale of the self-similar pattern into account. In other words, what took two days before may take four days now. For this reason, it appears prudent to wait a few more days to see if volume increases along with price. If this happens, it will confirm that higher prices are very likely from here. If not, the opposite will be true and prices will be more likely to move lower.
Summing up, once again the self-similar pattern is a great tool in this section of the update. The major variable, which we are lacking, is high volume but due to the pattern size it appears that we need to be patient for a few more days. Much may be learned early in the week ahead to support the indications of bullish sentiment. Of course non-confirmation by lack of volume would support a bearish outlook instead.
Sunshine Profits Indicators
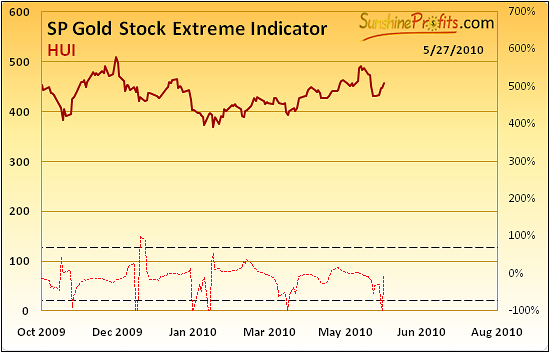
This week we've also seen several signals from our indicators, and all of them were positive for the PM sector. The above chart features our SP Gold Stock Extreme Indicator, which - according to its name - signals tops or bottom in the mining stocks. This week we've seen this indicator move quickly below its lower dashed line and reversed. This is what we've seen in the past several months when the prices were bottoming, so this is clearly a bullish sign.
Moreover, since mining stocks are highly correlated with the underlying metals this signal is bullish also for gold and silver.
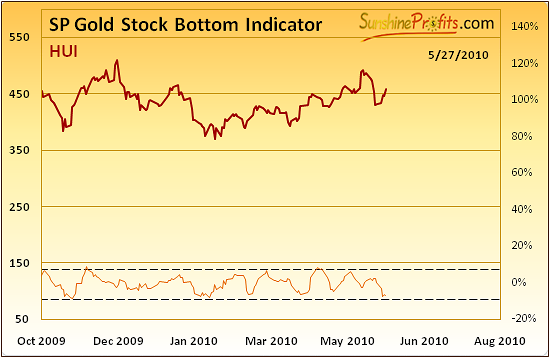
Another indicator dedicated to the mining stocks is also suggesting that what we've seen recently might have been the bottom.
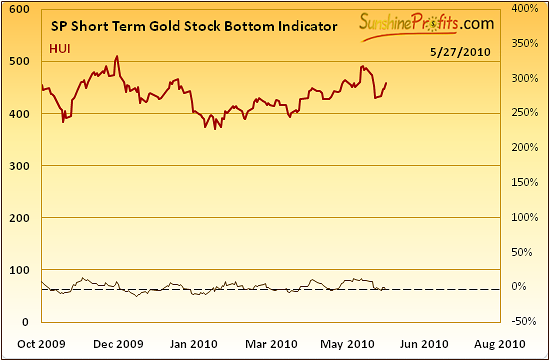
The SP Short Term Gold Stock Bottom Indicator moved slightly (barely visible on the above chart, but it was the case) below the dashed line and turned up once again. This is something that we have usually seen around the bottoms - please examine the above chart for details. Again, this is short-term positive factor of the whole PM sector.
If that wasn't enough bullish signals, the level that has just been achieved by the SP Gold Stock Bottom Indicator also suggests that the recent move lower was in fact a buying opportunity.
While we didn't see a clear buy signal (the value of the indicator didn't cross the dashed line), please note that the value of the indicator was this low during the previous bottoms. In fact, it was this low during the January 2010 low, and... Just before the huge November 2009 rally.
However, the most significant signal this week comes from the SP Gold Bottom Indicator. It is different from the previous signals, as what we've seen recently in this particular tool is a long-term buy signal.
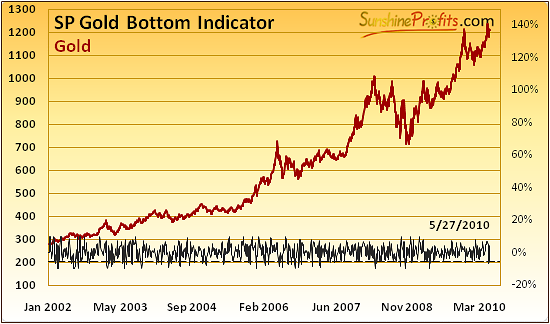
The long-term buy signal is given when the indicator moves below the dashed line (click here for a bigger version of the above chart.) Not only was that the case, but the indicator moved sharply higher just after flashing the signal, which we can view as a confirmation.
Summing up, our unique indicators point to higher prices. Of course, the above charts are no crystal ball, but they've proven useful many times in the past, so it's good (and profitable) idea to take them into account while making investment decisions.
There are three more charts that we would like to feature this week before summarizing the whole update.
Other Charts
The first of the charts featured in this section will be the Gold Miners Bullish Percent Index (a market breadth/momentum indicator that is calculated by dividing two numbers: the amount of gold stocks on the buy signal (according to the point and figure chart, which emphasizes strong moves while ignoring small ones) and the amount of all gold stocks in the sector.)
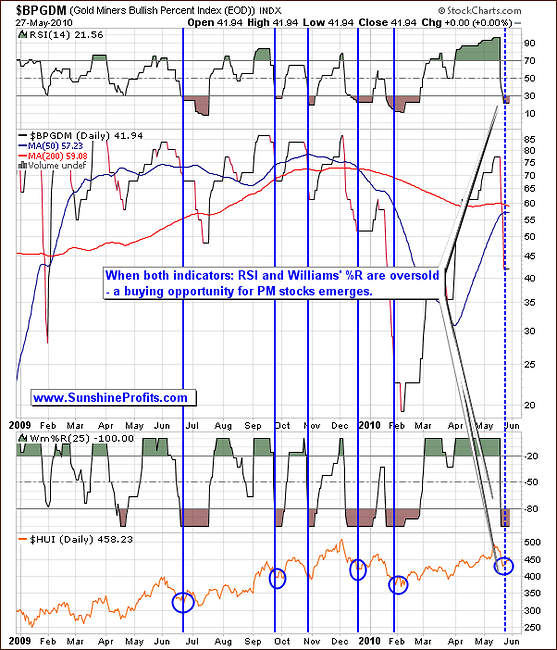
The above chart has been featured periodically, most recently in our January 21st, 2010 Update. At that time, we wrote:
The above chart features the particularly favorable moments for opening long positions in PM stocks. These moments are created by three signals: the value of the index declined significantly, the value of RSI is below 30 and the value of William's %R is below -80.
We have just seen all of the above signals, which could be considered as a buying opportunity. So, the Gold Miners Bullish Percent Index provides us with a confirmation of the bullish points made earlier.
The similar thing can be stated about the following GDX:SPY ratio chart.
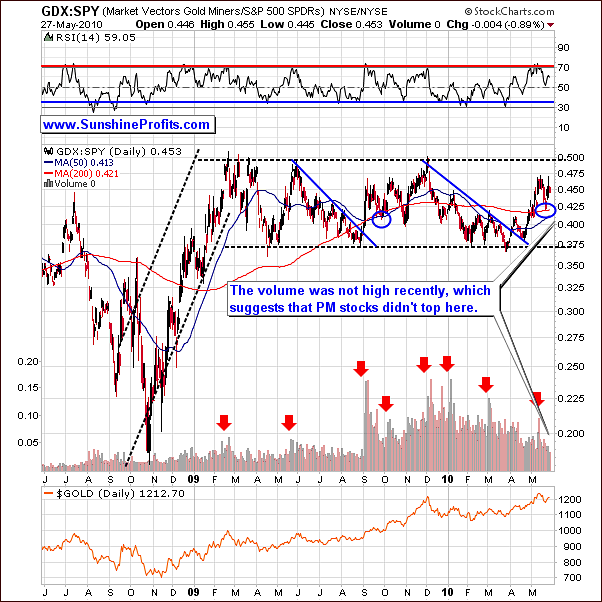
Two weeks ago, in our May 14th, 2010 update we stated:
The GDX/SPY ratio often forms tops and bottoms along with PMs and PM stocks. Therefore, what's bearish for the ratio is partly bearish for the whole PM market. As we have mentioned in the previous updates, tops are often accompanied by a huge volume, and they take place when the RSI is right at the 70 level.
In short, the GDX/SPY explains PM performance relative to other stocks. If the value of this ratio is high, the general indication is for a local top in PM stocks. With the recent low volume we have discussed at length in this update, the GDX/SPY does not suggest at top right now.
The last but not the least chart this week is the popular silver:gold ratio.
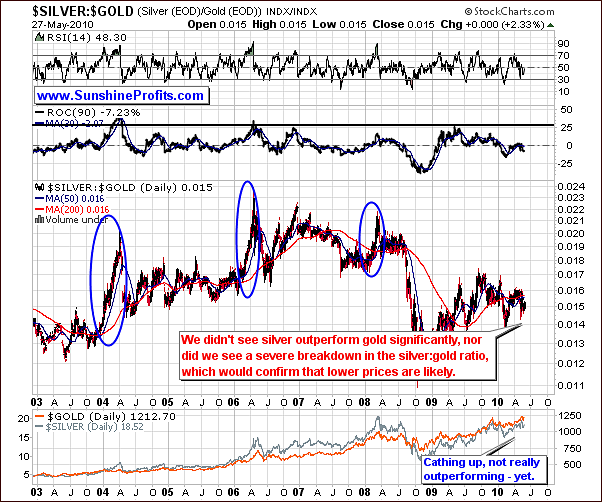
The silver/gold ratio has similar implication to the GDX/SPY ratio. Normally, silver has outperformed gold when close to major tops. We have not seen this recently. The ROC (Rate of Change) indicator also supports this premise.
An additional way to read this chart would be to look for a severe breakdown - like the one we've seen in 2008. As of now, we have not seen large decreased movement or a huge decline in the ratio. Therefore, a bearish sentiment for PMs has not yet been confirmed.
Summing up, signals coming from the analysis of Gold Miners Bullish Percent Index, PM stocks' outperformance relative to other stocks, and the silver:gold ratio don't suggest lower PM prices soon.
Other Information
One of the questions that we've received this week was about options. Is hedging using options better than just selling one's position in the underlying asset (for example PM stocks). The answer is that yes, in many cases, using options to hedge your position instead of simply selling your holdings might be a good way to go. In fact, we have dedicated a whole section to the features that options provide to PM investors in our Key Principles section. One of the benefits here would be that options have time-value, which decreases over time. It's counterintuitive, as the time-decay causes options to lose value, but we really think that it may prove profitable for some investors. The reality is that when people get out of the market, they sometimes fail to get back in at lower prices, as they start feeling the same emotions as other market participants. The prevailing emotion after a sell-off is fear, which prevents people from reinvesting in the shares they have just sold. After shares start to rally, people wait for a pullback, which either doesn't come or even if it does, it doesn't seem to be deep enough to make them purchase their favorite PM stocks. Finally people often get back into the market at prices higher than those at which they sold their shares in the first place. Since options have a "time limit", it means that you will get back your exposure to rising gold and silver prices rather sooner than later. Although this theory is questionable, we view this feature of put options as highly practical.
Another letter that we've received this week included a question about how would gold react if governments finally reduced their spending. In our view it is highly unlikely that governments would adopt such a restrictive policy at this point. The obligations that need to be paid for instance to finance healthcare are simply too big for any serious restrictions to be sustainable. Besides, political consequences of cutting the expenses are huge - it's much easier to just inflate the debt and blame everyone else for the state of the economy. This is what we see right now, and this is what we see as the most probable outcome in the future and rising gold prices suggest that the market agrees with us. We will get back to this topic if governments indeed decide to enforce a restrictive fiscal policy.
On an administrative note, the next Premium Update will be posted a few days after our regular schedule - on Tuesday, June 8th, 2010, as your Editor is going to take the CFA exam next week (keep your fingers crossed.) Of course, if something urgent happens, we will let you know via Market Alert.
Summary
The USD appears ready to decline and the general stock market is likely to rally, and the PM market is likely to move higher as well. Reliable indicators this week have consistently supported these views.
The general stock market and the PM sector have closely followed each other of late and for the short-term the suggestion is that the PM rally will continue.
Whereas low volume levels of late have been a concern, close monitoring of any significant changes will allow us to notify Subscribers in a timely manner with a Market Alert or in the weekly premium update. For now, we remain cautiously bullish for the PM market.
This completes this week's Premium Update.
Thank you for using the Premium Service. Have a great weekend and profitable week!
Sincerely,
Przemyslaw Radomski

