
We don’t know if you have been following Harold E. Camping’s, the California radio “Rapture guy”, who had told his followers that the world will end on May 21, 2011, which is a day after we posted our Premium Update. We thought it was going to be our last issue, but it seems that instead of being cancelled the universe was picked up for another season. The preacher who predicted the Apocalypse on this particular date now predicts that the world will end in October. We guess he’s trying to say, “Have a great summer.”
Will it be a great summer for precious metals?
We’re off to a great start with the unanimous agreement this week by the European Parliament’s Committee on Economic and Monetary Affairs (ECON) to allow central counterparties to accept gold as collateral. This is yet another act of recognition of gold’s growing relevance as a high quality liquid asset. Market demand for gold to be used as a high quality liquid asset and as collateral has been building for some time. In late 2010, ICE Clear Europe, a leading European derivatives clearing house, became the first clearing house in Europe to accept gold as collateral. In February 2011, JP Morgan became the first bank to accept gold bullion as collateral via its tri-party collateral management arm. Exchanges across the world, such as Chicago Mercantile Exchange, are now accepting gold as collateral for certain trades and London-based clearing house LCH Clearnet has said that it also plans to start accepting gold as collateral later this year.
We suppose that Europeans have noticed that Greece has 111.5 tons of gold, Portugal has 382.5 tons, Spain has 281.6 tons and Italy is top dog with 2,451.8 tons. That’s a lot of collateral.
The euro zone problems keep impacting the price of gold positively. It seems that if Greece thought all its troubles were over with the coming of the Apocalypse, it seems that for now it will have to deal with its problems after all. Greece doesn’t have any good options. Financial markets are jittery at the prospect of a Greek default since European banks are highly leveraged. They are not in a strong position to withstand losses on their large portfolios of European government securities if, as seems likely, Greek problems cause a fall in the market price of Spanish, Italian, Belgian, or other euro zone sovereign debt. The PIIGS were able to borrow so much relative to the size of their economies because creditors believed their debt was safe. A restructuring of Greek debt will cause big losses to French, German and other banks, not to mention the havoc caused to the entire euro zone and, in turn, to the global economy.
To postpone the pain, the euro zone might decide to kick the proverbial can down the road and provide Greece with additional financing. The European Central Bank has been vehemently opposing any measures to restructure Greece’s debts, such as the country paying back less than it owes or delaying its payments. But at the same time there is growing political opposition to new loans to Greece in several northern Eurozone countries. European leaders see the privatization plan as the best hope of staving off default. The privatization plan was detailed by the Greek government for the first time this Monday and has become a central issue in Europe-wide deliberations over how to overhaul Greek’s bailout program.
For the past year Greece has relied on a €110 billion package of bailout loans from other EU countries and the International Monetary Fund. In return, it has been implementing austerity measures, but has slipped on its targets. European leaders are pushing to impose measures that would ensure the Greek government lives up to its promise to deliver $70 billion in privatization proceeds. The European Central Bank is for now sticking to its line that tougher austerity programs are the only way out of a quagmire that will see the country’s debt jump to almost 158 percent of gross domestic product this year. Greece’s budget shortfall may average 9.5 percent of GDP this year, the European Commission says. That’s the second-largest gap after Ireland.
Gold hit a three-week high on Wednesday, boosted by concern over the debt crisis in euro zone countries and as June options expire in the COMEX futures market. Our unique True Seasonals tool confirmed the effect of the options expiration in the last Premium Update when we wrote that a short-term rally was likely. One of the functions of True Seasonals is to identify price levels and the risk on the dates of the expiration of derivatives. We designed this function to provide substantial evidence whether or not the expiration of derivatives influences the prices of precious metals. True Seasonals is one of the most comprehensive tools based on seasonal influence and the first one to include the impact of futures and options, making it the best instrument to analyze recurring price changes.
We recently saw an interesting item comparing the value of gold in 1971, which is when the gold standard was abandoned, and now. In 1971 you needed 66 ounces of gold to buy a compact car. Now, you can leave 56 ounces locked up in the vault and use only 10 ounces...
To see if we should be in rapture over the prices of precious metals, let’s turn to this week's technical part with the analysis of the Euro Index. We will start with the long-term chart (charts courtesy by http://stockcharts.com.)
Euro - USD Indices
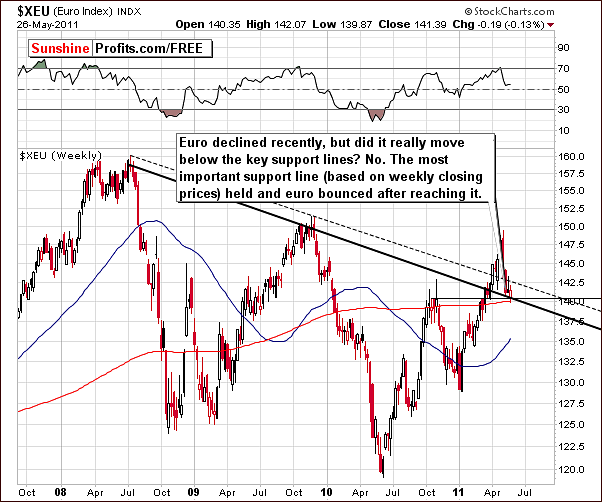
In the long-term Euro Index chart this week, we see a number of profound implications which will impact the rest of this week’s Premium Update. The index levels moved below late 2010 highs if you decide on measuring highs in terms of intra-day highs or even daily closing prices. The strongest support, though, is provided by weekly closing prices, taking this approach provides us with a bullish view on the situation as the euro did not break its previous high.
Moreover, Thursday’s closing level was above declining support line based on weekly closing prices. This support line (thick line) is more important in the case of bigger moves than are the lines based on intra-day highs and lows (thin, dashed line).
We have often discussed how the movement of index level values for both the euro and the dollar mirror each other in a fairly precise manner most of the time. This is mainly due to the Euro being the largest component of the USD Index. The currency markets have a great deal of influence on stocks and precious metals alike, so what happens in these markets must be a regular part of any meaningful analysis of trends across the precious metals sector.
So with the euro apparently bouncing off the support line, let’s continue with analysis of the USD Index to see if the same can be seen (as expected) with respect to a resistance line.
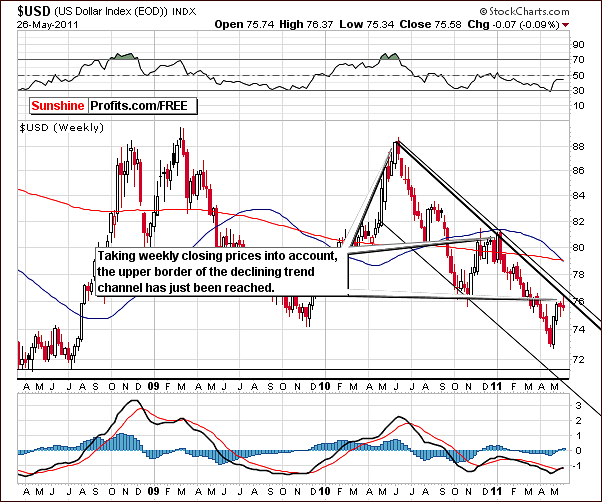
In the long-term USD Index chart, the upper border of the declining trend channel based on – again - weekly closing prices has been reached. This is the heavy dark line in our chart and is providing resistance at this time. This is, of course, not surprising in view of what we saw in our prior chart of the Euro Index.
What this means is that the dollar is likely to move lower once again. This is good news for precious metals as gold, silver, and gold and silver mining stocks are all likely to move higher in the event of a downturn in the dollar.
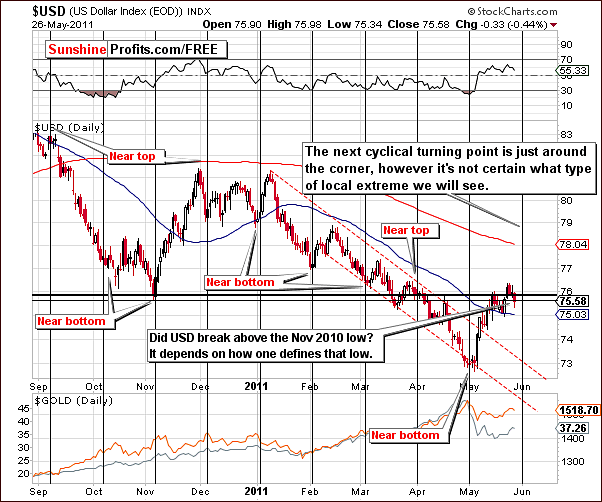
In this week’s short-term USD Index chart, a number of confusing points come to light. First is the question concerning a breakout or a breakdown - which of the two are we seeing today? The answer depends upon our definition of the November 2010 bottom.
If daily closing prices are used, then the breakout has not been confirmed at this point. However, if we choose to base last year’s November low on intra-day lows, the breakout appears to be in. Due to this confusion, we feel it best to state that it does not appear that the breakout has been confirmed. This is especially true when taking the long-term chart into consideration.
The next cyclical turning point for the USD Index is expected in early June. This means that the current trend could very well reverse in a week or so, but it could mean that a decline will be seen in the following days and a rally will materialize soon after that. Naturally, that would imply that the coming decline in the dollar would be short-lived – so the question is if it could be really meaningful and worth taking into account at all. We believe that the answer is yes – please note that half of the dollar’s May rally materialized in just two trading days. It is important to keep in mind that the same could happen to the downside in a similar rapid move.
Summing up, the short-term situation remains bullish for the Euro Index and bearish for the USD Index.
General Stock Market
We have expanded our analysis of the general stock market this week because it has received much attention recently. Although stocks are not our primary area of analysis, we have received many questions this week concerning equities. We therefore have included four charts this week to allow us to completely analyze their influences upon gold, silver, and gold and silver mining stocks.
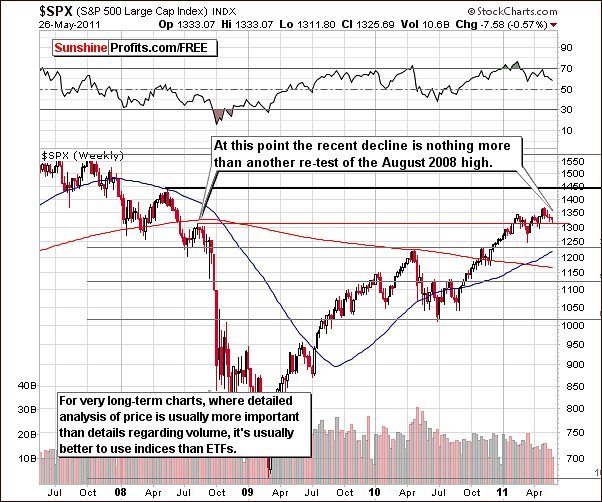
In the long-term general stock market chart this week, we have seen a miniscule decline. This does not seem to be anything more than a further verification of the breakout above the August 2008 highs. It seems likely that this level could indeed provide support and a bounce to the upside may soon be seen for stocks.
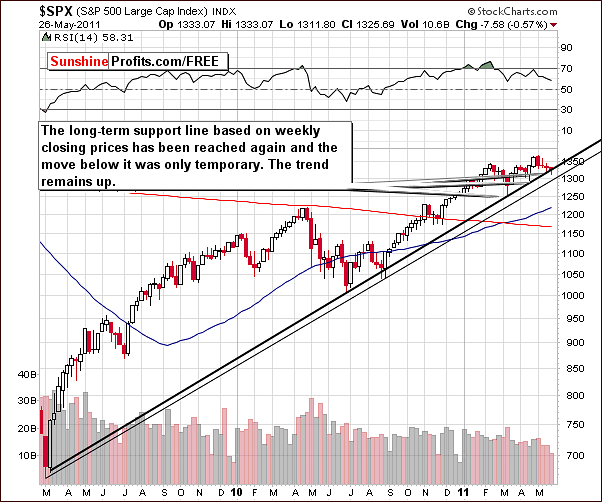
In the medium-term chart this week, the recent small decline appears to be another move to the support line rather than a breakdown. The move below the rising support line was only temporary and stocks reversed their directions soon after that. Consequently, the trend remains up.
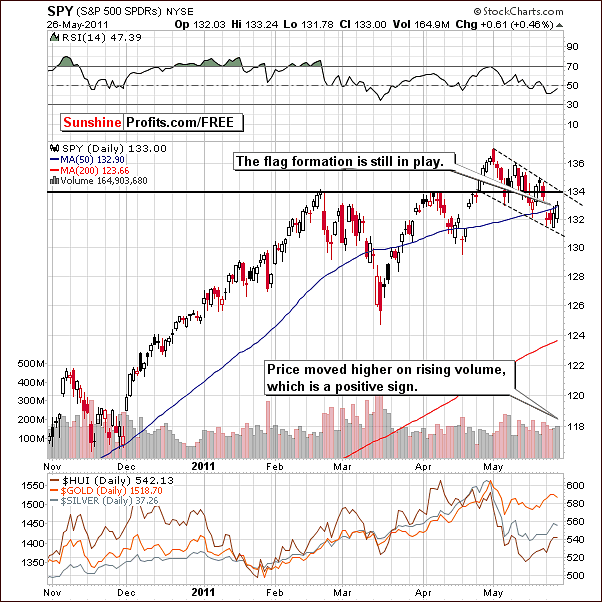
In this week’s short-term chart, we see that the flag pattern is still in play and has not been invalidated. The recent move higher has been confirmed by higher volume and this is a bullish sign. The next challenge for the general stock market is to move to the top of this short-term trading channel (flag) and then to break out above it.
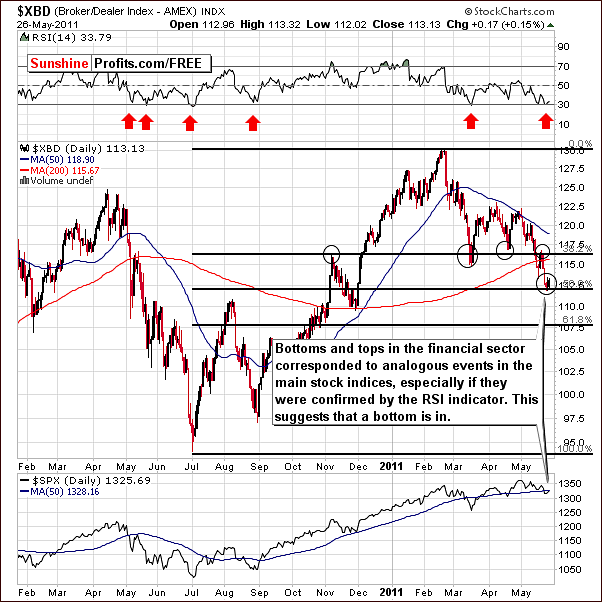
This week we have included a chart featuring the XBD Broker -Dealer Index which is a proxy for the financial sector. We can see that the financials have been underperforming stocks in recent months. Normally this is bad news for the general stock market. The key point here, however, is the relationship between the financials and all other stocks.
Simply put, the divergence between the two is not a short-term trading signal. It merely suggests that there is likely to be a turnaround in the general stock market, but we must keep in mind that this signal is not precise – it could easily take one to two months to materialize if it’s not confirmed by any other signal. It seems best to treat this signal as a yellow warning flag of caution which indicates that, at some point, stocks will top out and the subsequent decline could be significant.
Other factors to keep in mind when analyzing the financials are that they have been reliable in the past and may indicate a short-term bullish trend for stocks if we take short-term tops and bottoms into account. Often when financials reach their support level and a buy signal is confirmed by their RSI level, a local bottom may very well be seen in the general stock market. This appears to be the case now and stocks appear to be at or close to a local bottom at this time.
This is consistent with general seasonal trends of the past which show stocks frequently rally into the first week of June and then decline. It seems, therefore, that the general stock market will likely move higher for the next week.
Target levels are not very clear at this time but it seems that SPY ETF prices could rise to $137. We will continue to monitor this situation and report to you accordingly. The first sign to watch for is a breakout above the flag pattern at which time more accurate target levels can then be discussed.
Summing up, the sentiment remains bullish for stocks in the short term. The term may be no more than a week however. Analysis of several factors and various charts does indicate that a correction within the coming month is quite likely.
Correlation Matrix
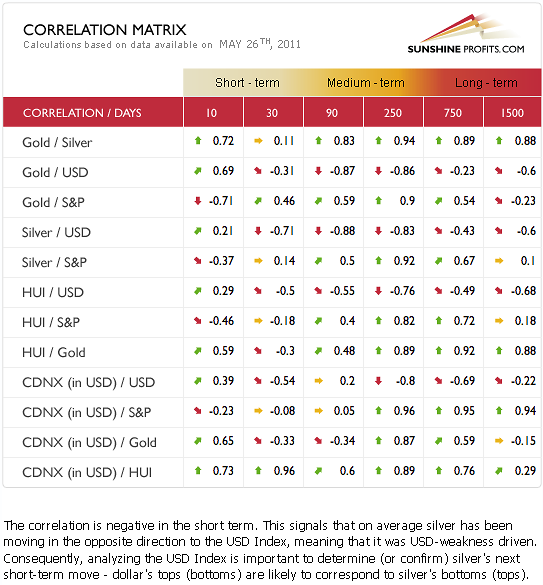
In this week’s Correlation Matrix, we can see that the factors discussed above point to a bullish outlook for precious metals overall. Let’s focus for a moment on the short-term, 10-day column. The coefficients this week are “upside down”, that is, they have reversed their signs from prior weeks. Whereas gold and the USD Index were negatively correlated, their relationship is now positive. Gold and the general stock market have now become negatively correlated after moving together in prior weeks. These changes also are seen for silver and gold and silver mining stocks as well.
This is a numerical representation of the fact that the precious metals generally have moved higher this week even though the signals from the currency markets and the general stock market have not been particularly favorable. The metals moved higher even though the dollar declined only slightly. Stocks also declined slightly compared to last week but gold, silver and gold and silver mining stocks did not follow. This bodes well for the near term overall for the precious metals sector as their immediate-term independence could very well be a sign of strength.
Gold
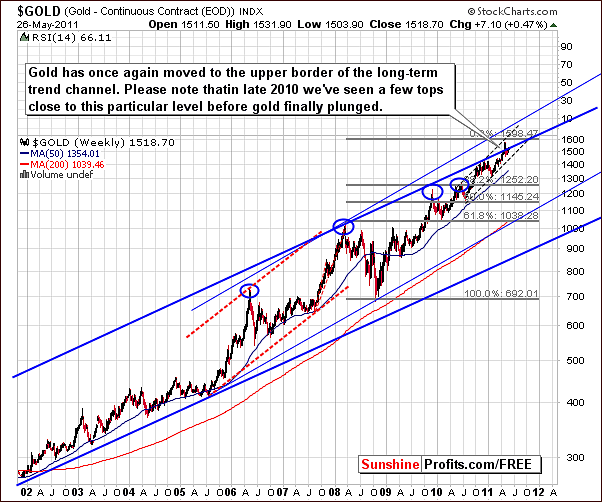
We begin our gold section this week with the very long-term. The overall sentiment for gold is bullish, though perhaps this chart is the least bullish of the three gold charts in this week’s Premium Update.
Here we can see that gold has risen above the upper border of the very long-term resistance line. This line was actually broken temporarily and a similar price action seen late in 2010 leads us to believe that we may see a similar pattern here. At that time, gold moved close to its previous highs and then declined. At this time however, we present this only as a possibility since this chart does not yet provide any signs of this. Overall, the situation in this chart is mixed.
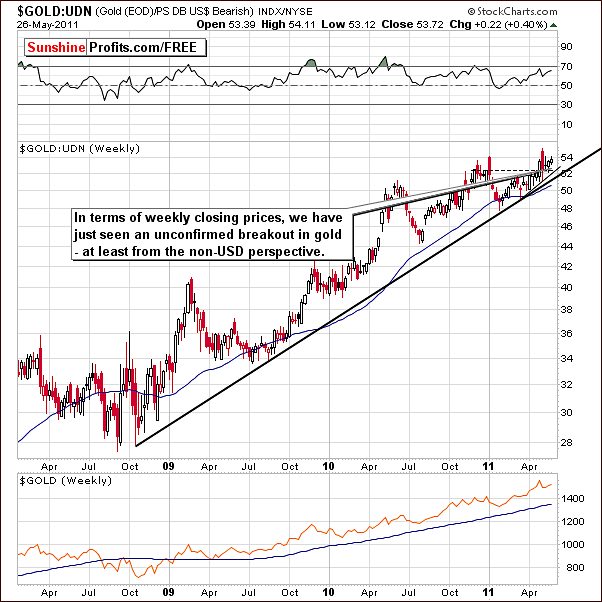
In gold’s long-term chart from a non-USD perspective, we see that the metal has moved above previous highs based on weekly closing prices. This is, of course true as of Thursday’s market close, although the situation could change if index values decline on Friday. It appears more likely however, that the general uptrend this week will continue for at least another day and thus the “above previous highs” statement will hold true.
Note that the non-USD gold values were higher on an intra-day basis prior to Thursday. However, taking a conservative approach implies a breakout and it definitely a bullish factor at this point.
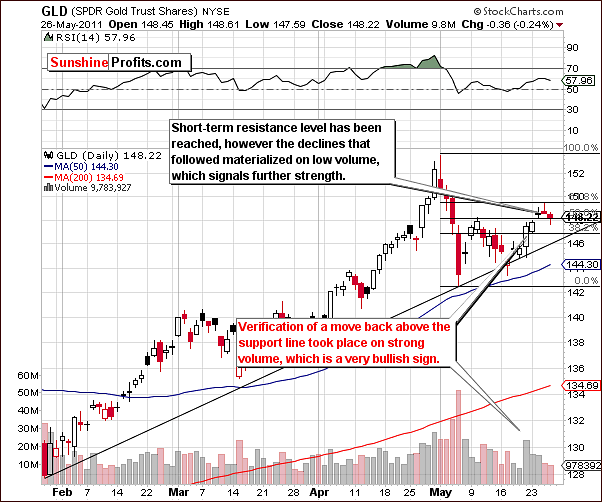
In this week’s short term GLD ETF chart where we analyze volume, recall that in last week’s Premium Update, daily volume levels provided some bullish implications. We discussed how the pattern was somewhat out of the box where volume levels on rising prices were lower than those on price declines. We went on to say that this was not necessarily bearish although technical analysis generally promotes this belief in such situations.
Gold did indeed rally this week and, in fact, volume levels were significant during this move. The past two days did see slight declines on low volume and seems merely to be a pause within the current rally. Higher prices seem to be quite likely from here.
A Fibonacci retracement level has just been touched, so it is not surprising that gold’s rally has paused, and the low volume levels lead us to believe that the short-term trend is still to the upside. The next strong resistance levels will be those of previous tops for both closing and intra-day prices. This leads us to an expected target levels of $152 or higher for the GLD ETF. This corresponds to about a $40 increase for spot gold above Thursday’s closing price level.
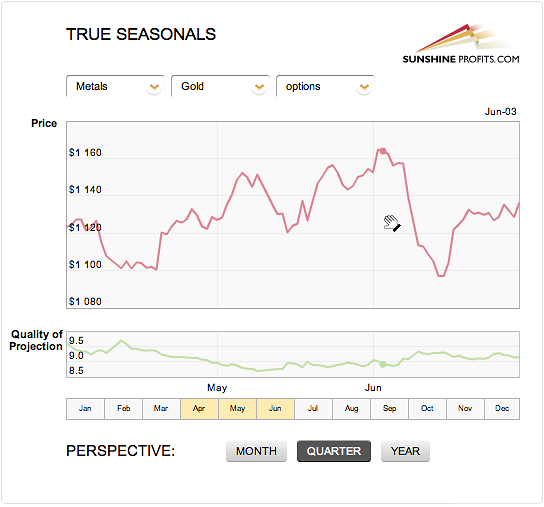
Once again we included a True Seasonals chart. This week we focus on gold options expiration as they seem most appropriate and provide us with a detailed suggestion of what to expect. The end of May usually corresponds to a sharp rally for gold with a top normally reached somewhere around June 3rd. If the seasonal trends of past years continue, it appears that we have one week of contra-trend rally which will then be followed by a continuation of a general downtrend. We will continue to monitor this and report to you accordingly as the situation develops.
Summing up, the situation appears bullish for gold this week. Overall the long-term picture is somewhat mixed. Short-term analysis, however, suggests that higher prices will be seen from here, but we expect the rally to end in a week or so.
Silver
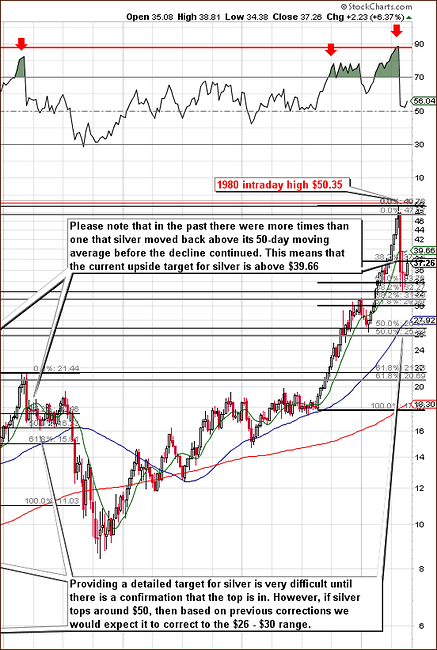
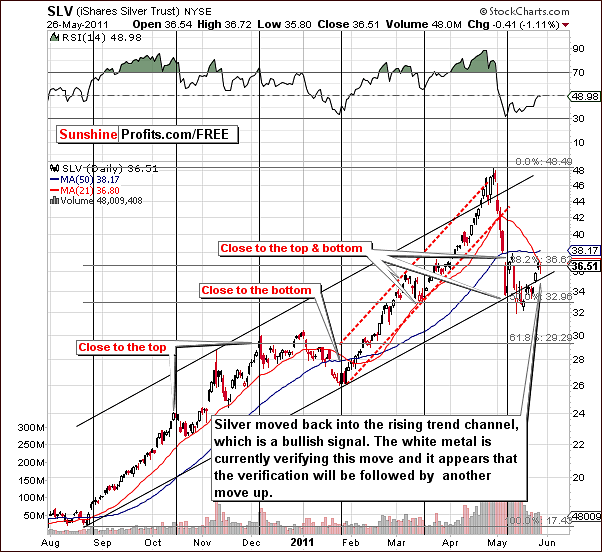
In this week’s very long-term chart for silver, we can see (click on the above chart to enlarge it) that its price has not yet moved above its 50-day moving average. In the past, declines normally have been seen after silver’s price moves above this important resistance-support level. If this pattern holds, a move above the 50-day moving average would be a kind of prerequisite for a price decline. It appears more likely that, in view of this history, the contra-trend rally is not yet over.
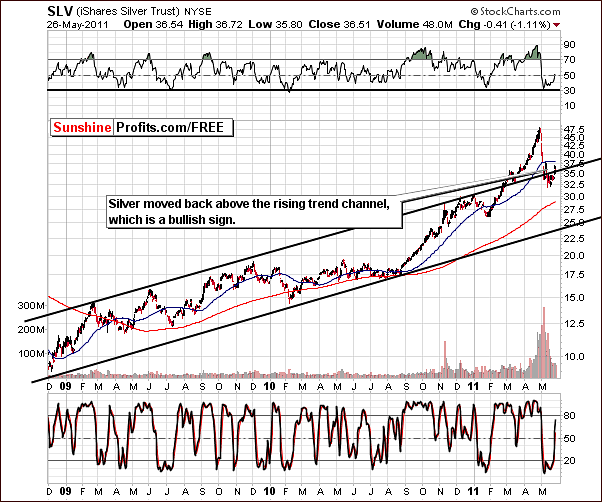
In this week’s medium-term chart for silver, we see that price levels have moved above an important resistance level that had previously served as support. This resistance level is based upon prior year highs for the white metal. The pause that has been seen when prices moved above trend channel could simply mean that silver is gathering strength to rally further.
Last week we wrote the following:
(…) the long-term charts generally carry more weight than those from the short-term.
(…)
In the short-term chart this week, we see a verification of a breakdown below the short-term rising trend channel. Although this short-term chart in and of itself is somewhat bearish, the situation does not really appear to be.
The conclusion was that the situation remained bullish in the short-term as signals coming from the long-term chart analysis were more profound than the one seen on the short-term chart – and this week provided us with a confirmation of this theory.
Namely, in the short-term chart this week, we see additional positive signs as price levels have moved back within the short-term rising trend channel. This is a bullish phenomenon and Thursday’s decline on low volume is not seen as overly bearish. The move back into the trading channel is currently being verified.
Summing up, silver appears to be in a rather bullish period of its own. Combined with a similar development for gold this week, the overall short-term picture is quite bullish indeed for the white metal. As it is the case with gold, we view the current rally as a counter-trend move and that another decline will soon follow.
Gold and Silver Mining Stocks
Once again this week, there were no significant developments visible from the short-term perspective, so we decided to focus on the long term charts.
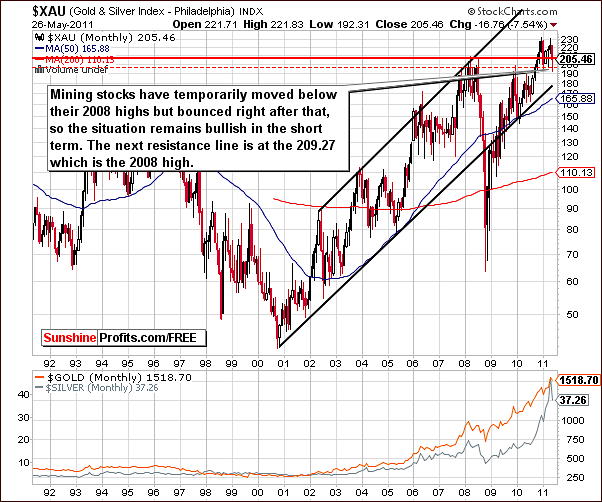
In the very long-term XAU gold and silver mining stocks index chart this week, we see that miners have moved back up close to the highs of 2008. This bounce has taken place from levels of previous 2011 lows.
At this point, it does not appear appropriate to discuss a breakdown below a key support line yet. The theory here is that the move above the support line has not yet been invalidated and the trend appears to remain up until such invalidation.
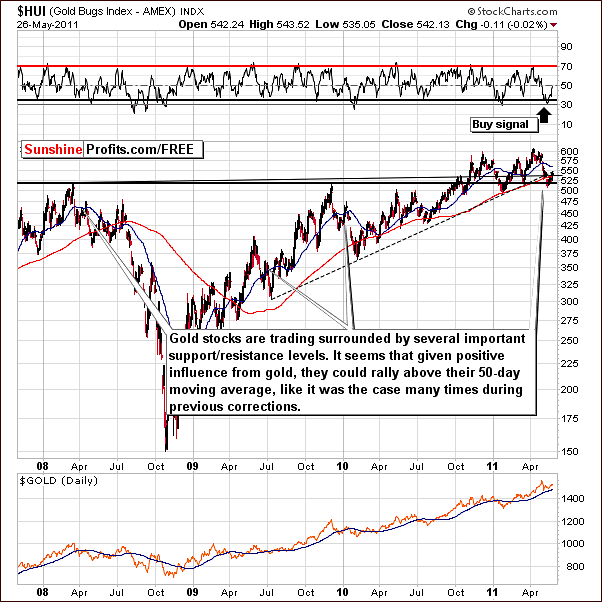
We turn now to the HUI Index chart for confirmation of prior points. Here we see similar patterns as the level of 2008 and 2009 highs has not been broken. RSI levels indicate that a local bottom has been seen and gold stocks are presently struggling to move above the dotted rising support-resistance line and also the slightly rising solid resistance line.
The situation here is similar to what was seen for gold and silver which are also close to resistance levels. If the metals themselves can move higher, gold and silver mining stocks will likely do the same and all the resistance levels currently in play could be broken. If this is to be seen, however, it will likely be within the coming week as the contra-trend rallies appear to be fast approaching a continuation of the eventual declining trends.
The target for the HUI Index is slightly above the 50-day moving average – in the 560 – 570 range.
Summing up, the situation for gold and silver mining stocks in the short term appears to be bullish. It is important at this time to monitor the metals markets for more information as to where the mining stocks will go next.
Letters from Subscribers
We would like to comment on a question we received this week. One of our Subscribers wanted to know when mining stocks will catch up to the price of gold.
If our assumptions about the short-term situation are correct, and we are indeed in the first part of the corrective phase, and this summer we will once again experience the so-called summer doldrums, then it seems that the next attempt for gold stocks to regain their strength will take place in the fall - possibly at the beginning of September.
Naturally, there is no guarantee that they will catch up with gold at that time - our best guess today is that they are not likely to do that before this time.
Please note that all of the above refers to the long term relationship between gold and gold stocks. It’s likely that local rallies and bottoms will be more volatile in the case of gold stocks even before this date.
Summary
This week we have seen a pause in the Euro Index and the USD Index. Support and resistance lines have not been broken and it appears unlikely that this will be seen in the following days. The trend therefore remains up for the euro and down for the dollar. Meanwhile, the general stock market appears to be close to or at a local bottom.
Both of the above points are positive news for the precious metals sector. Gold, silver and gold and silver mining stocks moved higher without support from either the currency markets or from stocks. We view this as a sign of strength for the precious metals and the price/volume signals, especially for gold, indicate a short-term rally from here is likely. This rally may complete within one week or so and be followed by a period of declines which could be significant.
Precise contra-trend rally target levels are a tough call at this time. Our best estimate seems to be approximately $40 rise in gold’s price (to $1,560), silver moving close to the $40 level and gold stocks moving above their 50-day moving average, perhaps to an HUI Index level close to 570. We will continue to monitor this and report to you accordingly.
Our next Premium Update is scheduled a day early, on Thursday, June 2, 2011. This is to allow your Editor to travel out of town to complete his Level II CFA exam on June 4th.
This completes this week's Premium Update.
Thank you for using the Premium Service. Have a great weekend and profitable week!
Sincerely,
Przemyslaw Radomski

