- Euro & USD Indices
- General Stock Market
- Correlation Matrix
- Gold
- Silver
- Mining Stocks
- Letters from Subscribers
- How to buy the gold, silver and the mining stocks with the stop loss
- Are miners worth more even though metals are lower?
- Gold does not produce income so does the Crude
- Gold as a long term investment. Retirement portfolio.
- Selling gold and buying platinum
- Currency wars and interest rates
- The result of a sudden general market plunge
- Summary
There were some interesting bits of news since we posted our previous Premium Update, a variety of dots of information. We’ll try to connect them.
- The U.S. Mint has resumed selling its 2013 American Eagle One-Tenth Ounce Gold Proof Coin at a hefty $195 per coin as of last week. The Mint has set a 20,000-coin production limit for the coin. Sales of its smallest gold coin was suspended by the Mint in late April as year-to-date demand had increased by more than 118% until inventories could be replenished.
- Here are some interesting statistics. So far at close to the half-way point of the year, the U.S. mint has sold more one-tenth ounce gold coins than it did in all of 2012. About 50,000 such coins have been sold thus far for this month, with a total of 350,000 sold so far this year. This compares to total sales of 315,000 such coins sold for the entire year of 2012. The U.S. Mint will continue to limit purchases of the American Eagle one-ounce silver coins. Sales were suspended earlier this year due to record-breaking demand.
- Reuters reported Wednesday that the appetite for U.S. American Eagle gold and silver bullion coins is still at unprecedentedly high levels almost two months after the historic sell-off in gold. The U.S. Mint’s acting director told Reuters that the mint is buying all the coin blanks they can get their hands on to fulfill the pent up demand for gold coins unleashed by the decline in price.
- Premiums for physical gold in Singapore touched new highs last week as supplies proved hard to acquire, even as premiums in other Asian countries eased after gold prices bounced off two-year lows seen in April. Dealers in Singapore, a center for bullion trading in Southeast Asia, were quoting up to $7 an ounce over spot London prices for gold kilogram bars, versus $5 last week.
- Gold demand in India, the world’s largest buyer, is heading for a quarterly record as imports reach 300 to 400 metric tons, the World Gold Council said in a report last week. Again, we’re only getting close to the mid-way point of the year and the amount quoted by the WGC is equal to almost half of the total shipments for all of last year. We read that banks are actually being told to discourage gold investment and suggest financial products instead. Interesting isn’t it? We find it particularly interesting in two aspects: one, you want something to decline in price to buy more for yourself (should you trust the buyers of gold – the official sector – when they tell you not to buy gold?), and secondly this is against the most important ethics principle (ok, there is no ranking in these principles, but we think this one deserves a great deal of attention) – that client’s interest always comes first (by the way, have you noticed that we never accepted advertisements on the website? That’s because it could taint our objectivity if ads come from mining companies or sellers of gold) and making investment suggestions in order to fulfill other goals is unacceptable. If you want to “stimulate” the economy by buying financial shares, go ahead and buy them with your own money, don’t force others to do it. Some might call that “soft socialism”.
- According to the IMF, Russia, Turkey, Kazakhstan and Azerbaijan expanded their gold reserves for a seventh straight month in April, buying bullion to diversify foreign exchange reserves due to concerns about the dollar and the euro. Russia’s steady increase in its gold reserves saw its holdings, the seventh-largest by country, climb another 8.4 metric tons to 990 tons, taking gains this year to 3.4% after expanding by 8.5% in 2012, International Monetary Fund data show. Turkey’s holdings rose 18.2 tons to 427.1 tons in April, increasing for a 10th month as it accepted gold in its reserve requirements from commercial banks.
And now to connect the dots--what we are seeing is a phenomenon of consumers across Asia, and in particular from China and India, viewing the recent gold price collapse as a great buying opportunity. Indian demand for gold is up 200% from a year ago. It looks like Indian, Chinese and Middle Eastern consumers who are taking a long-term view on the prospects for gold. Taken together, China and India account for more than half of total consumer bullion demand worldwide. The long term trend for central banks to increase gold reserves remains intact and will support the gold price. Central banks bought 534.6 tons of gold last year, the most since 1964, and may add as much as 550 tons in 2013, the World Gold Council estimates.
Here is another dot of information, although we’re not sure what to make of it. It seems that gold and wine prices that tracked each other in the past decade amid demand for alternative assets are now diverging. The Liv-ex Fine Wine 100 Index (LIVX100) tripled in the past 10 years while at the same time gold advanced fourfold. The wine gauge rose 5.9 percent this year but bullion slid 17 percent.
The wine market is miniscule. The Liv-ex measure represents 100 of the most sought-after fine wines that have a strong secondary market, according to the website of the London-based Liv-ex. The global trade in fine wine, 10 percent of it transacted through auctions, is valued at about $4 billion annually. Just as a comparison, an average $34.7 billion of gold was traded daily through the London market just in March.
The Liv-ex Fine Wine 100 Index fell almost 15 percent in 2011 and 8.9 percent last year before rallying since the start of January. The nice thing about owning expensive wine as an investment is that in the worst case scenario you can always drink it (a very specific type of hedging, indeed).
And speaking of the connection between wine and gold, the Bonham’s auction house sold the entire Champagne Lanson Bonnet Vineyard Collection of $20 Gold Coins early this week during its June 2013 auction of Rare Coins and Medals in Los Angeles. The coins, sold for $945,000, were discovered by chance last year when several of the coins rained down on a worker remodeling a former grape-drying facility. The collection features 497 gold US coins minted between 1851 and 1928. The coins have been untouched for nearly a century and most are in mint condition. It is unknown how the coins found their way to the attic in the eastern village of Les Riceys, France. And now for the happy end, the worker will get half the proceeds. And there is a lesson to be learned here. If you’re going to stash gold coins somewhere, make sure that you somehow let someone you trust in your family know about it if you don’t want the treasure going to strangers in the future.
And speaking of treasure, we couldn’t resist bringing you this intriguing tidbit. An Englishman bought a cheap metal detector and just 20 minutes into his treasure hunt in a forest in Hertfordshire, he uncovered a hoard of 159 Roman gold coins worth about $150,000. That’s what we call beginner’s luck. According to the story in the London Mail, the coins will be sent to the British Museum for a formal valuation before they go up for auction with the proceeds to be split between the man who found them and the owner of the land.
Let’s take out our own metal detector and begin this week's technical part with the analysis of the U.S. Dollar. Let's start with the short-term USD Index chart (charts courtesy by http://stockcharts.com).
USD and Euro Indices
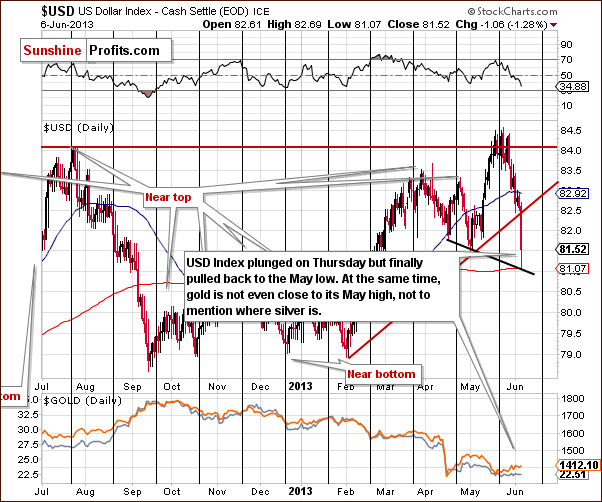
We begin with the short-term USD Index chart which is clearly our most important chart this week. The reason for this is the price action seen on Thursday when the index declined sharply, pulling back a bit before the session closed to end the day very close to the level of the May low. In fact, it is possible that we have seen the final bottom for this correction. The breakdown which we see here below the rising support line was so dramatic that it just might be the decline that the breakdown was supposed to generate.
The most important and interesting implications are seen when we look at the reaction of the precious metals to Thursday’s decline in USD Index. Specifically, it is the lack of reaction in these markets that is most striking, even though the dollar index declined by about 1.5 index point and closed the day about 1 point lower. A huge rally in gold, silver, and the precious metals mining stocks would normally accompany such a significant move in the USD Index (say, a $30 - $50 rally in gold), but barely any move to the upside was seen. This is a very bearish indication for the precious metals sector.
Today’s Premium Update will revolve mostly about the above phenomenon, as it is so important in our view. We will take a look at it from different angles.
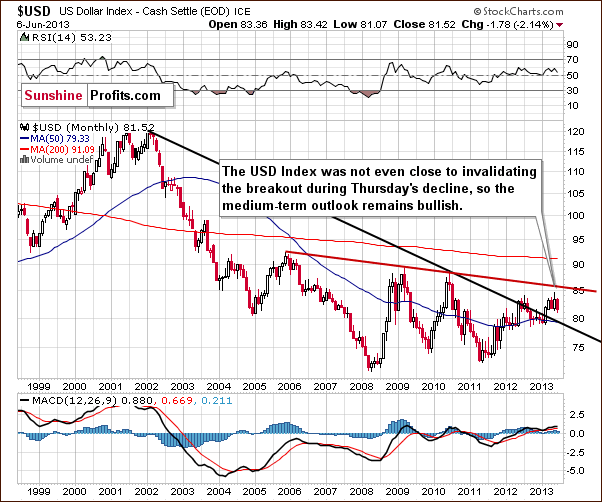
In this week’s long-term USD Index chart, what happened on Thursday really has very little impact in this perspective. The index is still above the declining support line and the bullish medium-term outlook has not been invalidated here. We discussed the underperformance of the precious metals relative to the USD Index several times this week beginning in Monday’s Market Alert:
“… gold is responding strongly to the dollar's rallies but responds less significantly to its declines. This is a bearish situation as it means that gold would likely decline even if the USD was just trading sideways.”
This underperformance (responding less significantly to declines) was clearly taken to the extreme on Thursday.
Since the situation remains bullish for the USD Index, it should theoretically remain bearish for the Euro Index. Does it? Let’s take a look.
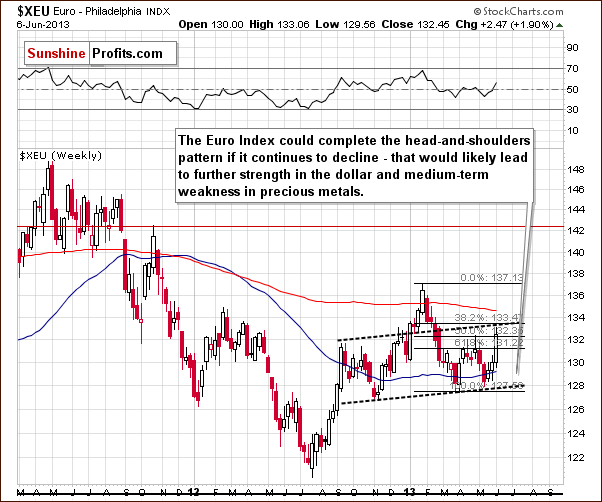
In the short-term Euro Index chart, recall that we have had a head-and-shoulders pattern underway and not yet completed. The question now is “Was this pattern invalided on Thursday with the decline in the USD Index and the move to the upside which was seen here?” Quite simply the answer is no. The move higher did not take the index above the final Fibonacci retracement level. Drawing parallel lines based on the local bottoms, we see that the upper line has not been reached and it emphasizes that the shape of the head-and-shoulders is still intact.
The index level is not too high above the last shoulder as the formation is skewed. This is due to both higher lows and higher highs. The last shoulder (September-October) has a double top pattern so it’s really not so striking that the right shoulder just formed a second top. All-in-all, this pattern could still be completed and if it is, it will have bearish implications for the euro and the precious metals and bullish implications for the dollar.
Summing up, the most important development in the currency markets was the heavy decline of the USD Index on Thursday and the striking lack of reaction in the precious metals sector. The implications are bearish for gold, silver and the precious metals mining stocks.
General Stock Market
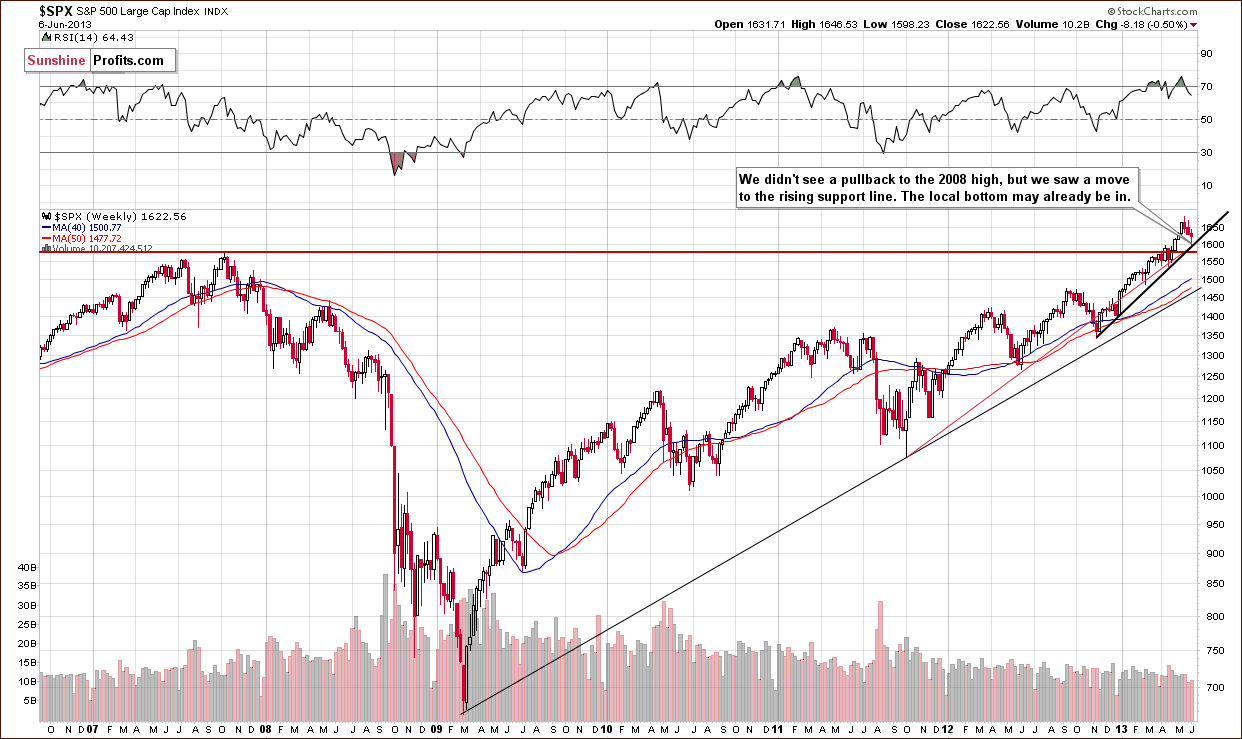
Turning now to the long-term S&P 500 Index chart, what we see here is pretty self-explanatory. The bottom for the latest decline may be in because, although stocks did not decline to the level of the 2007 highs, price levels bounced off the intersection of two support lines. This could mean that the bottom may be in anyway.
Gold and Silver Correlations
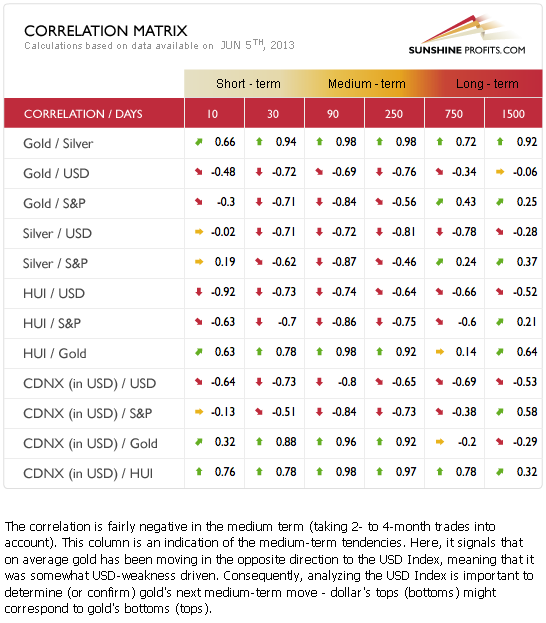
The Correlation Matrix is a tool which we have developed to analyze the impact of the currency markets and the general stock market upon the precious metals sector, (namely: gold correlations and silver correlations). Very little has changed in the past two weeks and gold is still anti-asset. The yellow metal is negatively correlated with both the USD Index and the general stock market. The medium-term outlook continues to be bearish for gold and the precious metals sector, as the medium-term outlook for the dollar index and the stock market remain positive even though they moved lower this week.
Gold
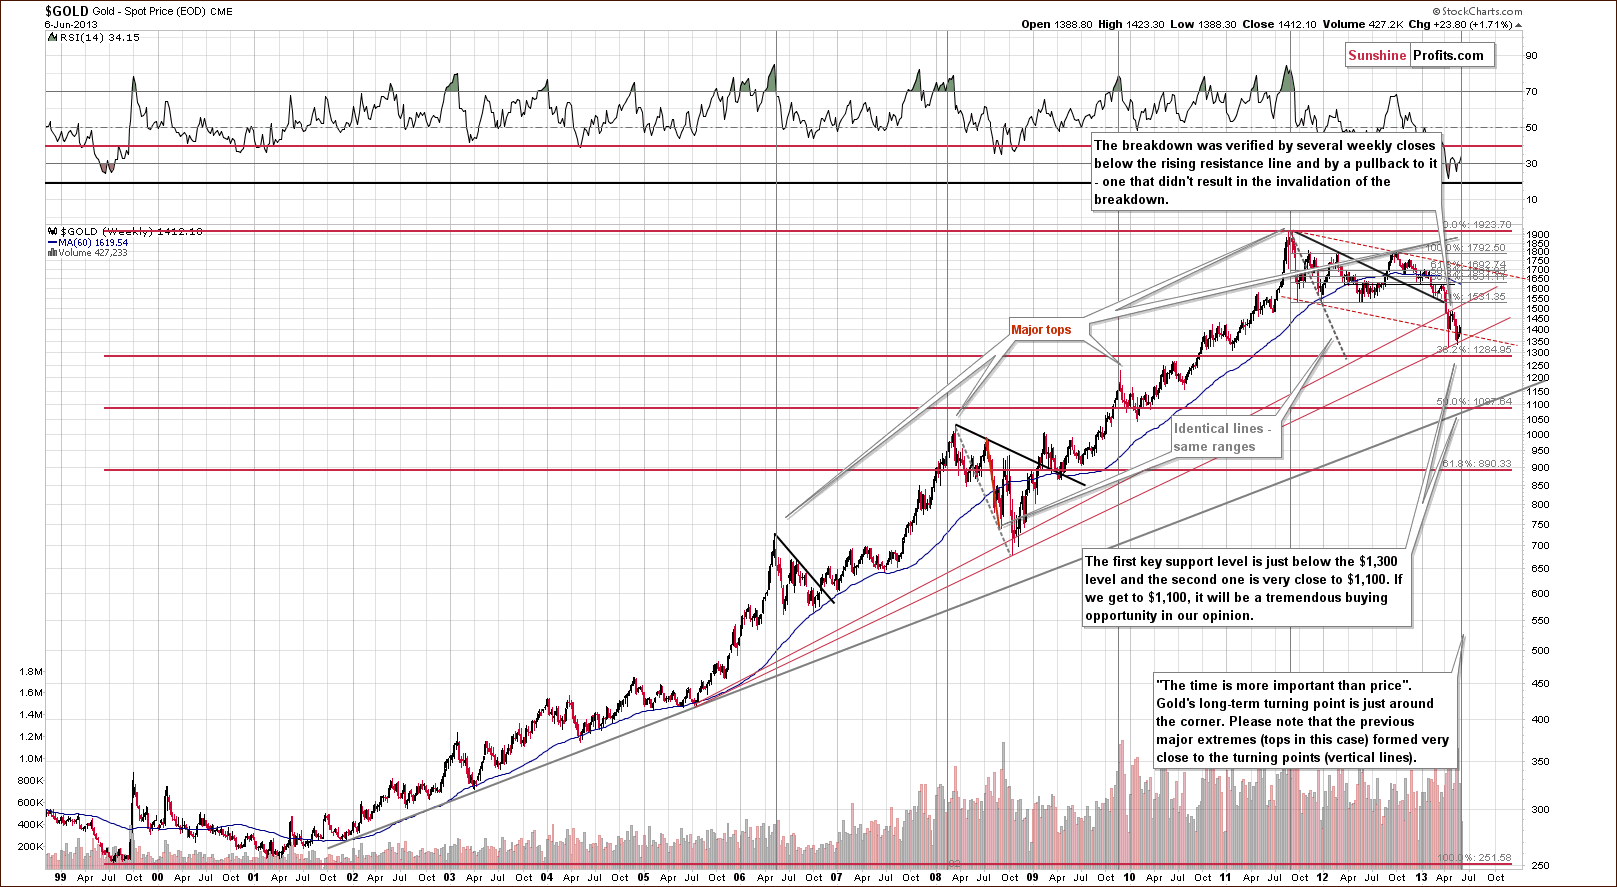
In this week’s very long-term gold chart, we see that gold has rallied a bit more than $20 this week, really not much of a rally at all. The outlook continues to be bearish and the trend remains down. Gold could still decline heavily based on the long-term cyclical turning point, which is due approximately next week. In both 2008 and 2009, local tops formed slightly after the cyclical turning point, so it is possible that the reversal in the downtrend won’t be seen until after the cyclical turning point once again, leaving a number of days in which further declines could be seen.
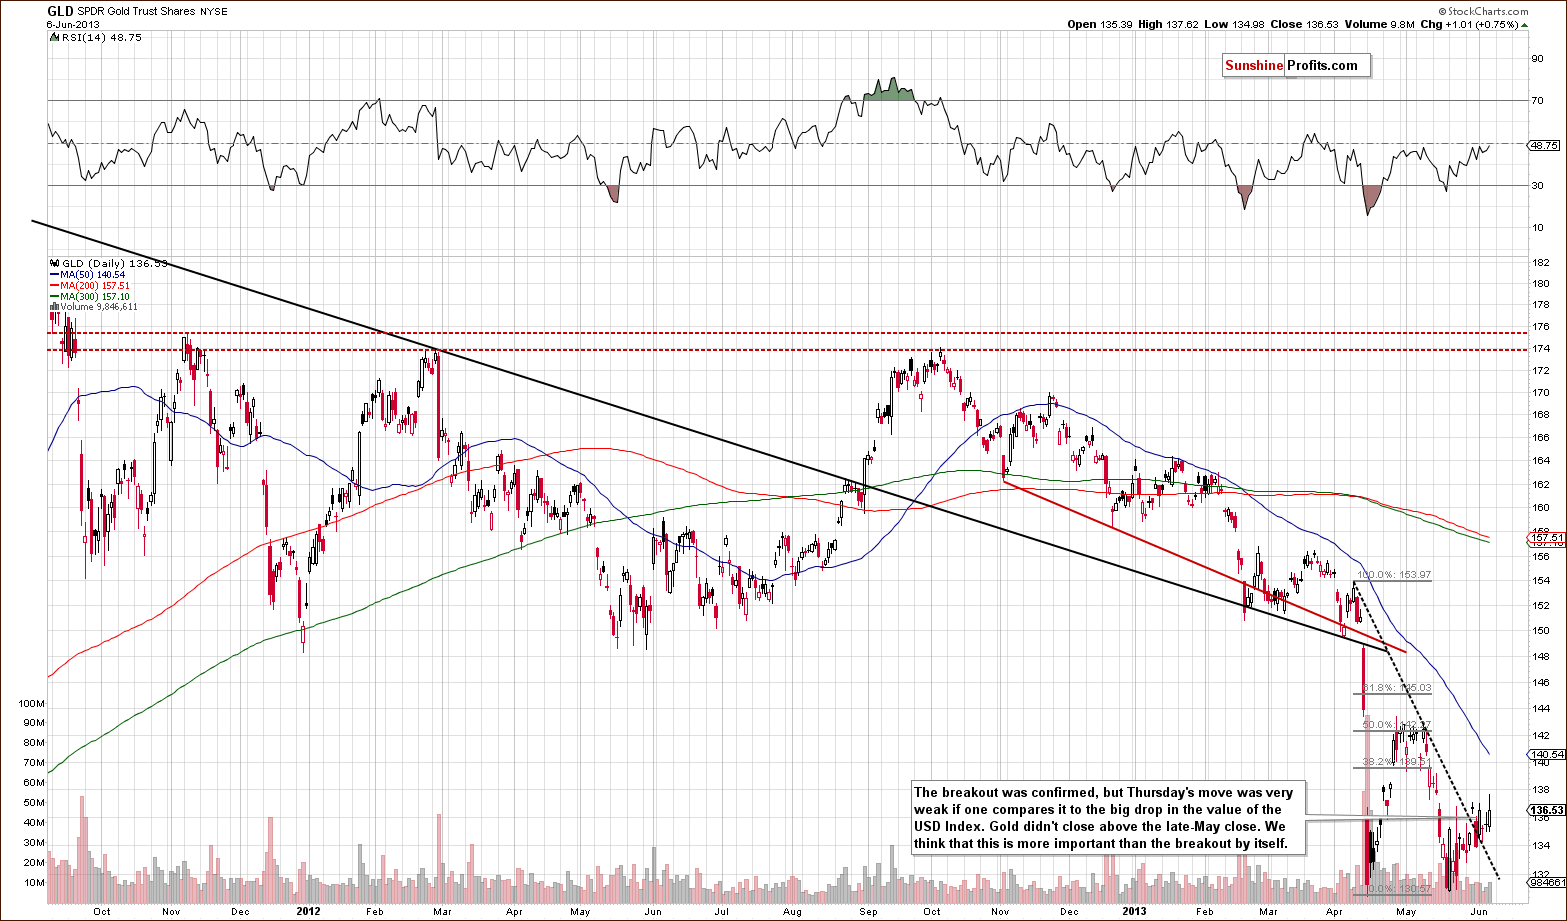
In this week’s medium-term GLD ETF chart, a short-term breakout in gold prices is seen, which by itself would be a bullish factor. We do not look at it this way, however, precisely because of what happened on Thursday. The point is this: very little happened when a lot was expected based on what was seen in the USD Index. The full index point decline coincided with gold’s price barely moving higher and the GLD ETF closing slightly below its late May high. These are clearly strong signs of gold’s current weakness.
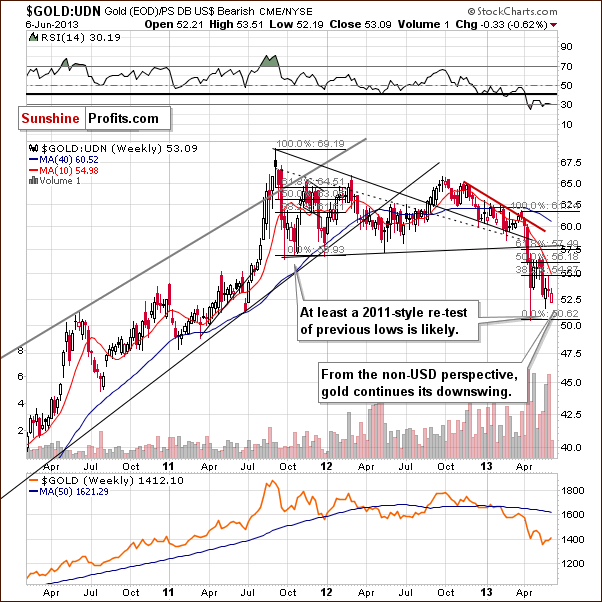
In this week’s chart of gold from the non-USD perspective, we see that declines in gold’s price continue as in this perspective. Although gold’s price did move about $20 (USD) higher, declines were seen in other currencies. This is due to the underperformance of the USD Index. Gold’s price is a bit higher but should have moved much higher, and if the underperformance factor of the USD Index is taken into account, gold’s price actually declined.
If you’re wondering what our almost-ready self-similarity based tool is suggesting at this time for gold, here it is:
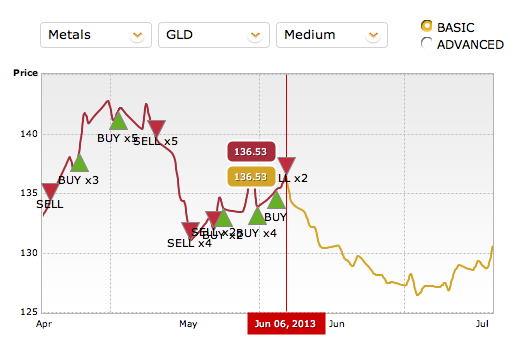
Summing up, gold prices moved higher in US dollars and gold confirmed a short-term breakout, but we do not feel that the situation has changed to bullish. The rally has not been seen in other currencies and gold’s performance was exceptionally weak when compared to the lack of strength in the USD Index.
Silver
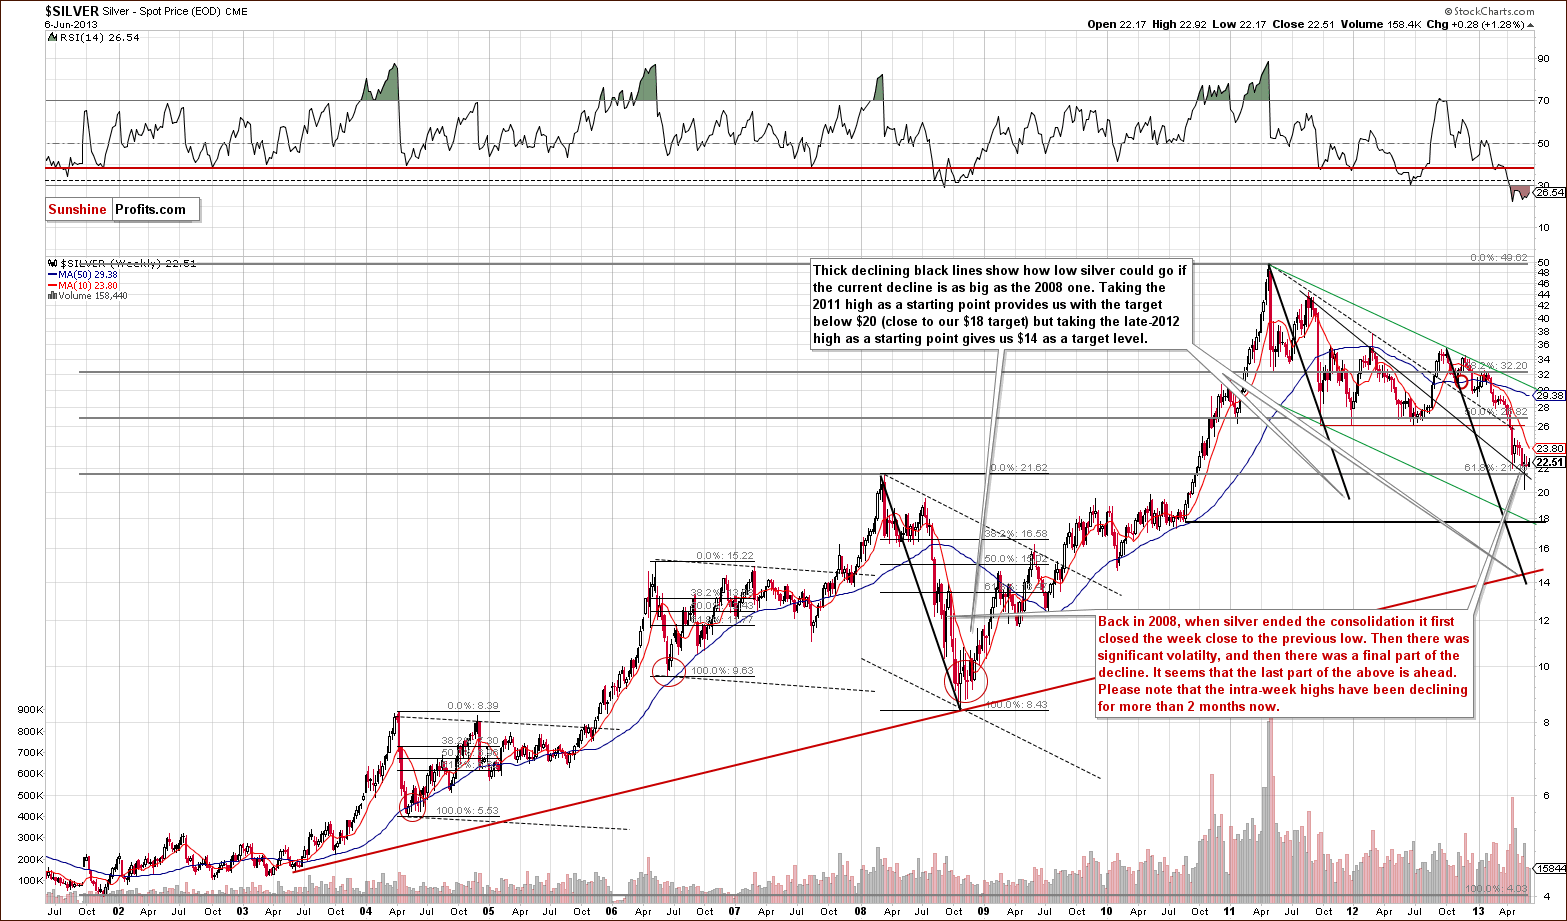
In this week’s very long-term silver chart, the $0.28 rally seen this week is really close to nothing when compared to the previous months’ volatility. The link between 2008 and the current decline is still quite visible and according to what happened back then, the final decline is likely to be seen sooner rather than later. In 2008, it was seen after a period of huge volatility, and this is something we have gone through recently.
Even though prices have moved back and forth recently, a look at the intra-week highs is quite interesting. These have been declining on a week to week basis for more than two months now. That is to say, if we measure silver’s performance, week to week based on the intra-week high, the steady declines are clearly apparent.
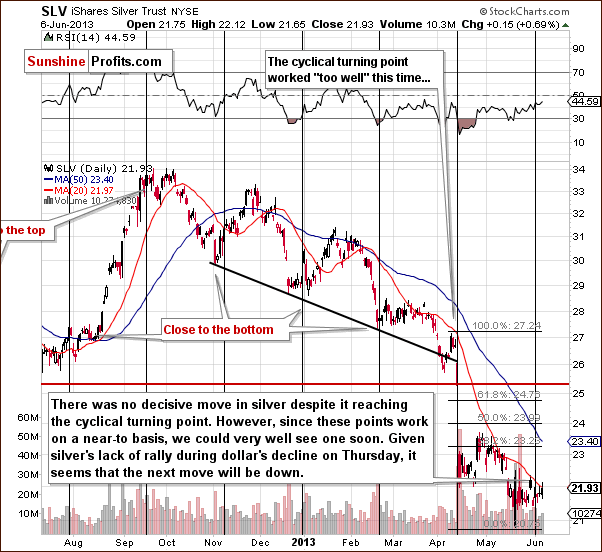
In the short-term SLV ETF chart, no decisive move has been seen and the cyclical turning point was reached several days ago – thus, we could see this type of movement shortly. Once again the lack of movement here on Thursday ($0.15 is really close to nothing), silver is performing quite poorly at this time. Previously, we have discussed how silver underperforming gold has been a common fact in the latter stages of periods of decline. We turn now to the silver to gold ratio to see if there are any signs that this anomaly is taking shape.
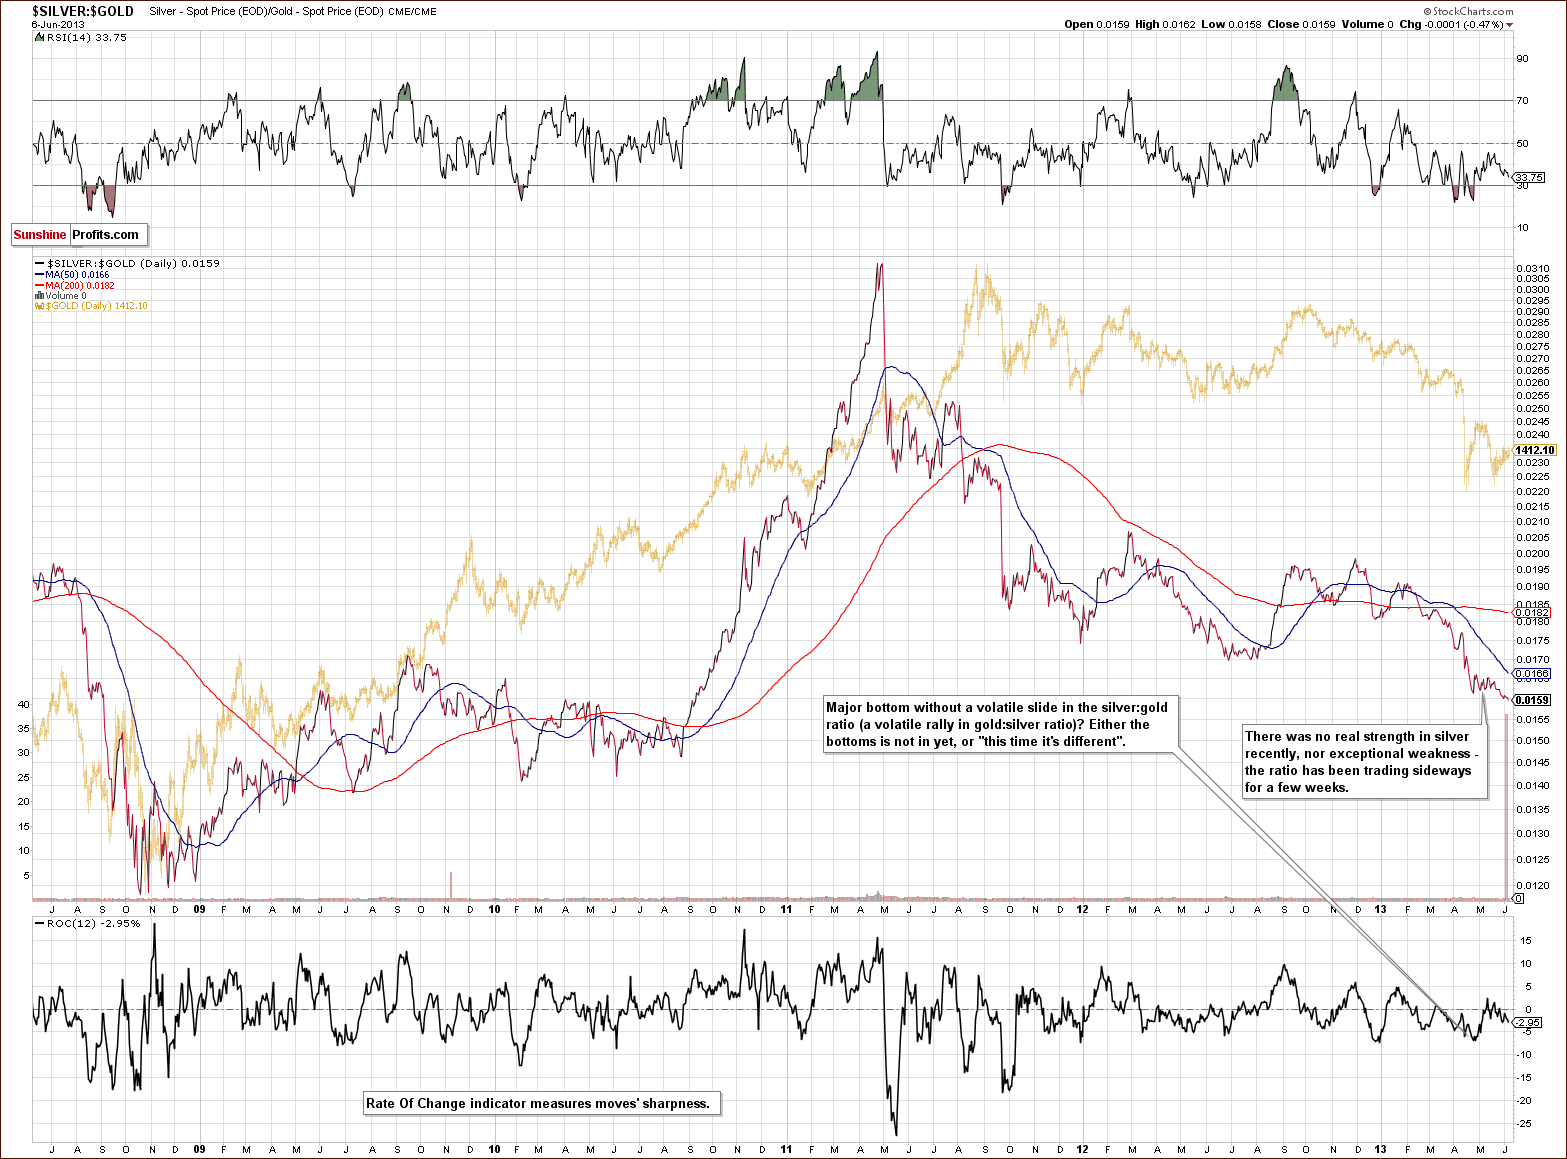
In the silver to gold ratio chart, no significant change was seen in the ratio this week and there is really no big underperformance in silver – it underperforms gold, but it’s neither very visible nor sharp. For this reason, it appears that more declines are ahead for the precious metals.
Summing up, silver continues to underperform gold but not to the extent suggesting that the bottom is in. The short-term outlook remains bearish for the white metal.
Gold and Silver Mining Stocks
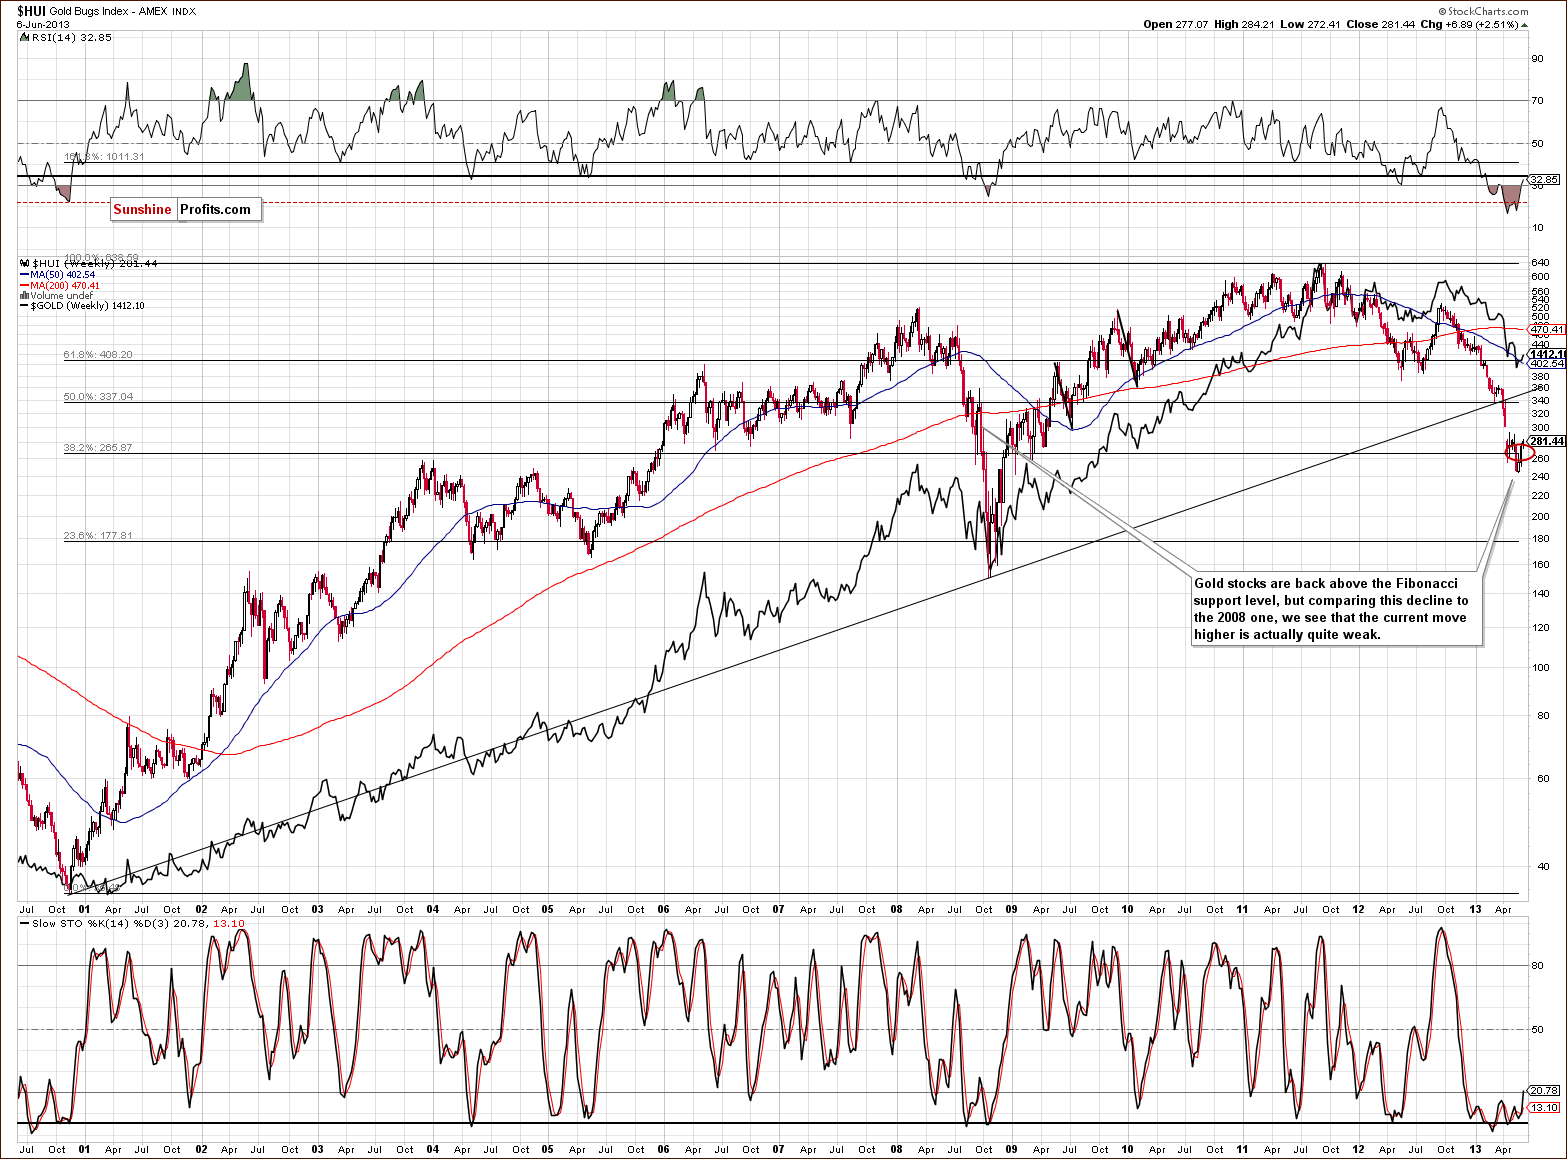
In this week’s very long-term HUI index chart, we see that gold stocks are once again back above the Fibonacci retracement and that they are trading sideways more or less within / close to our previous target area. This does not seem to be the final bottom, however.
Here’s why. This is actually the first significant consolidation here seen since the declines began last September. If compared to 2008, we see there was a pullback before the final part of the decline – more or less in the middle of the decline. Interestingly, the pullback began in a trading range quite close to recent price levels of the index. Consequently, the pullback is not necessarily bullish, as it is something that we could be expecting based on how things evolved in 2008. In fact, the size of the current pullback in gold stocks shows that their strength is actually quite weak.
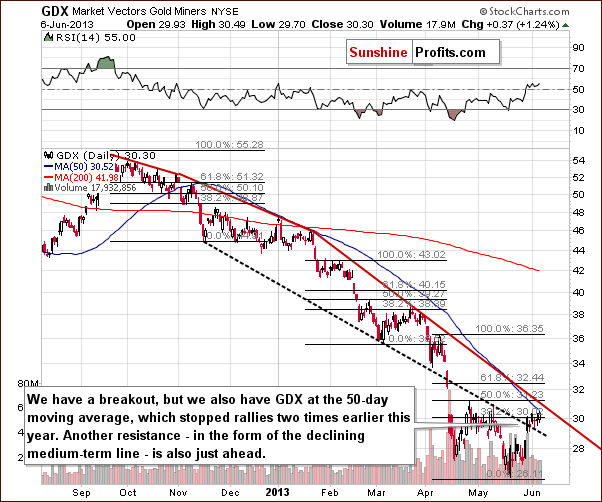
In this week’s short-term GDX ETF chart, we see a breakout above the first resistance level but two more resistance levels are just ahead. For this reason, the recent breakout really doesn’t seem all that important. The performance of the miners relative to Thursday’s USD Index decline was also relatively weak.
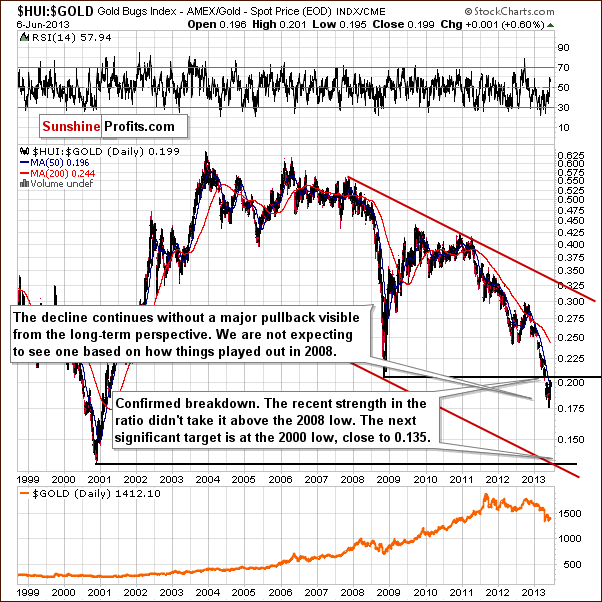
Speaking of relative performance, we turn to the gold stocks to gold ratio chart. Here we can see that the miners’ performance was not so good when looking at their ratio to gold from the long-term perspective. The ratio has not moved back above the level of the 2008 low, so the previous breakdown has not been invalidated and the bearish implications remain in place. Some strength was seen – yes – but it doesn’t seem meaningful yet.
Summing up, the outlook for the mining stocks remains bearish in our view, even though a short-term breakout was seen in the GDX ETF. Two more resistance levels have not been broken and the miners’ lack of reaction on Thursday suggests that the next big move will be to the downside.
It doesn’t seem that the final bottom for senior mining stocks nor junior mining stocks is already in. As far as the latter are concerned, if you would still like to purchase them, regardless of the above, then the junior rankings that we featured last month are currently up-to-date (we will likely have meaningful changes when miners move higher in a more meaningful way – which was not the case recently.)
Letters from Subscribers
Q: Hello, I am a subscriber to your website for 4-5 months. I want to know how to buy the gold, silver and the mining stocks with the stop loss youmention in the market alerts.
A: In our Market Alerts we provide stop-loss levels for gold, silver and mining stocks. The levels for gold and silver apply to physical metals or ETFs (in case of the GLD ETF you would have to divide our stop-loss level by 10.34 to get the level for the ETF) and to mining stock indices (HUI) or ETFs (GDX ETF).
Generally, it would be easiest to use the stop-loss levels with ETFs but it is also possible (though more complicated) with physical metals. The exact approach would largely depend on how you usually buy and sell your metals and miners.
If you use a brokerage account, then whenever placing bets with your short-term (!) trading capital you are able to execute the trades via a stop-loss order. In such an order you specify the usual parameters (size of the position etc.) and, on top of that, you specify a price below which (if you’re long) or above which (if you’re short) the position will be automatically closed. A cautionary note here: simply specifying a stop-loss level (price) does NOT mean that the position will be sold off / covered at that price. If you’re long GLD ETF at 135 with a stop-loss level at 120 and the GLD ETF goes down to 110, you’re stop-loss level will be hit and your broker will attempt to sell your position immediately after 120 has been reached. However, they may find an appropriate buyer only at a lower price, say 115. So the stop-loss level does not precisely limit the price at which the position is closed.
If you’re committed to physical metals and don’t want to use ETFs, the situation is slightly different. You can’t place stop-loss orders as you would do with ETFs and you have to execute the trades on your own. This means you would have to monitor the market and sell / buy when the price hits the stop-loss level. Fortunately, we do much of the monitoring for you, so by reading our Market Alerts you’ll know if the stop-loss levels have been hit or not. Again, playing by these rules does not effectively guarantee that you will sell precisely at the stop-loss price.
Q: On May 10 gold, silver and the HUI Index closed at: $1,448, $23.88 and 280, respectively. AGREED .This means that mining stocks are where they were back then and gold and silver are considerably lower now. AGREED. This does not bode well for the precious metals in the short and medium term." Could you please explain this conclusion? I would think the opposite conclusion would be correct; even though metals are lower, miners are worth more.
May 13 - gold 1393, HUI 257, GDX 27.40
Right now: gold 1393, HUI 273, GDX 29.50
What this is telling me (and this pattern has been in place for a while) is that the miners are catching up, finally.
You may be right about further declines in gold. But the sellers in miners are drying up quickly. They will hold up better, as they have been over the last month. So if we do see 1300, we will be lucky to see 25 or 26 in GDX.
And that's the whole point, because the big money is made in miners, not GLD or physical.
If you disagree with this assessment, please let me know why.
A: We think that one can make big money in gold, in miners, or in both. In case of using both, there is an advantage in the form of decreased risk thanks to diversification. As far as miners' outperformance is concerned - it was indeed a bullish factor in the previous years, but not so much in the case of the previous months, so we are still skeptical about the implications going forward. We would have to see a confirmation, for instance in the form of strength in gold relative to the dollar to believe that strength in the miners is anything more than an indication that the consolidation is almost over and that another downswing is in the cards (which is how this phenomenon used to work in the past several months).
Q: (...) I do not see any SENSE or correlation on the comments by your research team about "Gold does not produce income so does the Crude". Crude is needed for economic consumptions whereas Gold is a safe-heaven on panic.
A: Exactly - crude is needed for economic consumption and gold is needed for other purposes, for example hedging against financial turmoil, but also in jewelry and in other cases. They are both needed as there is demand for both of them. This is the case even though none of them produce income. We apologize in advance for describing it in this way but, you can put a bar of gold and a barrel of oil in a room (or thousands of them in a big warehouse) and they won't produce a single dollar on their own. You can form a company in that area that will actually produce income. That's the point that Mr. Roubini was making against gold - that it's a bad investment (and bound to decline in value) as it doesn't produce income. It doesn't have to in order to increase in price. It seems obvious in the case of oil but somehow it's a big deal in the case of gold. Actually, gold can produce income if you lend it to someone and charge interest (think about it, it's quite similar to real estate, which people usually see as something that generates income if you let someone else use it and charge for it). Anyway, our point was that gold wasn't producing income in a strict sense for more than 10 years and yet it's price rallied - re-stating this fact doesn't imply that gold should decline or rally into 2015.
Q1: Have been away from you all for quite sometime. However, we're glad to be back. We purchased physical gold/silver (75/25%) back in July 2011. As a long term investment. Currently, the PM's accounts for 6% of our entire retirement portfolio. Obviously the PM's have dropped like a rock since then, but we are in for the long term. Could you please give us your opinion on our specific situation and going forward what to look for in diversifying our PM portion of our portfolio?
A: We currently don't advocate holding precious metals as long-term investments as we think that another significant move lower will be seen soon (likely slightly below $1,300). Even if you don't intend to close and then reopen your position in PMs later, we still suggest moving half of the gold holdings into platinum as it seems to have more upside potential at this point. Please note that these are only general suggestions, not investment advice.
Q2: Let me ask this; currently we are down approx 25% in physical gold/silver. Would you still advocate selling half of our gold holdings and buying platinum?
A: Generally, yes, whether you are down 5%, 30% or up 50% doesn't matter in terms of what's likely to happen. I mean - of course it is very important to you, as you care about your savings, but the market "doesn't know" or take into account what has happened with your investments or anybody else's - it will move higher or lower depending on supply and demand and over/undervaluation. It is the outlook that is the key thing to pay attention to - and the outlook for platinum seems better than the outlook for gold for the coming months in our view.
Q: Thank you for your comments, very instructive, very useful ..! However, I do believe that the bottom in slver (and gold) is now 'in', based on the lows of Nov 2008 and May 2013. These two points are also confirmed by grossly oversold RSI readings. Draw a parallel line linking tops of Apl.2006/Apl.2008/Oct2011 (discounting the blow-off top of Apl.2011). With increasing scarcity in the metals, the parallels can be jacked up, and the low of May 2003 can now be discounted. This now projects silver on the top parallel to an estimated $100'ish, or more. A gold equivalent would be around £3,500 ..! The remaining question is how quickly/how soon? Funds from a falling stock market might look for a 'safe haven'. My personal feeling is that a brewing currency war will start when the interest-rate shift hits the fan ...!! Not good for hard-pressed equities, - but brilliant for bullion ..! Next week's action will be more than interesting ..!
A: We generally don't pay too much attention to resistance/support levels that have already been broken (to a great extent), so we don't see the resistance line (without the April 2011 top) as that important and thus the same goes for the parallel support based on it. However, given that technical analysis is highly subjective, you might be right here, and we could be wrong. The question is when to tell if the bearish outlook is really invalidated - in our view the best way to look at it is to wait for a confirmed breakout above the declining resistance line and for the time when metals actually react to short-term bullish factors such as declines in the USD Index. We saw the breakout and as a result we have decided to tighten stop-loss orders as outlined in our Market Alert from May 30. However, we don’t see strength in the silver market and thus we continue to believe that it’s going lower before moving much higher.
Q: I know you are not anticipating it, but what do you think would be the result of a sudden general market plunge at this point? Gold is waiting for Friday's employment report; if it's bad enough, stocks could sell off with $$$ rotating into gold.
A: It depends how big the plunge would be. Stocks declined in the past several days and there was barely any positive reaction in gold. Most of the current decline in stocks happened in the last 4 trading days - and during that time gold moved neither higher, nor lower, overall. Gold is negatively correlated with stocks in the medium term, but its reaction is much stronger when stocks rally (gold declines) than the other way around. Unless the decline is really huge, and by that we mean something like in 2008 or at least 1/3 thereof, it would probably not be enough to "scare people into gold". A small correction would likely not manage to do so, in our view.
Of course, we're talking about the stock market's impact without considering other factors. It seems that gold needs to move lower to form a bottom and when it does it can rally even without the stock market's help.
Summary
The most important development this week was the big decline in the USD Index on Thursday and the reaction (or lack of reaction) seen in gold, silver and the mining stocks. If a given market fails to respond to a strong signal that would normally cause it to move in a specific direction, then it is a strong signal for a move in the opposite direction. This is precisely how invalidations of breakouts and breakdowns work.
In this case, what happened in the USD Index should have been a strong bullish factor for the precious metals, and basically nothing happened. The fact that nothing happened, especially after a confirmed breakout for gold, is a major bearish indication.
All in all, we continue to think that the precious metals market will decline once again (in the following weeks) before moving higher in the coming months.
Trading – PR: Short silver and mining stocks.
Trading – SP Indicators: No positions: SP Indicators suggest long positions but the new self-similarity-based tool suggests short ones for the precious metals sector and we think that overall they cancel each other out.
Long-term investments: No positions.
| Portfolio's Part | Position | Stop-loss / Expiry Date |
|---|---|---|
| Trading: Mining stocks | Short (half) | - / - |
| Trading: Gold | Short (half) | $1,428 / - |
| Trading: Silver | Short (half) | $23.55 / - |
| Long-term investments: Gold | No position | Buy half at $1,305 |
| Long-term investments: Silver | No position | Buy half at $18.20 |
| Long-term investments: Mining Stocks | No position | Buy half at XAU 84 |
This completes this week’s Premium Update. Our next Premium Update is scheduled for June 14, 2013.
Thank you for using the Premium Service. Have a profitable week, a great weekend!
Sincerely,
Przemyslaw Radomski, CFA


