- Euro & USD Indices
- General Stock Market
- Crude Oil
- Correlation Matrix
- Gold
- Silver
- Palladium
- Mining Stocks
- Letters from Subscribers
- Should I sell when I'm earning profit
- Gold price in Pakistan
- The miners are showing increasing strength
- Physical Side of the Market
- Summary
The opening part of today’s Premium Update is a part of the upcoming monthly Market Overview – a new, soon-to-be-released service. In our recent survey (thank you for participation) there were many votes for creating monthly reports that would deal with fundamental issues related to the precious metals market and this is the first step in this direction. The aim of our monthly Market Overview reports is to take an unbiased, professional look at the most important events that are currently taking place, discuss them thoroughly and provide an interpretation which might be of interest to you – namely, their implications on the most important markets with the emphasis on the precious metals sector. The author of these reports is Matt Machaj, PhD, economist, university professor, member of the Property and Freedom Society, and laureate of the Lawrence Fertig Award (you will find details on this Mises Institute page, where Matt’s name is listed twice, along with Ron Paul and Jim Rogers). You will find more information in our "About us" page.
Below you will find a detailed discussion of the comments that John Paulson made regarding inflation. The comments below are available exclusively to you, our subscribers.
---
The famous hedge fund manager John Paulson said he is not concerned about the recent plunge in gold prices, and believes that the reasons to hold on to gold are still intact. Tremendous money printing by the Federal Reserve System has not disappeared, and so far there has been little price inflation, which should result from such money printing. Therefore the quantitative easing bomb seems to be waiting for us around the corner. According to Paulson, there is close to 300% more money now compared to before the fall of Lehman and the beginning of Bernanke’s bailout programs. Because of that, it seems sensible to look for a currency alternative to the dollar in order to protect capital against the inflation force. Since historically gold seems to be, to some extent, a reliable anti-inflation hedge, most people moved into gold after the expansionary monetary policy was triggered. Nonetheless despite inflation in the money supply no big price inflation happened. Some people were disappointed by low price inflation (not corresponding to huge increases in the money supply), lost their patience, and finally backed out from the shiny investment. Hence the plunge of gold prices.
Paulson is not alarmed though. Notwithstanding this stepping back of few investors, the inflationary forces are still at work, and (high) inflation in prices seems unavoidable in the end. It is just difficult to tell “when” it should happen. Naturally, in the short run gold is volatile and it is hard to predict a very near future.
The problem with Paulson’s approach is that a scary “300” number does not really relate to “money supply”, but only to “base money”, or “monetary base”. Base money is just part of the money supply circulating (or not circulating…!) in the economy. It is the money created by the central bank, and handed out to the commercial banks. Surely the graph for monetary base may look a bit worrying. In 2008 base money was a bit over 800 billion, and now it’s over 3200 billion. This money has quadrupled. Notice the specific change in policy at the close of the year 2008…
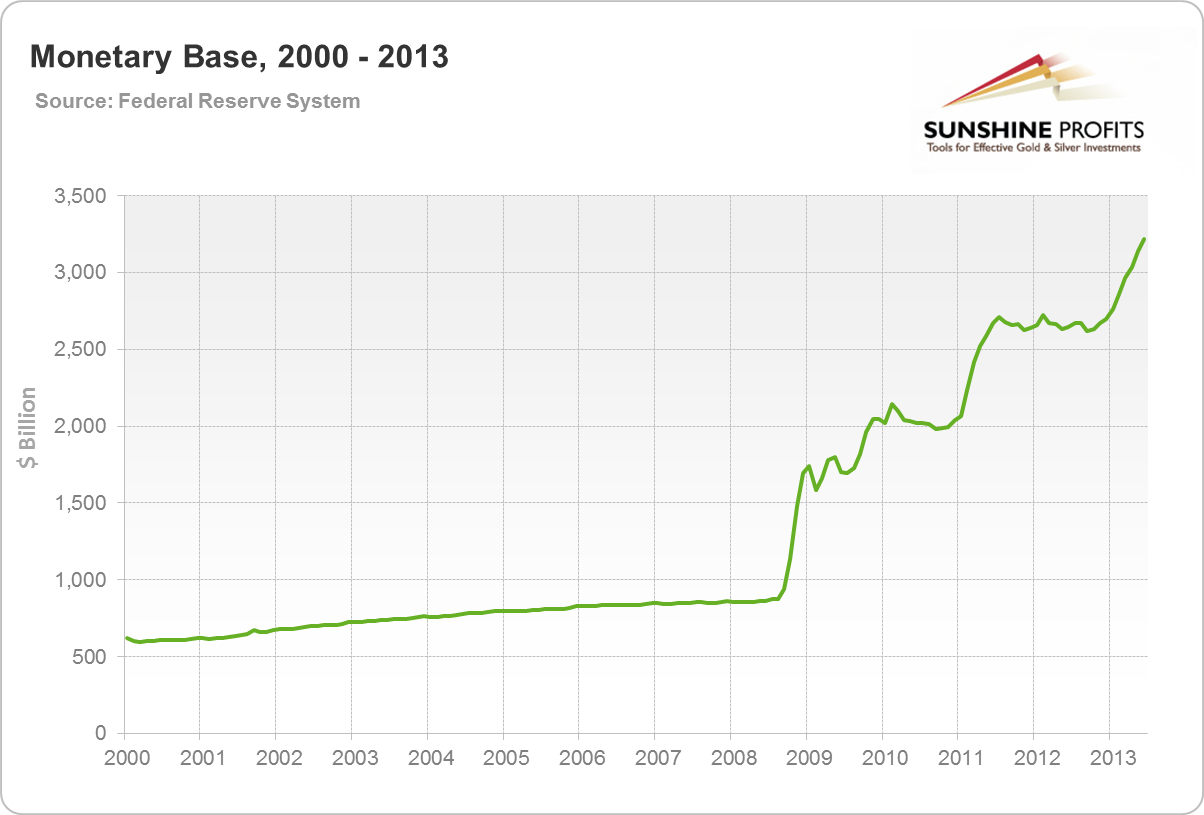
Despite Paulson’s claims, let us not be that excited about that hockey stick (or, for the time being, let us be less excited). Monetary base, however important, is just a part of the monetary system. After all, the banks are not solely interested in money creation by the central bank, but are interested in how they can use that created money for profitable lending. It is all about “a monetary transmission mechanism”, or how that newly created by the central bank money creates the possibility to increase the total amount of money used by market participants. Big piles of new money (base money) can be created, but they do not always end significantly bidding up the prices in crucial markets.
It is very tricky to define “money supply” (how big the amount of money possessed by the public is) nowadays, because of numerous banking innovations (is your savings account surely money, or is it just near-money?). Putting aside the problem of the exact definition, one can observe clearly that broader monetary aggregates do not look as alarming as the base money does. Take the case of MZM (money zero maturity), or M2 (including deposits and other instruments). The pace of growth does not resemble a hockey stick seen in the case of base money, but rather remains at similar levels as it has for years.
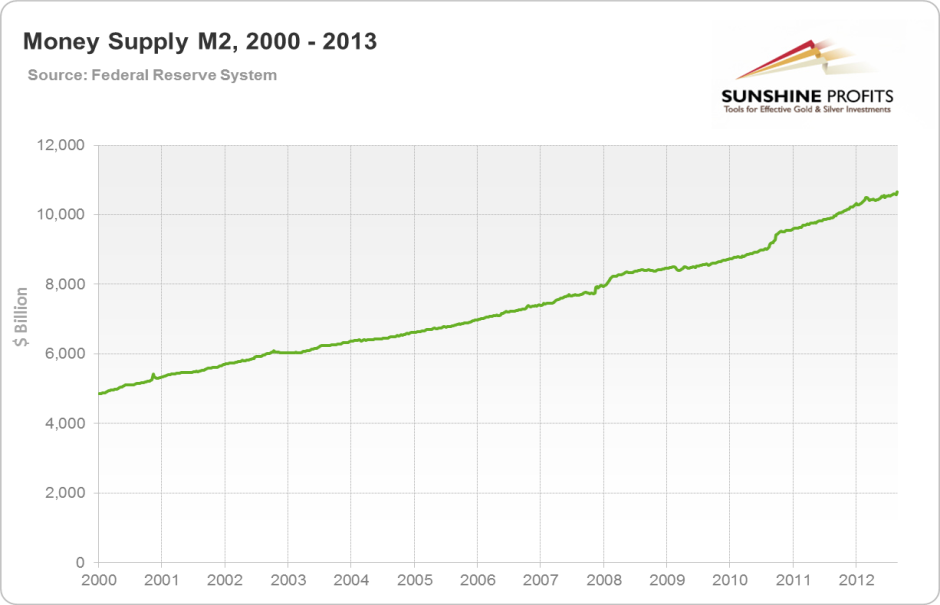
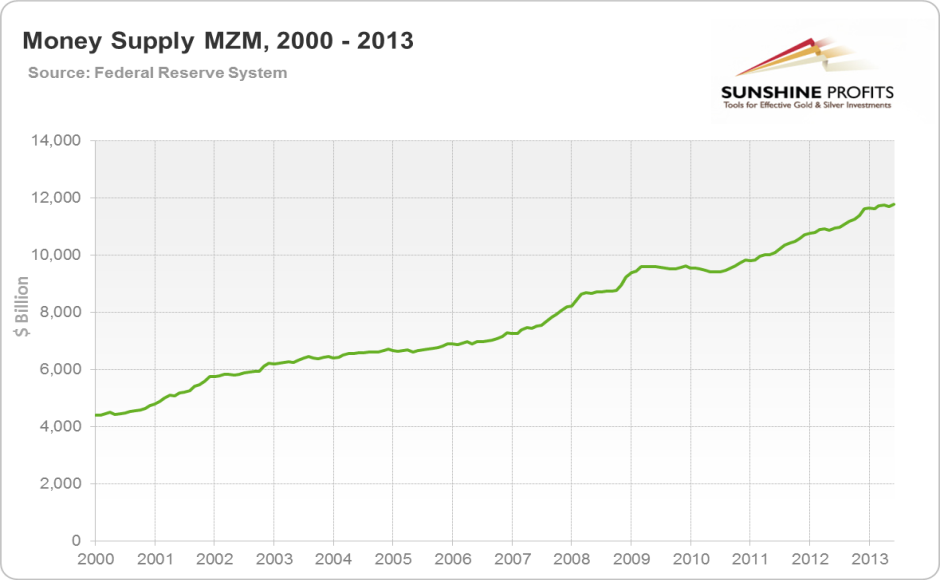
Increases in the base money are alarming and indicate very loose monetary policy since 2008. Yet, before this change transforms the economy of relatively low price inflation into runaway inflation, a “monetary transmission mechanism” has to start working. This mechanism is a way in which banks use the extra money to increase their lending, which in turn will lead to prices going up across all the sectors of the economy.
Last month PayPal accidentally credited someone with 92 quadrillion dollars. If the central banks of the world keep the current pace of bank bailouts, who knows? Maybe this kind of sums may not be that far away from today. Then, I guess, we could start to worry about possible hyperinflation. The happy founder of the newly “created” 92 quadrillion dollars (which soon disappeared) said that if he could have kept the money, he would probably have paid off the national debt. I’d rather think that everybody would have been better off if he had just burned that money. What’s the point in paying off the national debt with money that soon becomes worthless?
What’s important in it then? Expansionary monetary policy by the Fed is certainly a fact. But other things have to happen before this policy succeeds in creating high doses of real inflation. If the central bank is engaged in active pumping, we have all the reasons to be bullish about precious metals. Nevertheless, one has to be careful about the proper understanding of the existing conditions. Hundreds percent more in terms of base money do not mean hundreds percent more in terms of the total amount of money. It can mean that the rhythm of an increase in the money supply is stable and no different from what it was years ago. Therefore, significant increases in base money can be good reasons to be bullish, but not necessarily as bullish as Paulson argues.
---
We will provide you with details regarding the availability of the full report shortly, along with the list of the issues that it covers. As always, we would love to hear/read your feedback. Meanwhile, let’s see what’s likely to happen in the precious metals in the short- and medium term. Let’s turn to charts (courtesy of http://stockcharts.com.)
USD and Euro Indices
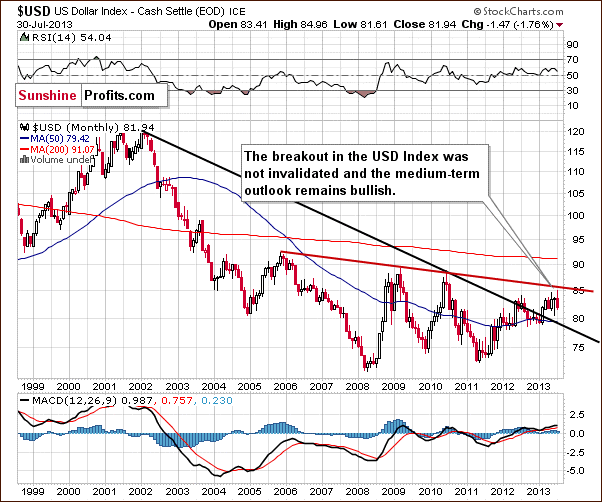
The situation in the long-term chart hasn’t changed much recently.
As we wrote in our last Premium Update:
The breakout above the declining support/resistance line (currently close to 79) was still not invalidated. From this perspective, the situation remains bullish.
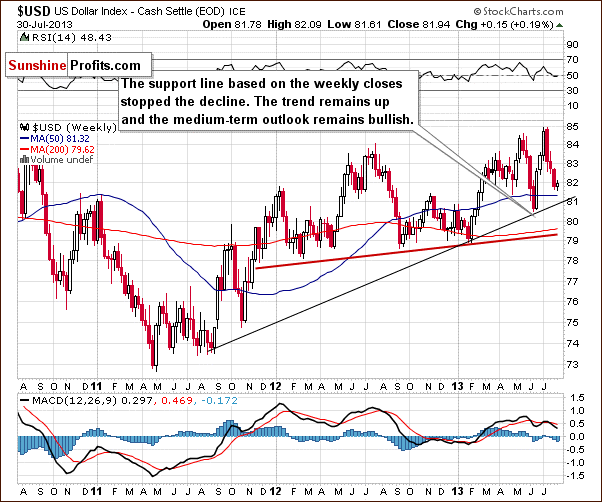
On the above weekly chart, we can see that last week the USD Index has declined once again. However, the recent declines did not take the index below 81, thus the medium-term uptrend is not threatened. In the past week, it was not broken, in fact, it was not even reached. From this perspective, the situation remains bullish, and we can expect the dollar to strengthen further in the coming weeks, even if it moves temporarily to the 81 level.
Please note that the USD Index is also still above the 50-day moving average, which serves as support now.
Now, let's zoom in on our picture of the USD Index and view the short-term chart.
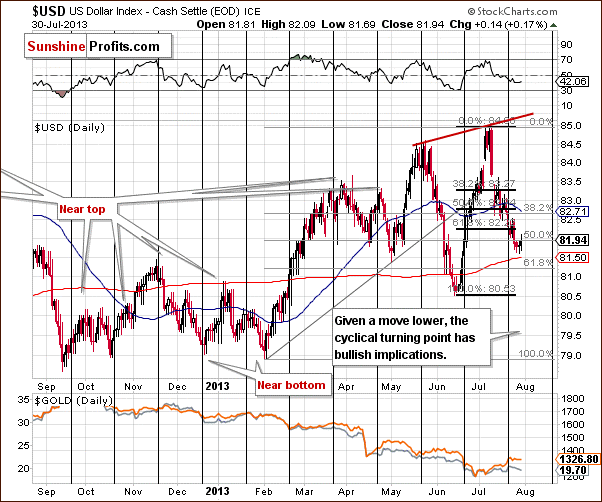
From the short-term perspective, we clearly see that at the beginning of the last week, the U. S. dollar dropped slightly below the 61.8% Fibonacci retracement level based on the June - July rally. In the following days, the USD Index moved back above this level, which invalidated the breakdown. However, the improvement of the situation didn’t last long. At the end of the last week, the US currency moved lower once again. In this way, the USD dropped also below the 50% Fibonacci retracement level based on the entire February – July rally, which is at the 82 level.
On Monday, the USD declined one more time by moving below last week's lows. However, if we take into account an intra-day basis, we will see a double bottom pattern at 81.61 level. From this perspective, the U. S. dollar seems to be bottoming.
As we previously mentioned, the USD Index is still above the 50-day moving average, which serves as support now. When we factor in the cyclical turning point, it’s quite possible that we will see its impact on the dollar this week, and this can lead to a bigger pullback. This provides us with bullish implications and from this point of view a move to the upside is still likely to be seen.
If, however, the USD declines on a very short-term basis, then it’s not likely to decline much lower, as the medium-term support line is at the 81 level, quite close to where the USD Index is right now. Please note that there’s also a 61.8% Fibonacci retracement level that may serve as support slightly above the 81 level.
Let’s take a look at the Euro Index.
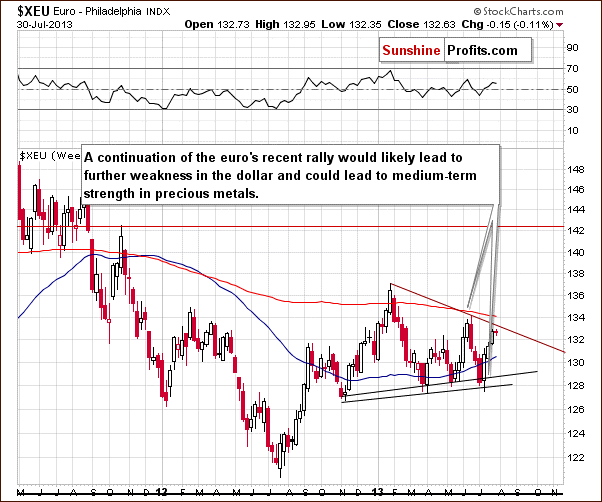
The situation has changed very little so far this week. After an invalidation of the bearish head-and-shoulders pattern, the European currency continued its rally throughout the past week. Although the euro climbed up once again and has improved its position, the buyers didn’t manage to push it above the 133 level.
At this point, it’s worth mentioning that the recent price action in the euro led to further weakness in the dollar, but it did not result in significant short-term strength in precious metals, which is a bearish sign.
Another bearish factor on the above chart is the declining resistance line based on the January top and the June peak, resistance which may stop the rally – currently close to the above-mentioned 133 level. If the euro declines, we might see another head-and-shoulders pattern on a smaller scale.
The combination of the psychological resistance level and the above-mentioned declining resistance line may have encouraged sellers to go short and thus trigger a correction. In this case, the Euro Index will likely bounce off the psychological resistance level at 133. If we see such a bearish scenario, it would likely lead to strengthening in the dollar which could then lead to medium-term weakness in precious metals.
Summing up, the long- and medium-term outlooks for the dollar remain bullish. From the short-time perspective, we see that the USD Index declined once again last week. The recent decline still seems to be a counter-trend bounce (it is still smaller than the previous one).
At the same time, the Euro Index climbed up and reached the psychological resistance level of 133. Although these changes should have had bullish implications for gold, the yellow metal didn’t move sharply above the highs that it had established last week. At the end of the last week metals declined even though the dollar moved lower which is a strong bearish sign.
General Stock Market
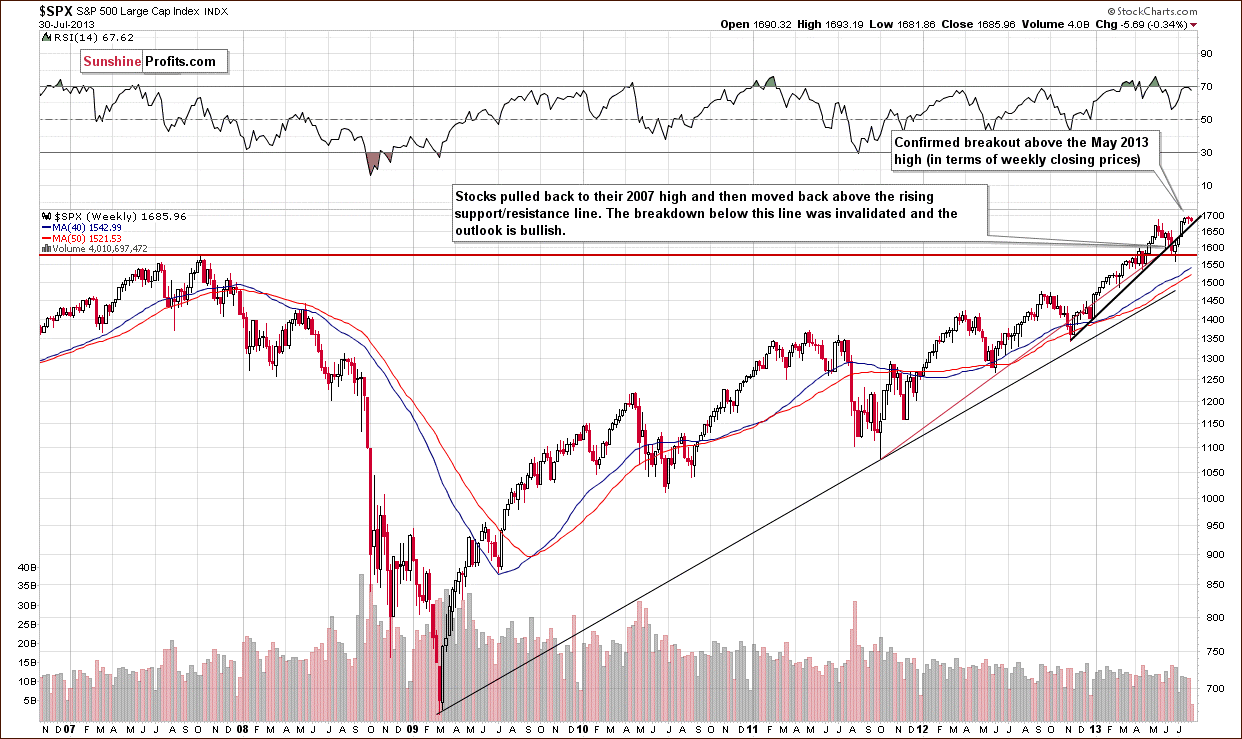
On this week‘s long-term S&P 500 chart, we see that the situation hasn’t changed much. After the breakout above the May top, traders and investors continued to buy, which resulted in another all-time high of 1,698.78 last Wednesday. In so doing, the S&P 500 almost reached the psychologically important resistance level of 1,700. In the following days, investors took some profits which led to a corrective move. However, the correction is very shallow and the S&P 500 index is still above the previously broken the upward trend line based on the November 2012 low and the January 2013 bottom.
Last week, stocks closed above their May top (in terms of closing prices), so the breakout is now confirmed (3 consecutive weeks that prices closed above it) and another upswing is very probable.
From this perspective, we already see that the recent decline was nothing more than one more correction, and the outlook continues to be bullish.
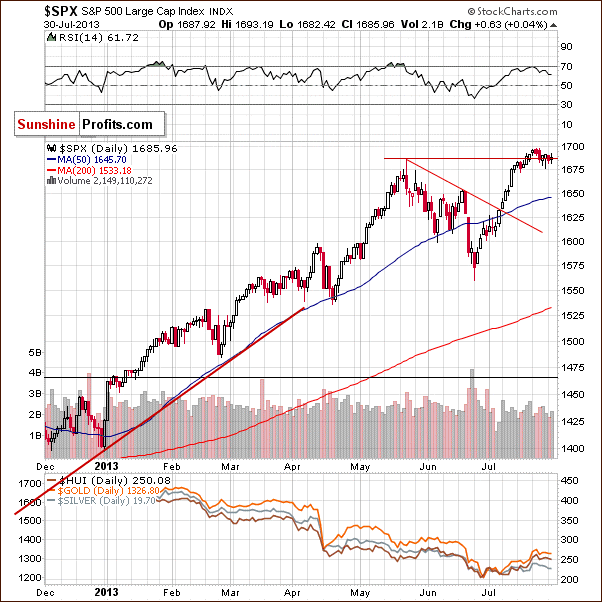
On the above daily chart we see that prices climbed once again, resulting in another all-time high of 1,698.78 last Wednesday. Despite this growth, the higher prices did not last long. The S&P500 index gave up the gains and dropped a bit in the days which followed. The reason for this is likely that the psychological resistance level of 1,700 encouraged investors to lock in some profits. However, the corrective move is very shallow at the moment. Although stocks moved back below the May top (intraday), the breakout above this level has still not been invalidated.
From the short-term point of view, the outlook is also bullish.
We turn now to the financial sector, which in the past used to lead the rest of the general stock market.
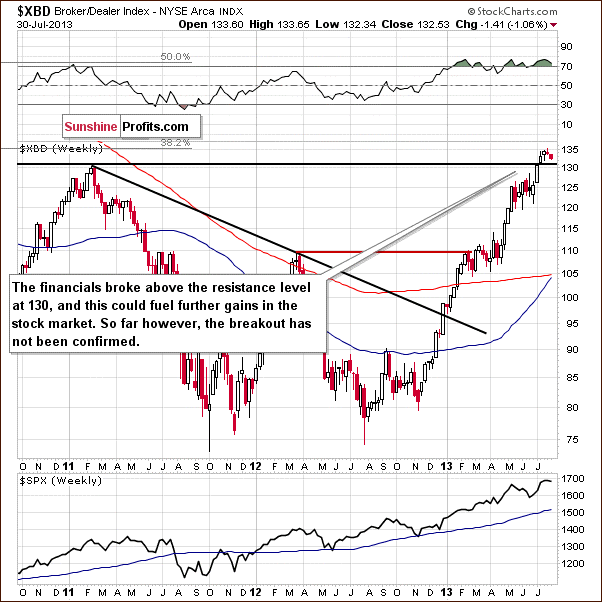
On the above Broker-Dealer Index chart, we see that the financials closed the previous week above the previously broken resistance level of 130. Therefore, the breakout has been verified and confirmed.
However, at the beginning of this week the situation has deteriorated slightly and the price moved below last week’s top which was just above the 135 level. Despite this decline, the outlook hasn’t changed.
Similar to what we saw on the long-term S&P 500 chart, the breakout has not been invalidated in this case either.
Summing up, although we saw a small corrective move in stocks, the previously confirmed long-term breakout was not invalidated. This fact, along with a bullish outlook for the financials makes the overall outlook bullish for the general stock market.
Crude Oil
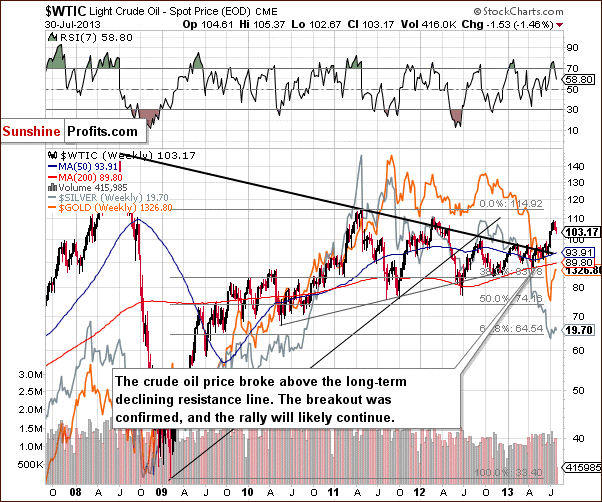
On the above chart we see that the situation has deteriorated slightly. In our previous Premium Update, we wrote that situation was overbought on a short-term basis (the RSI indicator was above 70) and that a short-term correction was quite likely. In recent days, the RSI has dropped below the 70 and generated a sell signal. This circumstance encouraged the oil bears to go short and triggered a corrective move. Although the price of crude oil still remains above the broken long-term declining resistance line, the recent correction took it below $105 per barrel.
Please note that in the past, we saw the yellow metal’s price moved higher along with the price of crude oil (there are periods when this relationship works, but that’s not always the case). The current rally in gold took place along with the rally in crude oil. If oil corrects, this could trigger another move lower in gold as well. Please note that gold - unlike crude oil - is in a medium-term downtrend.
Gold and Silver Correlations
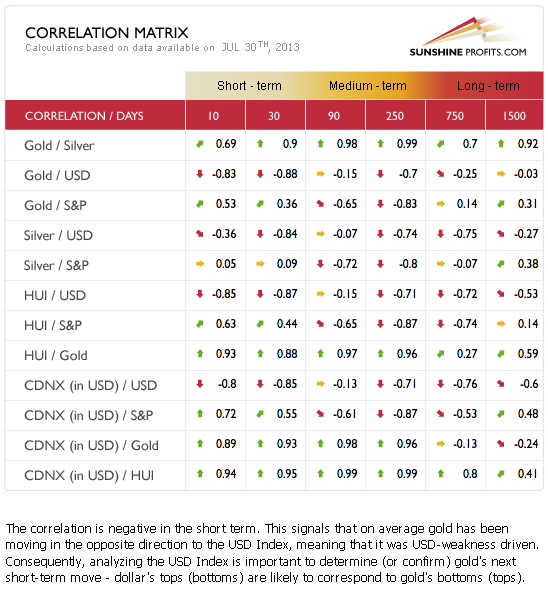
The Correlation Matrix is a tool which we have developed to analyze the impact of the currency markets and the general stock market upon the precious metals sector (namely: gold and silver correlations). Basically, there are no changes in the values of coefficients since we commented on them previously in last week’s Premium Update.
We have seen negative correlation between the metals and the USD Index, while the general stock market coefficients with the metals are pretty much neutral. Taking the short-term, bullish outlook for the USD Index into account, the implications for gold, silver, and the mining stocks are clearly bearish at this time.
Gold
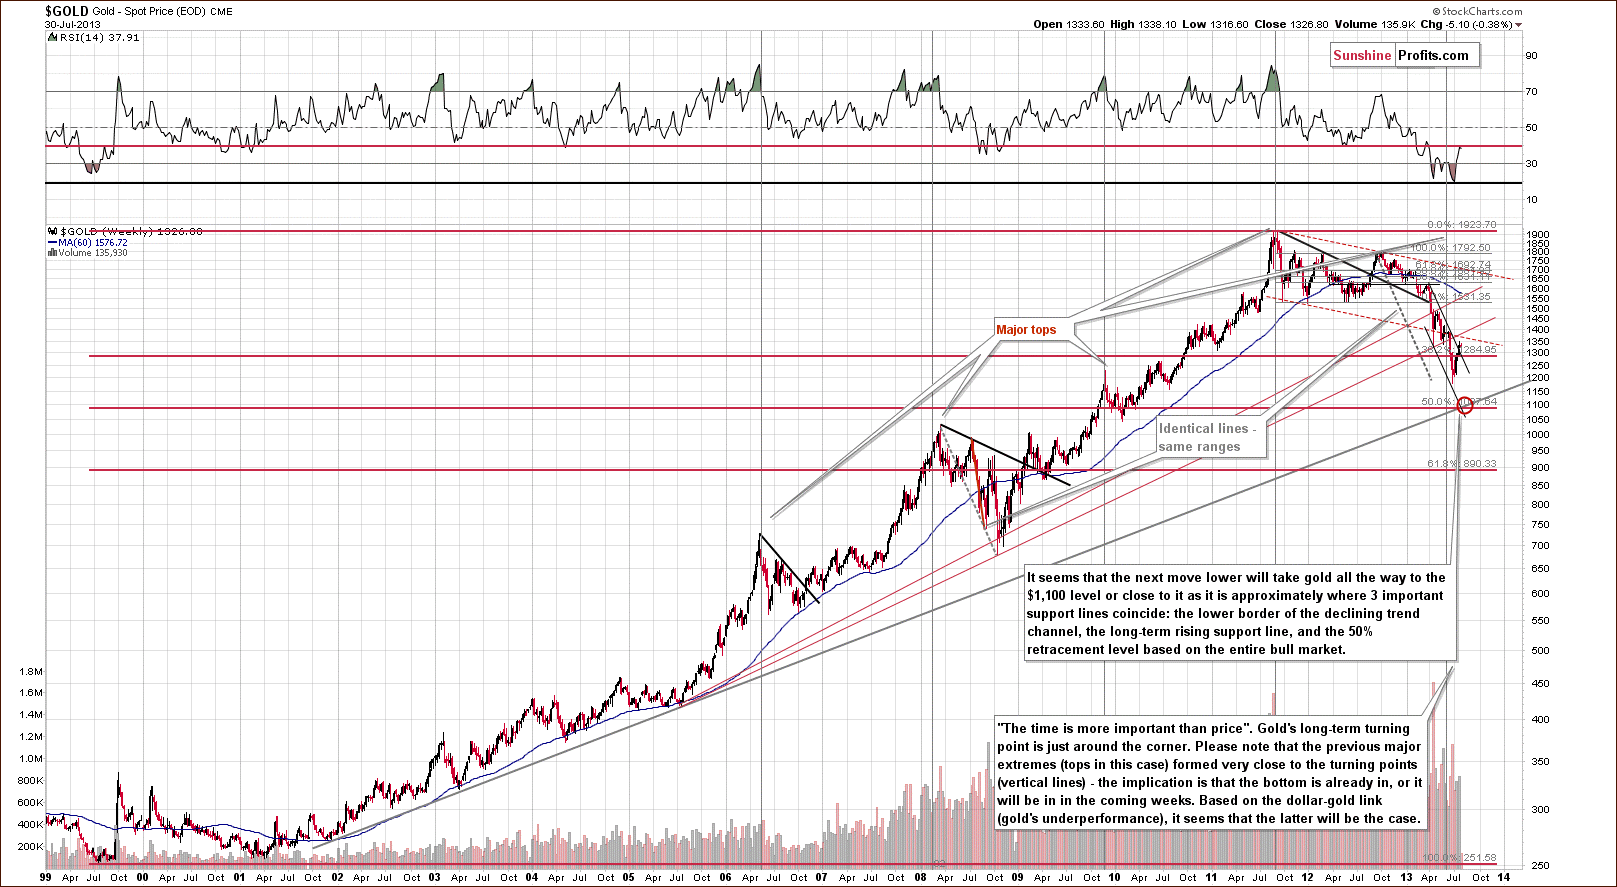
On the long-term gold chart we see that the situation hasn’t really changed. We see a breakout above the declining resistance line, but it doesn’t seem to be really reliable.
As we wrote previously:
Given where gold is currently, if we see an April- or June-style drop, the yellow metal will move right into our target area marked with red ellipse. This is where several important support lines intersect and where we think the final bottom will materialize.
Still, on a short-term basis, we saw a breakout, and since we received a few questions about it this week, we will discuss this issue once again a bit later.
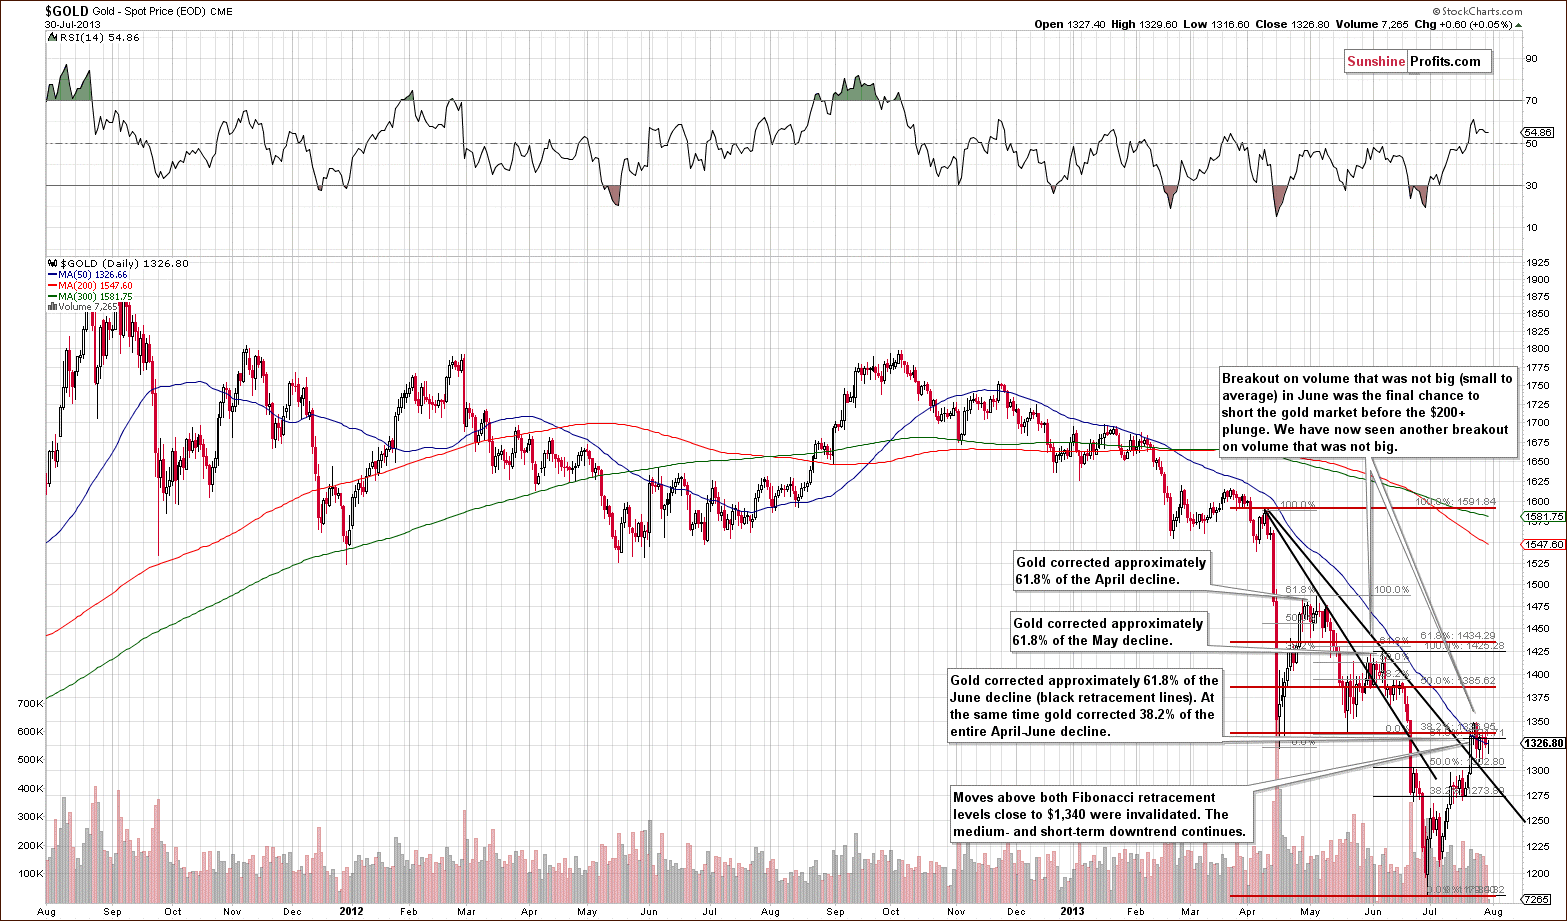
On the above chart, we see that gold did not manage to move above the 38.2% Fibonacci retracement level based on the April-June decline nor the 61.8% Fibonacci retracement level based on the June-July decline. Thus, the downtrend remains in place. Although we saw a breakout above the declining resistance/support line, it doesn’t really seem to be reliable. We saw such a price action in the past on a very similar occasion, namely the previous breakout – one very similar to the current one – which resulted in a dramatic decline.
As we wrote in our last Premium Update:
(…) the current move up is very similar to what we saw after the April decline. In fact, it seems that the April decline-and-pullback pattern is repeating here. Please note that after April's huge decline gold corrected 61.8% and then declined once again. This week gold rallied to the 61.8% retracement based on the June decline, so we can say that things are in tune with the previous pattern. Unless we see more strength in the coming days, it seems that we will see another decline.
Moreover, please note that gold didn’t manage to move above the April bottom (in terms of closing prices). All in all, the above chart has more bearish implications than bullish ones.
Now let’s take a look at the chart featuring gold‘s price from the non-USD perspective.
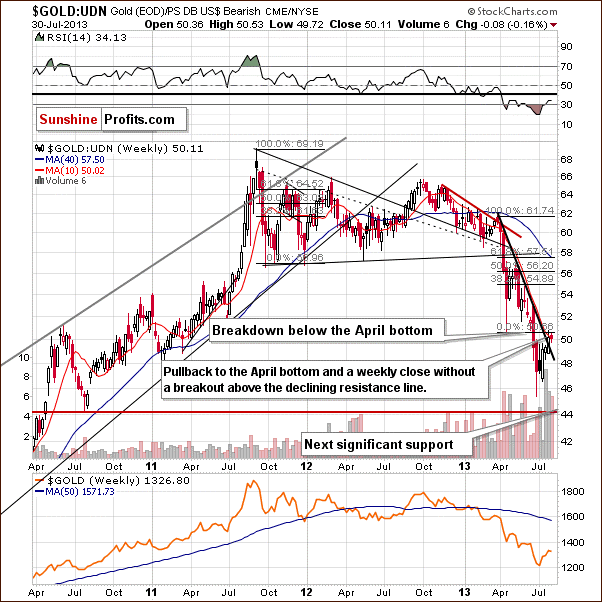
Gold viewed from the non-USD perspective showed strength last week. Although the rally took it slightly above the level of April’s bottom, the improvement didn’t last long. The yellow metal declined at the end of the last week, and in the end, the breakdown below the April’s bottom was not invalidated.
It’s worth mentioning that last week’s move to the upside took gold above the declining support/resistance level. However, we think that gold’s failure to move back above the April bottom is more significant.
Consequently, from this perspective, the outlook still remains bearish in our view, and we expect further declines. If the price of gold drops below the above-mentioned resistance line once again, the situation will be even more bearish, and in this case, we will expect the decline to then quickly accelerate.
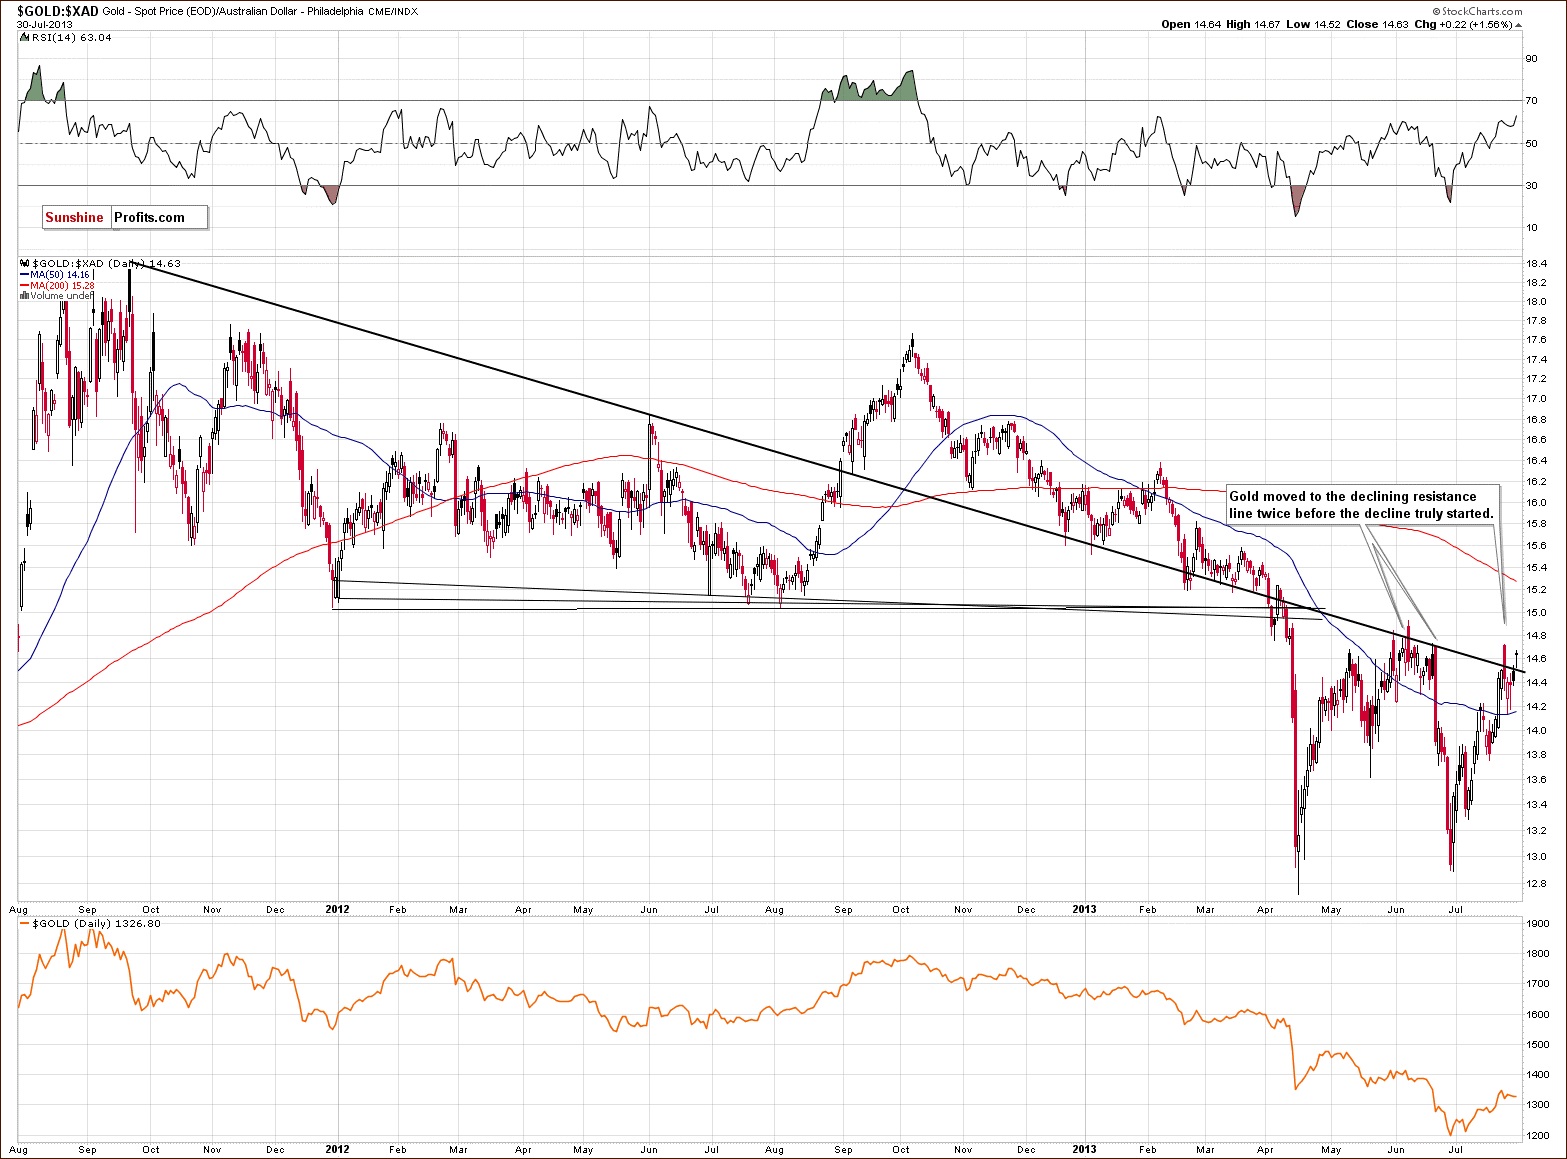
On the above chart, we see that the price of gold in Australian dollars hasn’t changed much. Although gold climbed up above the declining resistance line, the breakout was invalidated very quickly, and the price came back below this declining resistance line (currently close to 14.5).
We saw a similar price action in June. After the invalidation of the breakout above the above-mentioned declining support/resistance line, there was a pullback to this resistance line. The buyers, however, didn’t manage to push gold above it. This resulted in strong declines, which took the price all the way back down to the April bottom area.
So, from this point of view, the recent increase hasn’t changed the current outlook and the implications remain bearish.
If we see similar price action here, gold priced in Australian dollars will likely decline once again. Such a triple-bottom, in this case, would likely mean a breakdown below the previous lows in the price of gold seen from our regular USD perspective, a price action similar to what was seen in June.
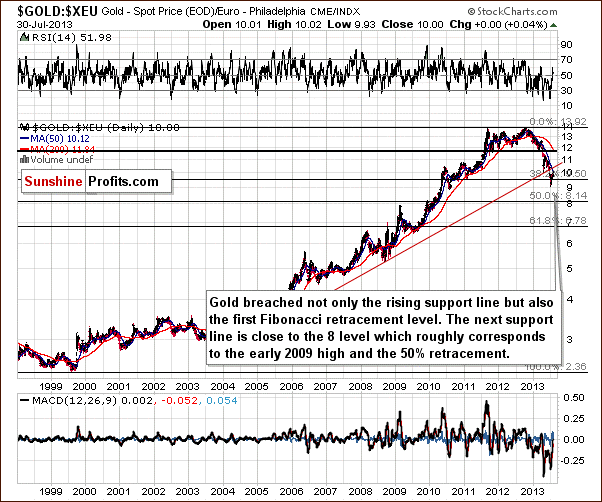
On the above chart, we see that the situation hasn’t changed either. Gold priced in euro remains below the 50-day moving average, which still serves as resistance. The yellow metal didn’t break out above the previously broken, important long-term support line which has now turned into resistance. Implications here are still bearish.
Summing up, we had seen a breakout in gold above the Fibonacci retracement levels, but this breakout was invalidated, and more importantly, it’s unclear whether this breakout can be trusted. There was no breakout above the April bottom either, and the outlook remains bearish.
Silver
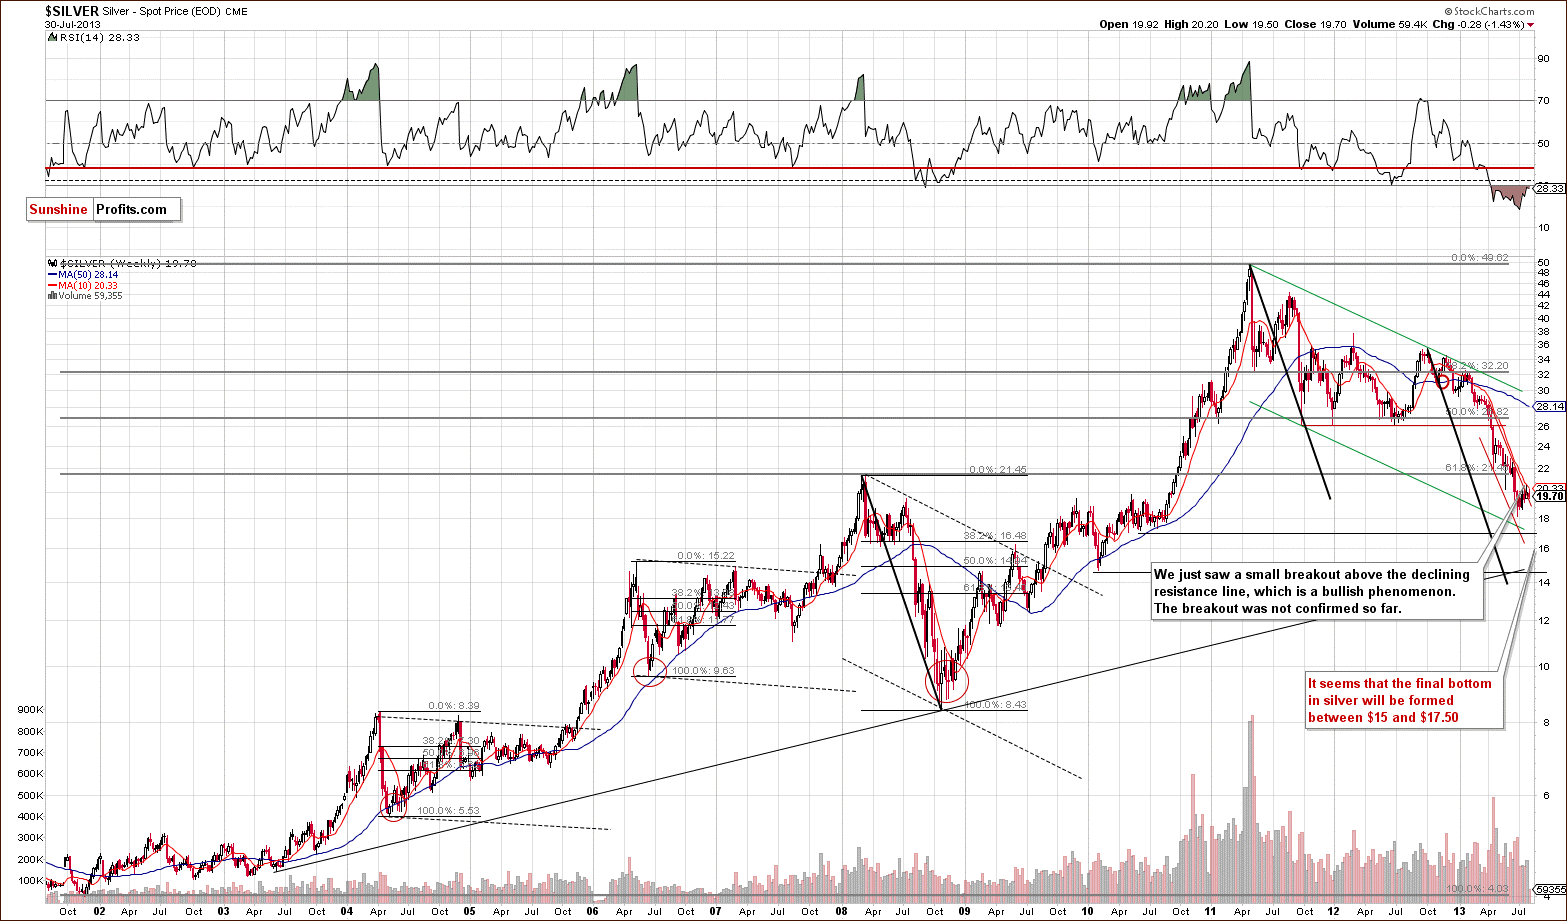
In this week’s very long-term silver chart, we see that last week’s breakout above the declining resistance line is barely visible from this perspective. Therefore, it doesn’t change the picture very much. The breakout was quite small, and at this point it doesn’t seem to be reliable.
Please note, silver is underperforming gold, but it’s not underperforming gold extremely enough to signal a bottom.
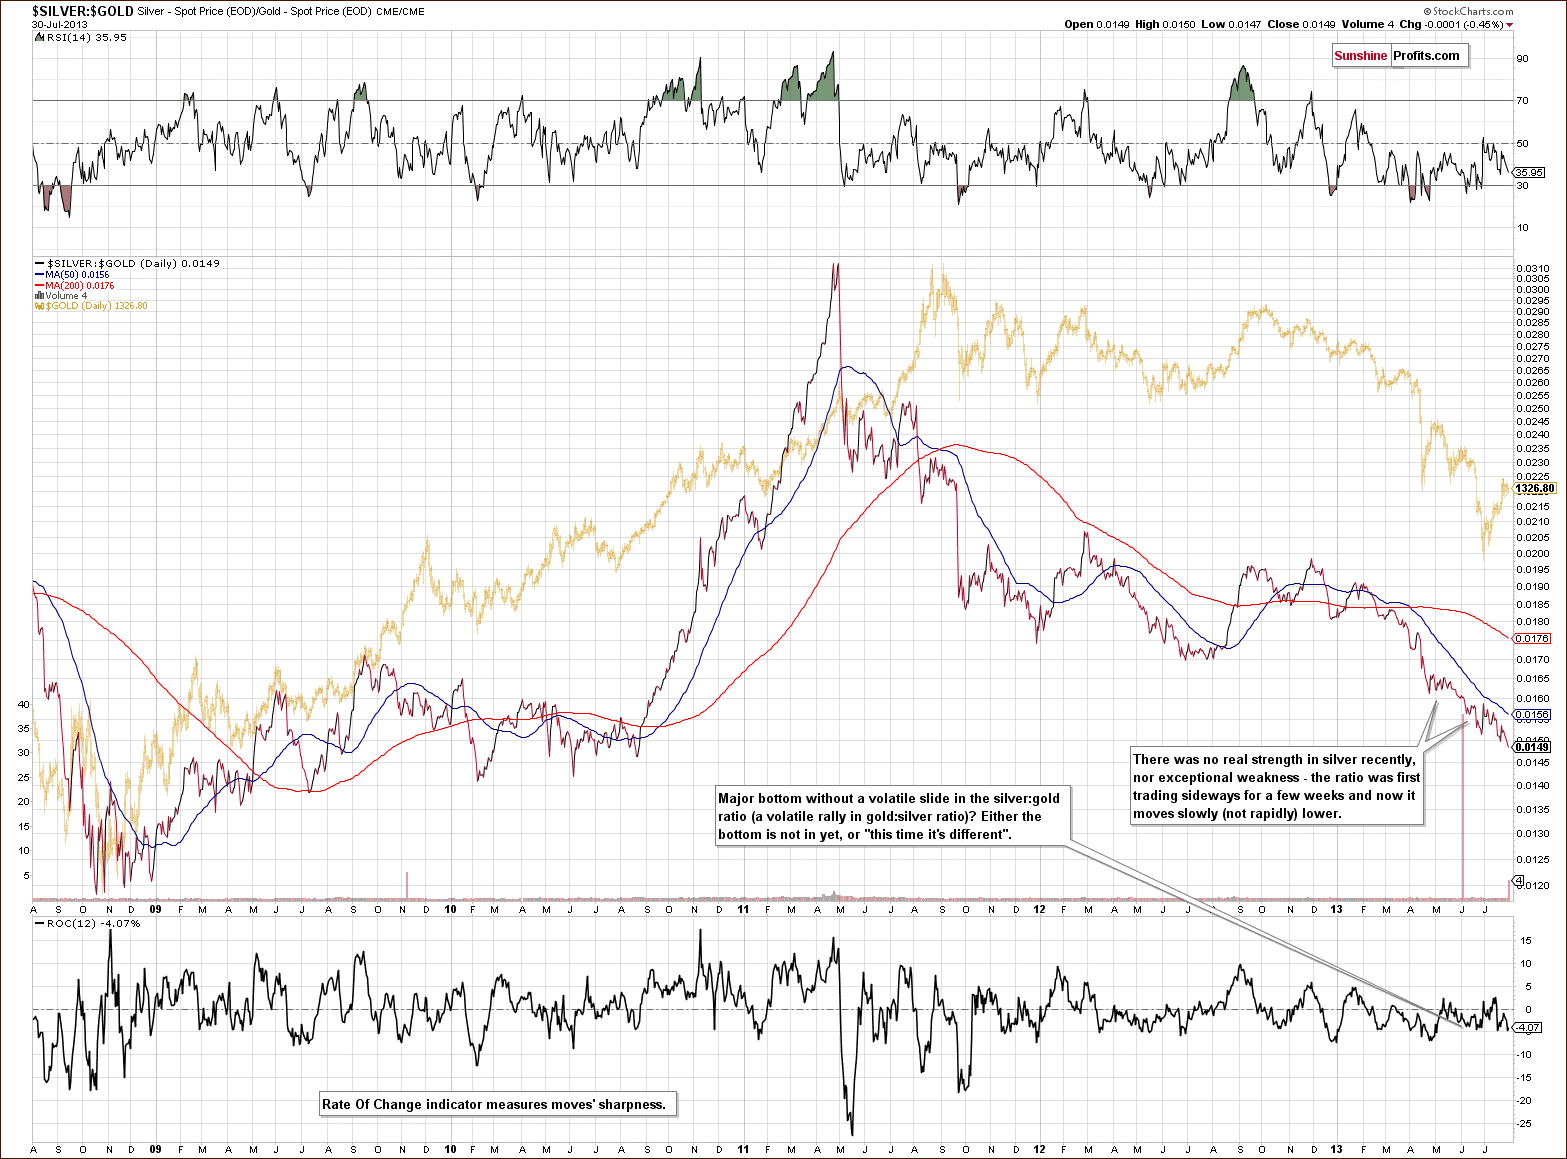
In the silver to gold ratio chart, we still see no signal of a bottom. Silver is likely to sharply underperform gold very close to the bottom based on historical data. We have not seen signs of such action this week, so it seems that the final bottom is still ahead of us. We will move back to the topic of silver’s underperformance in the following part of the update.
Let’s now turn to the medium-term picture.
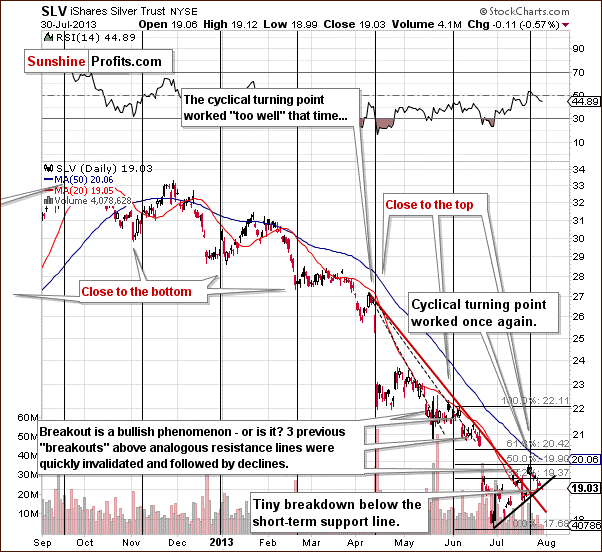
Silver’s recent rally was stopped at the 50% Fibonacci retracement level based on the June decline, and it seems that the cyclicals have worked once again.
As we wrote in our previous Premium Update:
(…) the white metal formed a local top and then declined significantly in the weeks following the cyclical turning point. Right now, we definitely have a previous move to the upside ahead of the cyclical turning point so declines are likely to follow.
All in all, even though we have a breakout above the declining resistance line, we still think that this chart is more bearish than bullish, and the acceleration of the downtrend is still ahead of us.
Please note that the SLV ETF moved slightly below the short-term support line (black line on the above chart). This move is not confirmed, and has only little significance so far, but still, that’s a bearish factor.
Summing up, the outlook remains bearish for the white metal even despite a breakout that we saw recently because of the reliability of past breakouts and also due to the current turning point.
Palladium
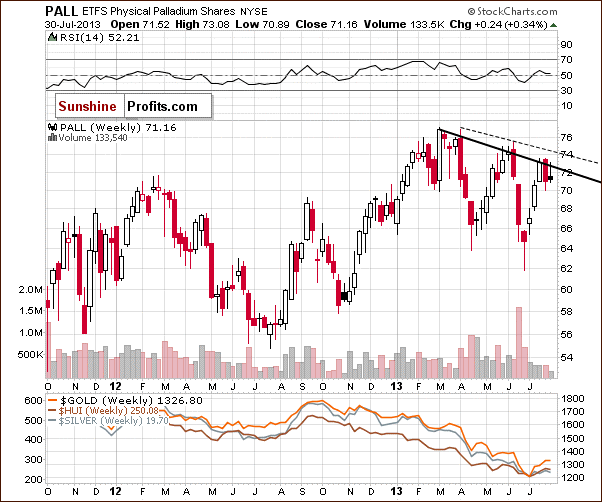
This week we decided to feature the palladium chart as it provides us with interesting clues as to the next possible moves in the entire sector. After all, precious metals usually move together on a short-term basis, even though they may form different formations in the medium- and long term.
On the above chart we see that in recent weeks, palladium continued its rally and reached the declining resistance line based on the 2013 top and the May peak (in terms of weekly closing prices). It stopped buyers and we saw a decline, which took the price to the 70 level last week. Although at the beginning of this week we saw a pullback, the buyers didn’t manage to push the prices above the above-mentioned resistance line. This might result in further declines.
What’s next? In the short term we might see some strength and a small move to the upside, but there is another declining resistance line based on the 2013 top and the May peak (on an intraday basis), which may trigger a correction.
Please note that when we saw a similar price action in the end of March and in late May, gold, silver and mining stocks didn’t move visibly higher. Therefore, even if palladium climbs up once again to the next declining resistance line, it will likely not trigger a significant increase in the rest of the precious metals sector. However, if palladium declines, it seems that it will move the rest of the sector lower.
On a side note, the shape of this relationship is rather similar to the one between gold and crude oil. Both palladium and crude oil are in medium-term uptrends whereas gold, silver and mining stocks remain in a downtrend.
All in all, the implications for the precious metals sector are bearish.
Gold and Silver Mining Stocks
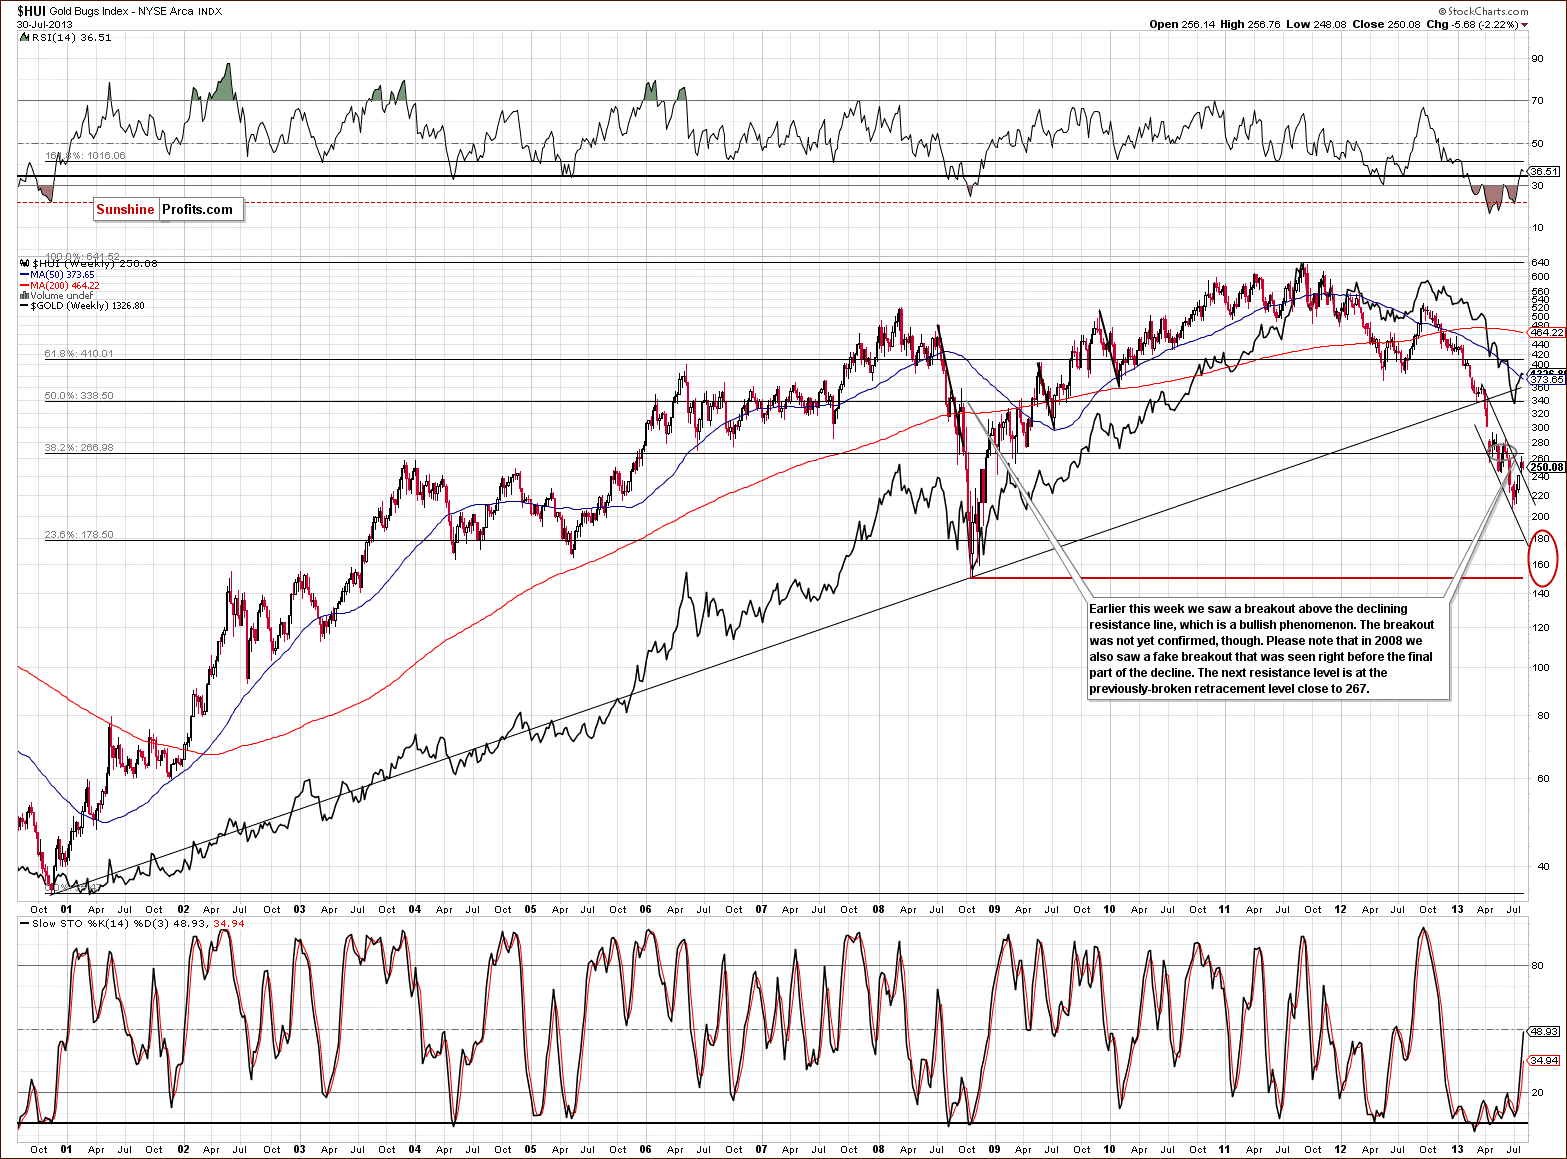
In this week’s very long-term HUI index chart (a proxy for the gold stocks), we see that the mining stocks tried to break above the April bottom but failed, and prices are still below this level. This trading pattern is similar to the one we’ve discussed previously for gold.
As we wrote last week:
Here, we see a breakout above the declining resistance line but no breakout above the key 61.8% Fibonacci retracement level, which was previously broken from above. Prices are still below this level. This means that the breakout already seen might not be enough. (…) In 2008, after a number of different significant declines, we saw prices move higher and surpass the previous declining resistance line. However, this turned out to be a “fakeout” and was followed by a final powerful downswing in prices (that took miners to their final bottom).
From this point of view, something similar could be seen here once again with prices declining to the red ellipse area in our chart. In fact, this appears likely in our view.
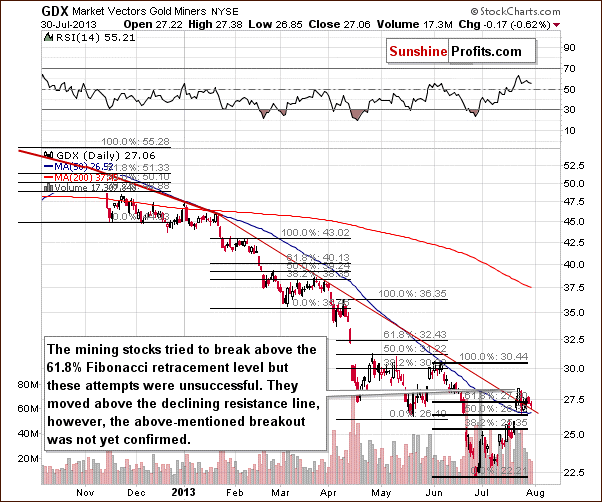
In this week’s medium-term GDX ETF chart, we saw some strength last week which resulted in the breakout above the medium-term declining resistance line. However, the mining stocks dropped in the recent days, and they are slightly above this declining support/resistance line at the moment.
At this point it’s worth mentioning the 61.8% Fibonacci retracement level. As we see on the above chart, the mining stocks tried to break above it, but each attempt was invalidated.
Consequently, we don’t feel there are strong bullish implications yet. As is often the case, it seems profitable (there were numerous times when waiting for a confirmation helped to stay on the correct side of the precious metals market in the past and 3 days seem to be the optimal value for the precious metals market in our view) to wait for confirmation of breakouts before reacting to them and calling it a truly bullish signal.
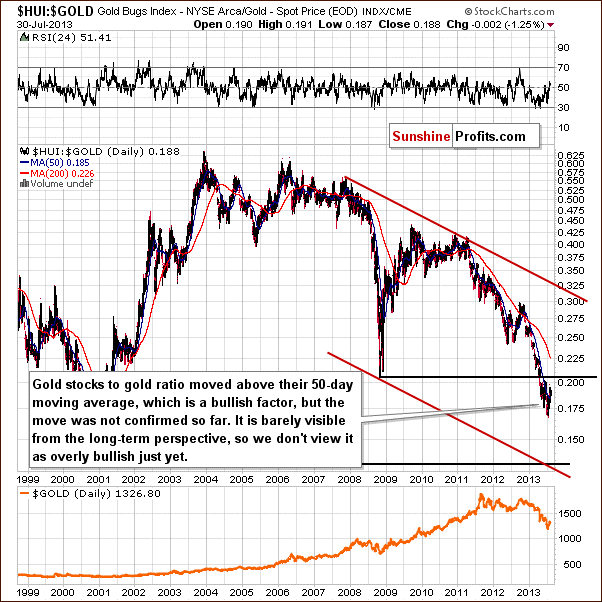
In the gold stocks to gold ratio chart, we don’t see a continuation of strength, thus what we wrote last week remains up to date. Although the ratio moved above the 50-day moving average, the breakout didn’t change the outlook.
As we wrote last week:
It’s a tough call right now to say if the decline in the ratio was really stopped since it is well below the 2008 bottom. The breakdown was not invalidated and the downtrend still appears to be in play here. A downtrend in this ratio indicates that the gold stocks are underperforming gold, not outperforming it.
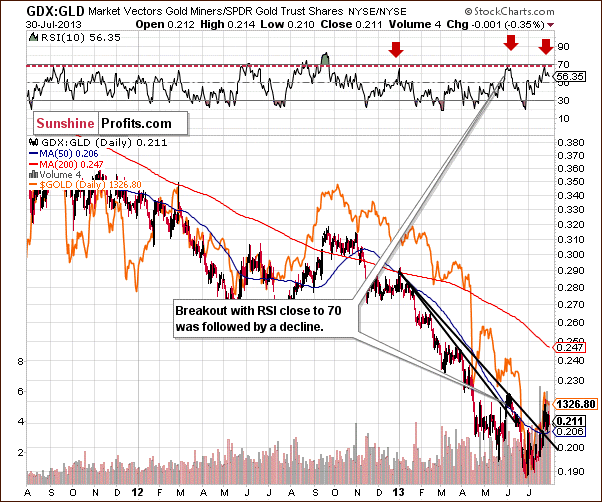
In the medium-term miners to gold ratio chart, we had previously seen a breakout above the declining resistance line as well.
In our previous Premium Update we wrote:
(...) the RSI level in this chart is now close to 70. This level marked local tops this year in the ratio, and the same was seen throughout the precious metals sector. In fact, the last time that we saw this phenomenon was at the beginning of June when silver was at its cyclical turning point – just like it is right now – which makes these two situations even more similar.
On the above chart we see a decline which is consistent with our previous assumptions. Despite the fact that we did not see a huge drop in the recent days, it doesn’t mean that we won't see one in the near future. Please note that we saw a similar price action at the beginning of the June. After the slight decline, there was a major one.
Please note that the previous breakout (in June) was followed by a decline, so the current one is not as bullish as it might seem at the first sight.
Summing up, the outlook for the mining stocks remains bearish, and the trend is still down. The long-term breakdowns were not invalidated, but the short-term breakout above the 61.8% Fibonacci retracement – well, it was invalidated.
Letters from Subscribers
Q: Thanks for your alerts, I am new in this field and learning fastreading your alerts, but please let me know abit straight that what isthe meaning of long term position of Gold $1105 and what do U mean byshort term. I bought some gold for business, when the prices came downin june july, should I sell it now because I am earning good profit init, what is your opinion. Thanks.
A: While we can't provide specific investment advice, it does seem likely to us that gold will move lower in the following weeks. The difference between long-term investment capital (generally 6-month+ investments) and the short-term speculative capital (for positions that are likely to be closed within 1 month or so) stems from our view on precious metals portfolio structuring. We have recently replied to a similar question and our reply included a very short summary of our approach - you can read it here.
Q: When will the gold rates again decrease in Pakistan?
A: Very likely at the same time when they decrease in other markets as well - it seems to us that the next big move lower will be seen within the next few weeks.
Q: I know it's too early at this point, but I think the next order of business is to assess how the last week and coming few days affect your previous bottom targets. I don't mind telling you, things like this want to make me go long with LT - especially if we hit 1250 or 1200 again. Evenif gold gets there (or goes lower) I think the miners are showing increasing strength; I would be real happy getting back in with an HUIof 190/200. Thoughts? Keep up the good work.
A: All the targets that we featured in today's update and those in the recent Market Alerts are up-to-date. Miners are showing some strength and silver is still underperforming. If gold moves to $1,100, but silver and miners don't move to their buy levels, we will view the signal from gold as binding (unless something unexpected happens) and suggesting going long silver and miners as well. Please note that we saw a fake breakout and miner's outperformance back in 2008 (September) before the final part of the decline.
Physical Side of the Market
We have also received an interesting piece of information from our source in the physical side of the market. Scrap gold sales "are almost at a standstill. The used gold and silver stream has surely dried up smelt wise. People waiting on the side lines to sell. A lot of interest in silver at the current price. No one seems interested in gold bullion."
It seems that gold has not only a technical resistance in the form of the April lows, but also in the form of the physical supply waiting on the sidelines. Another interesting thing is the fact that there's a lot of interest in silver relative to gold. Please note that bottoms are formed when the interest dries up or people hate a given asset. The above suggests that we have not yet reached the bottom in silver. We have previously written that bottoms were characterized by silver's sharp underperformance and that we haven't seen this so far and thus that the bottom is likely not yet in. The above seems to confirm this theory. The situation in the silver market can deteriorate further relative to gold as people are not as pessimistic toward the white metal as they are toward gold.
Summary
The USD Index is currently a bit lower than it was when we posted our previous Premium Update and, at the same time, gold is more than $20 lower and silver is about 70 cents lower. The precious metals sector is once again underperforming the USD Index – metals are not responding to dollar’s declines but are responding to dollar’s small upswings. This creates a bearish environment for the precious metals sector and is something that we also saw before the previous huge decline in the sector.
Gold and miners tried to move above their April bottoms but instead verified the breakdown below it by moving up to this bottom and declining once again. Silver continues to underperform and didn’t move close to its April bottom; however, its underperformance is not extreme enough to indicate that the bottom is already in.
All in all, the outlook for the precious metals market remains bearish.
Trading – PR: Short positions in gold, silver and mining stocks. Extra position.
Trading – SP Indicators: No positions: SP Indicators suggest long positions, but the new self-similarity-based tool suggests short ones for the precious metals sector, and we think that overall they cancel each other out.
Long-term investments: Half position in gold, silver, platinum and mining stocks. As far as long-term mining stock selection is concerned, we suggest using our tools before making purchases: the Golden StockPicker and the Silver StockPicker
| Portfolio's Part | Position | Stop-loss / Expiry Date |
|---|---|---|
| Trading: Mining stocks | Short | 273 (HUI), $29.4 (GDX) / - |
| Trading: Gold | Short | $1,356 / - |
| Trading: Silver | Short | $20.90 / - |
| Long-term investments: Gold | Long - half | - |
| Long-term investments: Silver | Long - half | - |
| Long-term investments: Platinum | Long - half | - |
| Long-term investments: Mining Stocks | Long - half | - |
This completes this week’s Premium Update. Our next Premium Update is scheduled for Friday, August 9, 2013. We will continue to send out Market Alerts on a daily basis (except when Premium Updates are posted) at least until the end of August 2013 and we will send additional Market Alerts whenever appropriate. We have prolonged the time in which you - our subscribers - will receive Market Alerts daily for another full month.
Thank you for using the Premium Service. Have a great and profitable week.
Sincerely,
Przemyslaw Radomski, CFA


