- Euro & USD Indices
- General Stock Market
- Copper
- Correlation Matrix
- Gold
- Silver
- Palladium
- Mining Stocks
- Letters from Subscribers
- Are the big time short players still in the market?
- The pros and cons of holding future contracts as medium-term investment
- Are leveraged ETFs safe for medium-term hold?
- Copper - a massive flat top triangle
- Additional information
- Summary
Last week we illustrated how gold should be treated as a special alternative to dollar denominated paper assets. Yet, It is not only the “system-hedge” aspects that determine the value of gold, since supply factors also come into play. There has been a lot of talk about the divergence between the gold physical markets and the financial markets. There are those who spout conspiracy theories how financial institutions (including central banks) are manipulating the gold market (and as someone observed that should not come as a surprise since central banks manipulate bond markets and interest rates every day). How much these statements are true is a separate issue, yet there is in fact some level of discrepancy between the financial market and the real market (which overall in the longer run should disappear). This discrepancy can help us separate short run speculations from long run movements.
After the last huge fall in the gold price one could observe that the physical market was not that shaken. Actually, it was spurred. As Bloomberg reported, the Shanghai Gold Exchange supplied 1098 tons of gold in the first part of 2013 (1139 being the total for the whole 2012 year), which is around 40% of annual gold production (yes, you are reading correctly: during half of the year the Shanghai stock exchange saw trading of 40% of annual production). We see therefore some big volume of gold being traded in the market. Although we have to admit there was a visible slowdown. In April 236 tons were delivered, in May 224 and 180 in June.
What does it tell us? The “fundamentals” do not look very frightening. A recent huge decline in gold was a result of investors backing out of the financial investments (ETF funds etc.). Either they had expected very high levels of inflation, or else were interested in the short run “financial” side of the market. Naturally they are big players, they do influence what is going on in the spot market, as we saw last months. Nevertheless there is still a real part of the gold market associated with physical trades. This is what separates gold from paper currencies. Even if gold loses its value in the end there is a real cushion. Gold can go down, but in the end it does not go to zero, because it is a real commodity that has a certain value. As long as it is a scarce useful resource which cannot be printed there is demand for it. For paper currencies there is no such bottom. Once they start losing their value the limit is the cost of producing paper.
In the case of gold the cost of production is a big part of its value. The main reason for gold being valuable is that it cannot be easily produced. It takes time and resources to mine it. What are he current costs of mining gold? It depends on the producer, but overall the costs of producing one ounce of gold are over 1000 dollars. Andrew Su, CEO at brokerage Compass Global Markets, said last month that costs vary between 1000 and 1200 dollars, but in reality they can even be higher.
Could gold go higher, and at least not stay at even lower prices for months? There are strong supply arguments for it. The supply argument tells us that there are cost cushions against further falls after which gold stays low for a prolonged period of time. Especially in the light of the fact that lots of physical gold is being traded in the market.
For more on the short run analysis let us see the graphs (chart courtesy by http://stockcharts.com.)
USD and Euro Indices
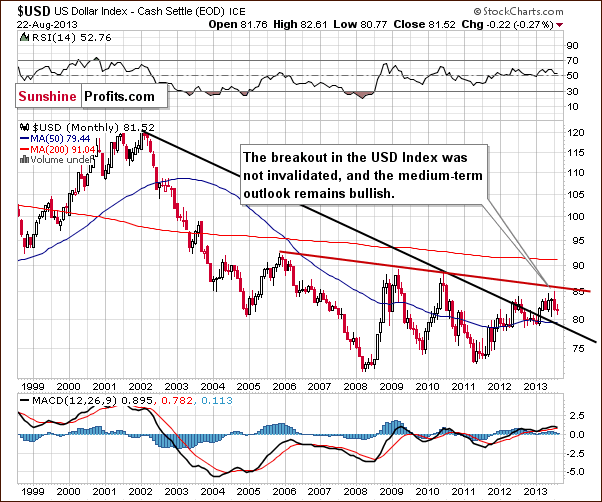
The situation in the long-term chart hasn’t changed much recently.
As we wrote in our last Premium Update:
The breakout above the declining support/resistance line (currently close to 79) was still not invalidated. From this perspective, the situation remains bullish.
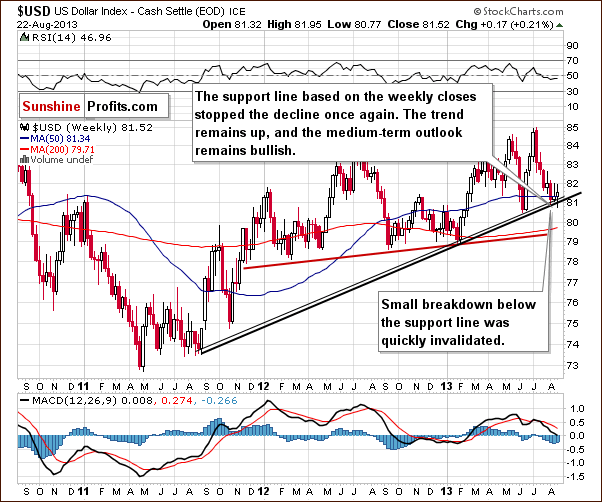
As you see on the weekly chart, the USD Index declined once again in recent days. The medium-term support line stopped the decline however. Although we saw a small move below it, the breakdown was quickly invalidated, which is a bullish signal.
From this perspective, the medium-term uptrend is not threatened, and the situation remains bullish. Therefore we can expect the dollar to strengthen further in the coming weeks. It seems that it will rally sooner rather than later fueling declines in the precious metals market.
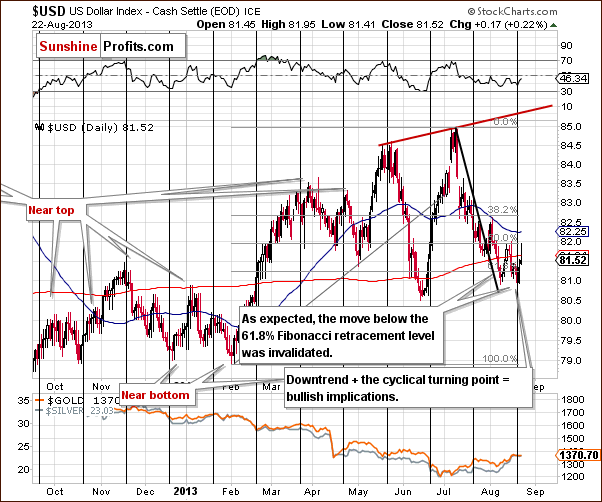
From the short-term perspective, we clearly see that the recent decline took the USD Index below the 61.8% Fibonacci retracement level based on the entire February – July rally once again. Despite this decline, buyers managed to push the USD Index higher, and if the dollar remains at these levels until the end of the week, the short-term breakdown below the above-mentioned Fibonacci retracement level will be invalidated. Technically, it’s already invalidated, but if we get a weekly close above this line, the outlook will be even more bullish.
Additionally, when we factor in the cyclical turning point (that we see after a monthly decline), the outlook here looks very bullish. In fact, it seems that the USD Index already started to move higher right at the turning point.
Let’s now take a look at the Euro Index.
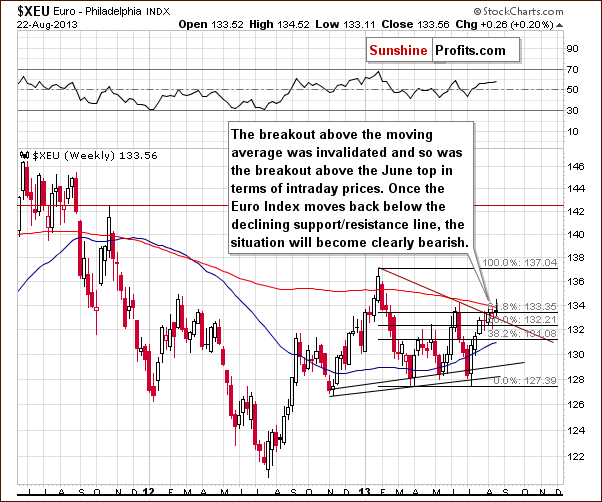
On the above chart, we see that the Euro Index climbed up in recent days and moved above the 200-week moving average and above the June top. However, this increase was temporary, and the breakout was invalidated. The European currency is now back at the 61.8% Fibonacci retracement level based on the January - July decline.
Summing up, the short-term outlook for the USD Index is bullish and will likely trigger a decline in the Euro Index, which – if it declines back below the declining red support line - will make the outlook for the Euro even more bearish. If it happens, the outlook for the USD Index will be even more bullish. This cycle will likely have bearish implications for the precious metals sector as it unfolds.
General Stock Market
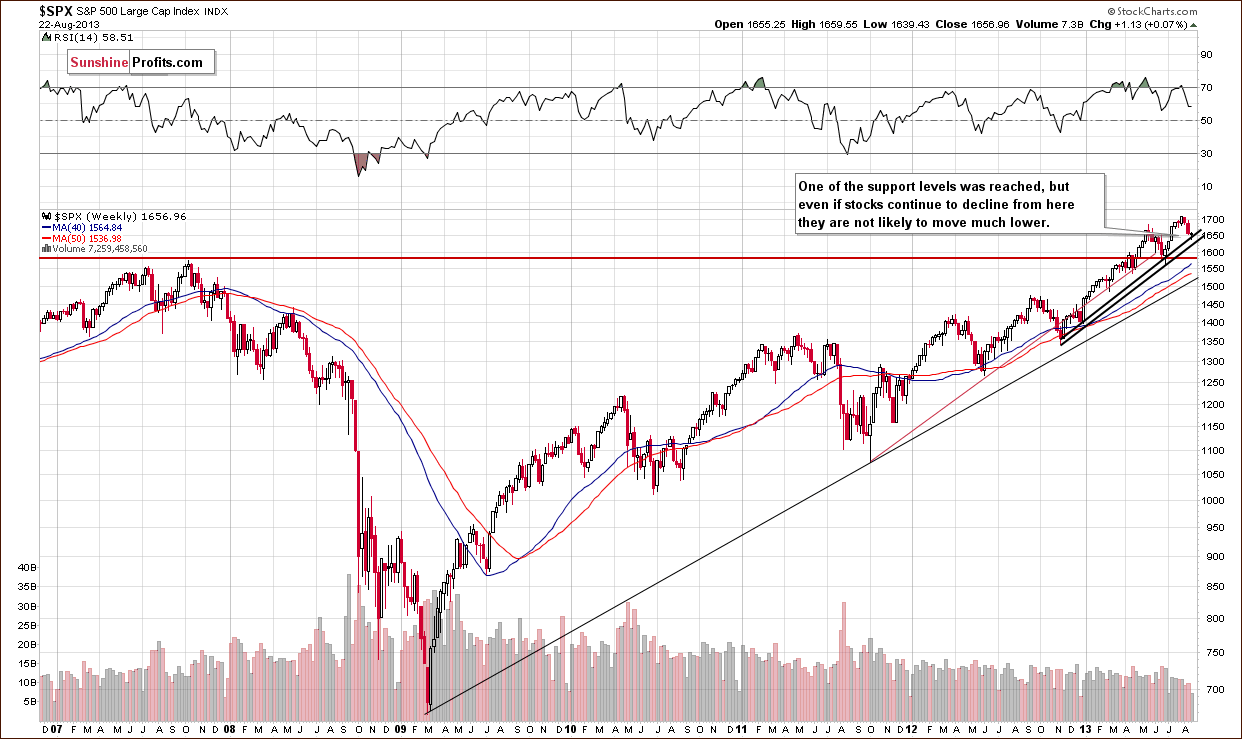
On this week‘s long-term S&P 500 chart, we see that the situation hasn’t changed much.
The correction is still shallow from the long-term perspective, and the S&P 500 Index reached the rising support line based on the November 2012 January 2013 lows (in terms of weekly closing prices).
Please note that there is another rising support line based on the November 2012 -January 2013 lows (on an intraday basis), which may stop a correction even if the current support doesn’t hold. Therefore, the downside seems limited.
Before we examine the Broker-Dealer Index chart to see what the financial sector is doing, let’s take a look at the DIA ETF chart, which is another proxy for the general stock market.
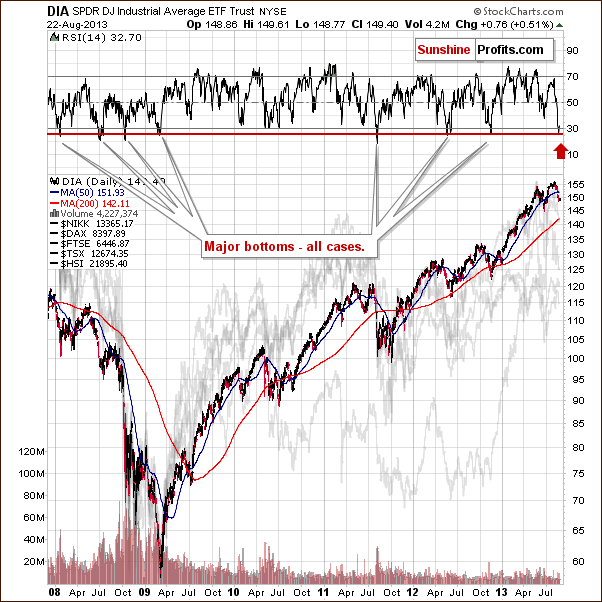
Earlier this week, the DIA ETF moved lower, and the RSI based on it moved below 30 - almost to the 26 level. Since the beginning of 2008, there have been exactly 7 cases when we saw something similar. In 4 of them, this meant that an important bottom had just been formed. In the remaining 3 cases, a major bottom was formed in a short time anyway.
The short-term implications are bullish and the medium-term ones are very bullish.
We turn now to the financial sector, which in the past used to lead the rest of the general stock market.
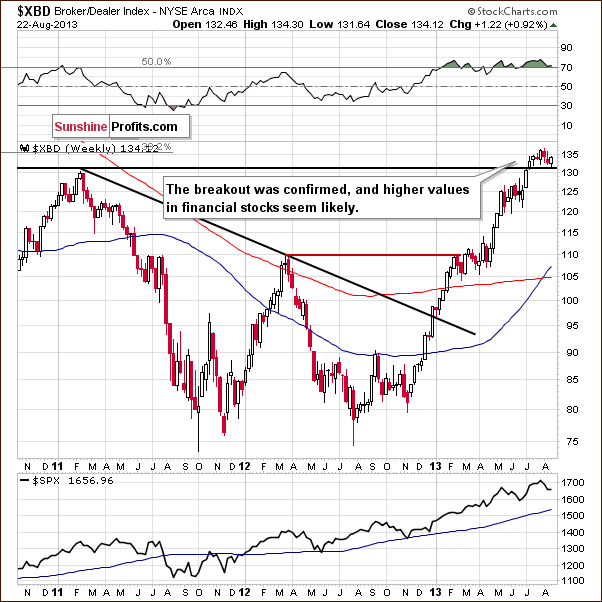
On the above chart, we see that the recent decline took the financials to the previously broken resistance level of 130. Despite this fact, the financials still remain above this level, which also corresponds to the 2011 top, and the outlook hasn’t changed here.
The breakout above the level of 130 has not been invalidated, which will likely lead to further growth in the financial sector and the general stock market.
Summing up, the outlook for general stock market is very bullish in the medium term and more bullish than not in the short term.
Copper
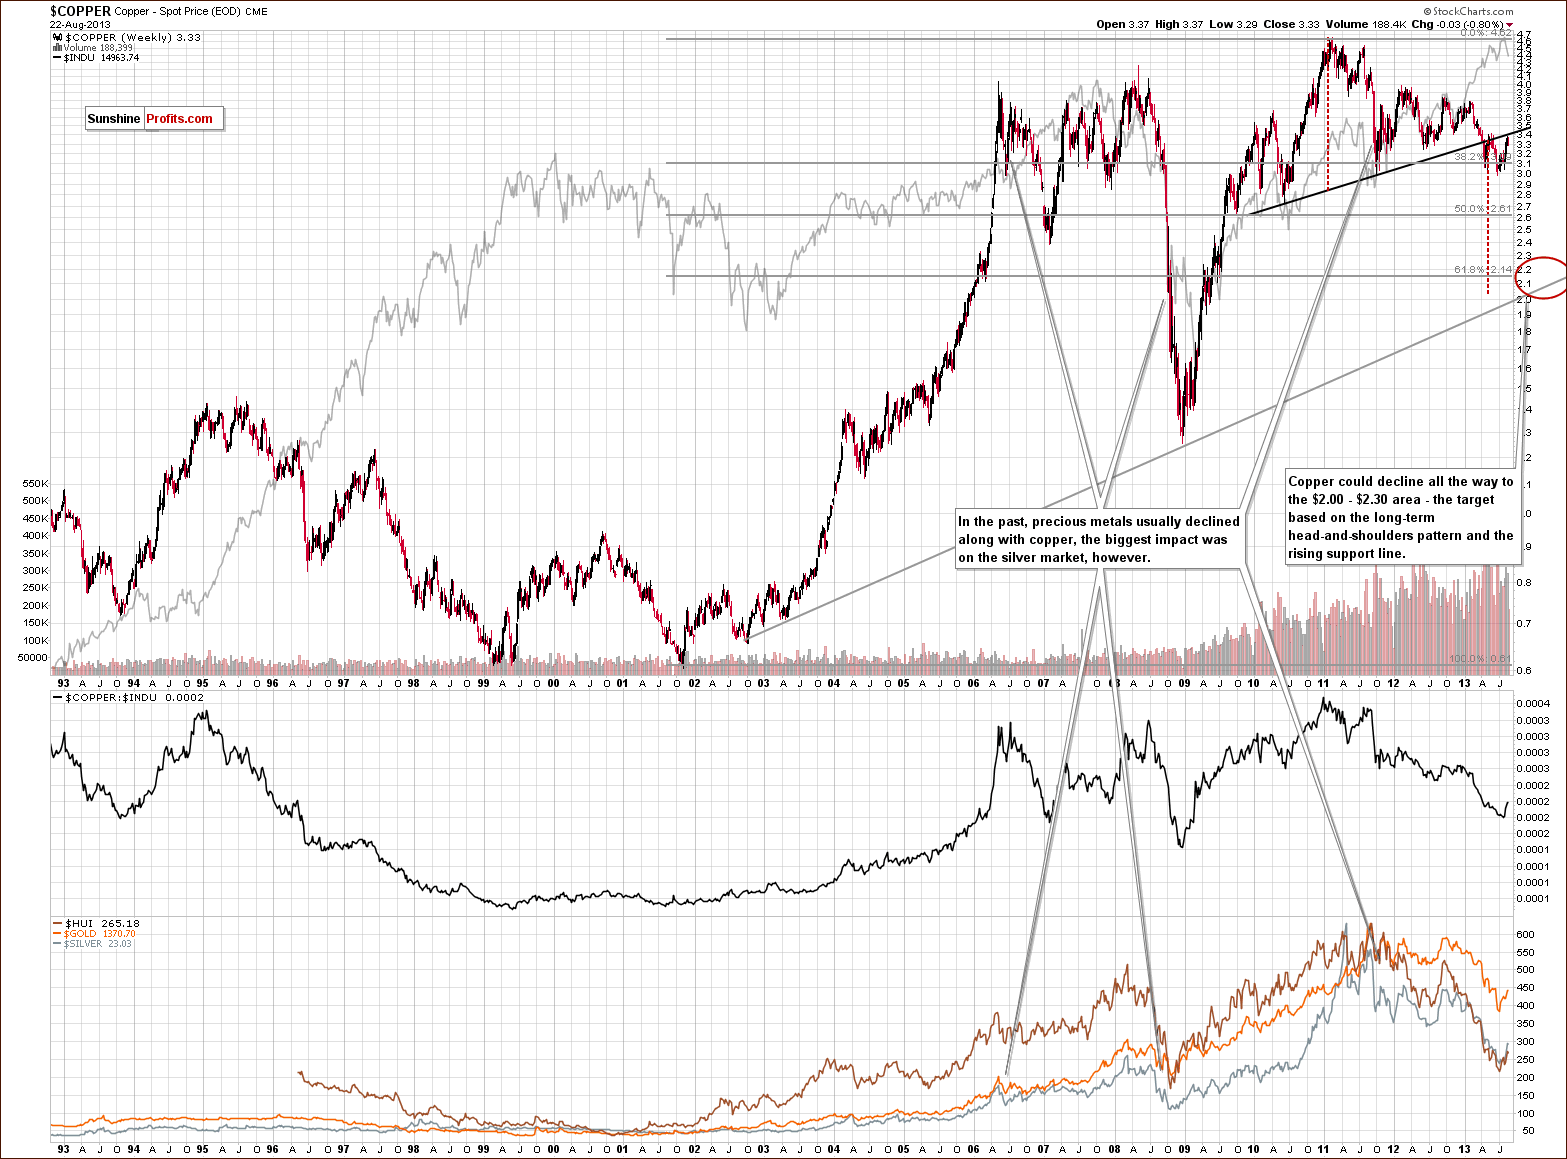
This week we’re moving back to the copper market once again.
In the past few days, we have seen a short-term correction, which took copper to the neck level of the bearish head-and-shoulders pattern. However, there was no breakout above it, and the price of copper declined shortly after it was reached. In other words, this means that nothing has changed as far as the bearish implications of this pattern are concerned.
From this point of view, it was just another correction, which didn’t invalidate the previous large head-and-shoulders pattern or its implications.
Consequently, the medium-term outlook for copper remains bearish.
Gold & Silver Correlations
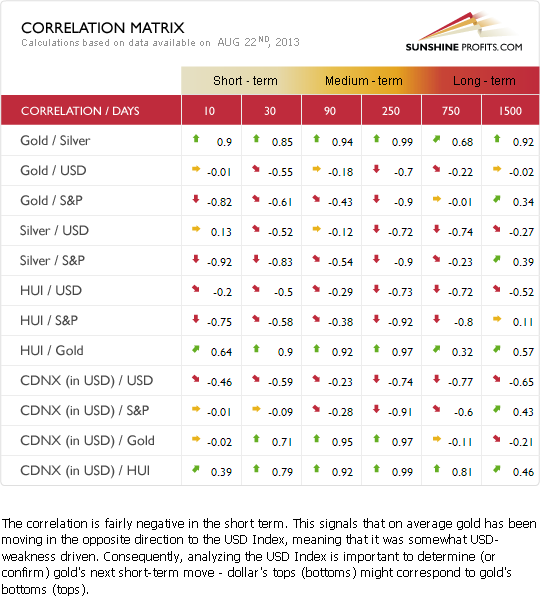
The Correlation Matrix is a tool, which we have developed to analyze the impact of the currency markets and the general stock market upon the precious metals sector (namely: gold correlations and silver correlations).
Basically, there are no changes in the values of coefficients since we commented on them previously in last week’s Premium Update.
The recent strength in gold relative to the dollar seemed to be a very short-term phenomenon lasting only through last week, and we didn’t see a continuation this week. The coefficients based on the previous 30 trading days are still negative. The medium-term coefficients are also negative; however, the 90-day column has a very small, negative value.
The reason for the 90-day column value being so insignificant is that gold underperformed the USD Index for quite a long time; therefore, the implications are bearish anyway.
Generally, the above provides us with a bearish outlook for the precious metals sector because of the medium-term outlook for the USD Index, which is bullish. Since the USD Index just invalidated a small breakdown below the strong support line, its downside seems very limited.
What’s very interesting is that the correlation between silver and the stock market is strongly negative. It’s negative in the short and medium term. This is so interesting because theoretically, silver used to be positively correlated with the stock market most of the time, which you can see in the very long-term, 1500-day column because of silver’s industrial uses. With the bullish outlook for the stock market suggesting higher values, it seems that the outlook for silver is quite negative in short and medium term.
It seems that we will need to see silver moving higher regardless of what the stock market is doing before we can say that another huge up leg is in the cards for the white metal.
Gold
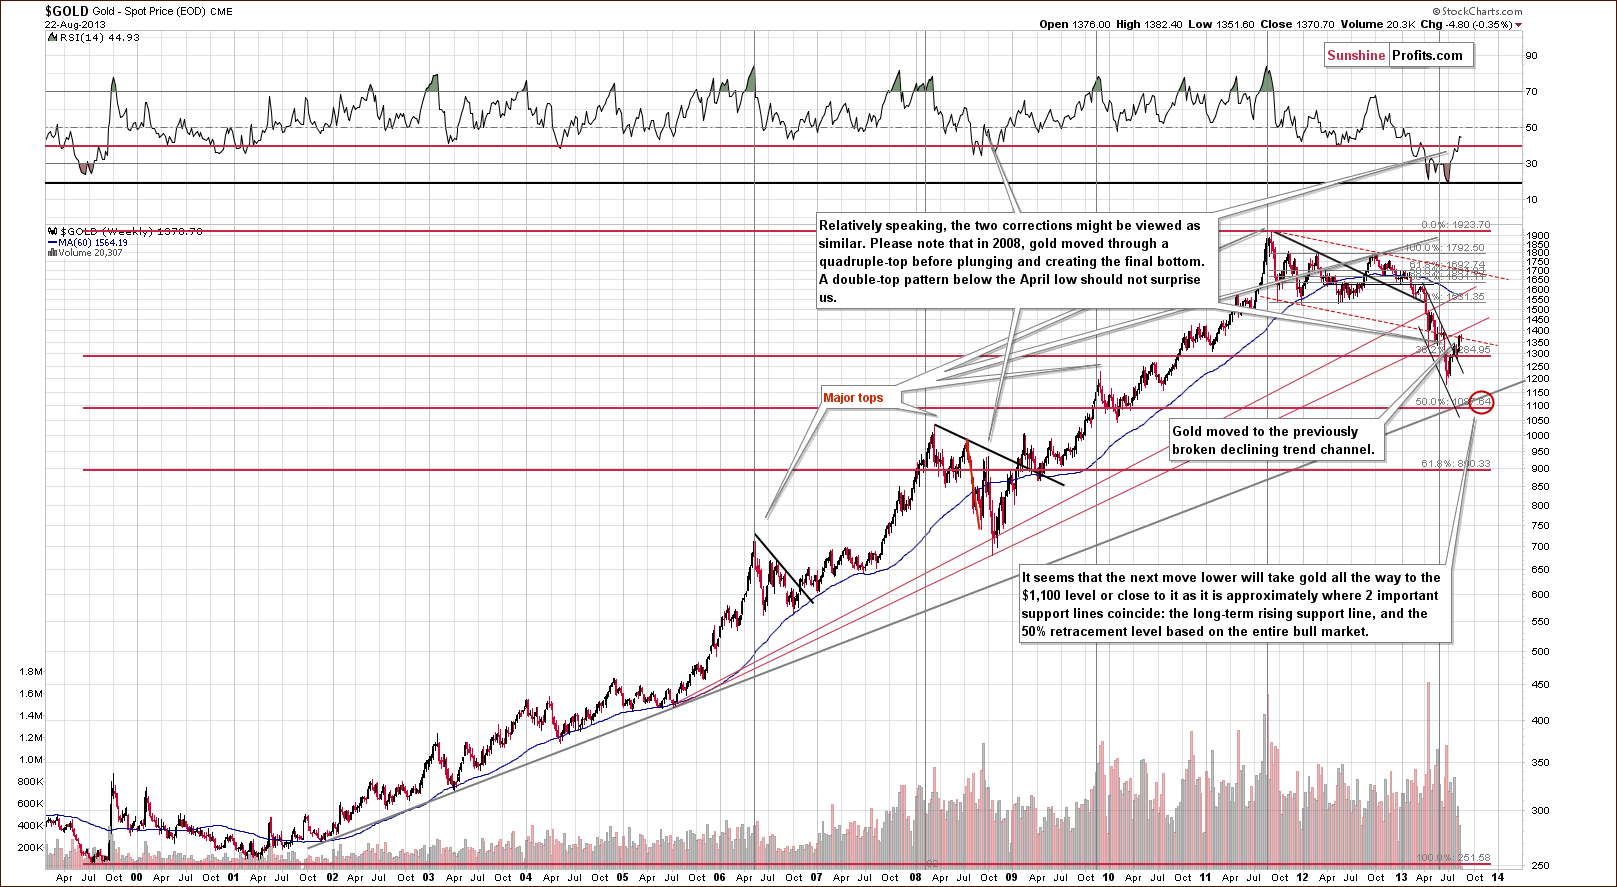
On the long-term gold chart, we see that the yellow metal climbed up and reached one of the resistance levels – the lower border of the declining trend channel. We may see further growth in gold however. Taking into account the current situation in the USD Index, it seems that gold will not move much above its present level before declining.
Please note that, even if gold increases slightly in near term, the medium-term downtrend will remain in place.
Let’s now take a look at the medium-term picture to see more details.
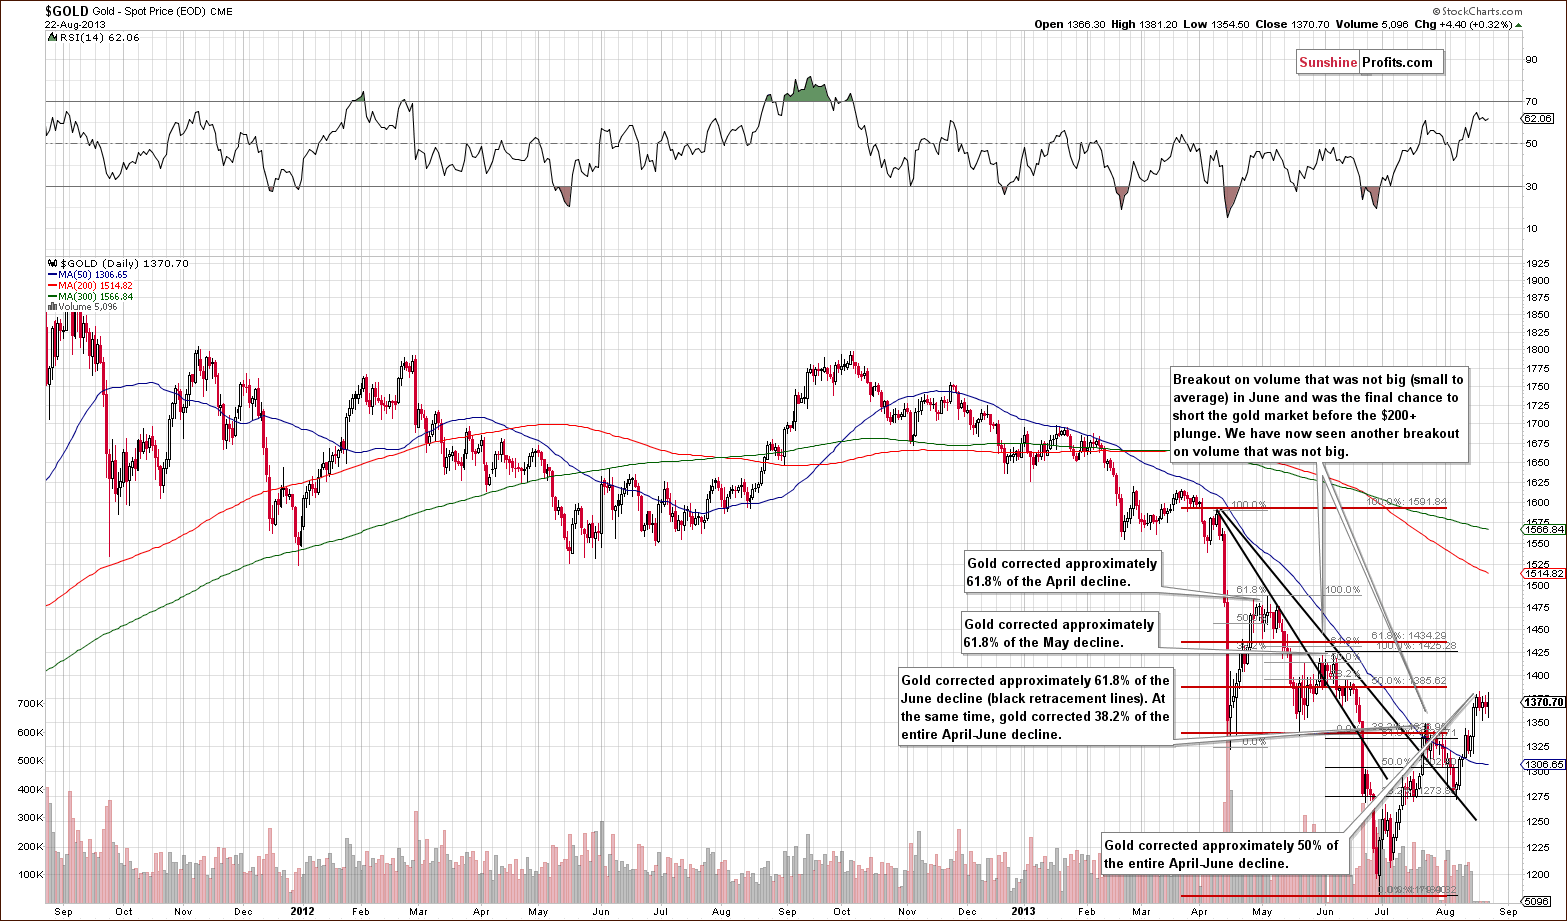
Gold once again tried to move back above the April low, and this time the attempt was successful.
However, when we factor in the Fibonacci retracement levels, we clearly see that the yellow metal almost reached the 50% retracement level, which coincides with the previous top from mid-June (the start of the previous plunge).
From this point of view, we see that even if gold moves just a little higher, this strong resistance zone may keep the rally in check as it further strengthens the resistance created by the rising long-term resistance line marked with red on the previous long-term chart.
With the outlook being bullish for the USD Index, it doesn’t seem that gold will have enough strength to hold the breakout above the April bottom or to move above the above-mentioned resistance levels.
Now let’s take a look at the chart featuring gold’s price from the non-USD perspective.
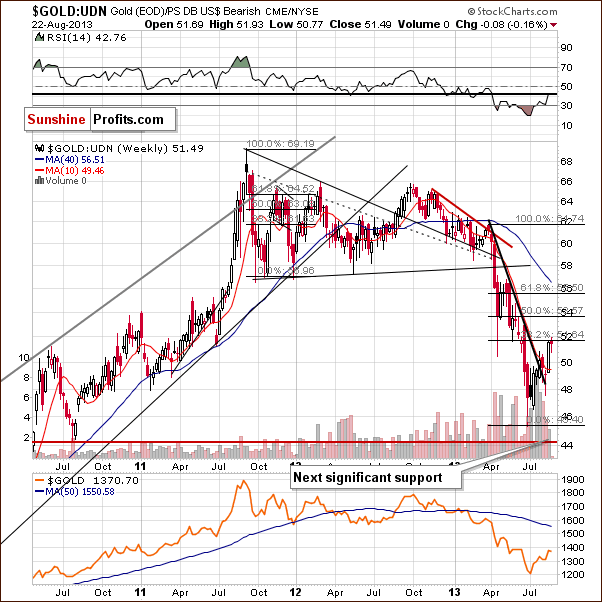
On the above chart, we clearly see that there was a breakout above the April bottom on low volume, which suggests that the breakout may not be too reliable.
It’s worth mentioning that there was a breakout above the April low only when we take the intraday low into account. However, gold’s price from the non-USD perspective is a long ways from a breakout when we take into account the April low in terms of weekly closing prices.
Moreover, the price of gold viewed from this perspective corrected to the first Fibonacci retracement level (38.2%) without breaking above it, which means that the downtrend remains in place.
From this perspective, the situation is mixed at the moment with a bearish bias.
Now, let’s move on to the gold priced in Australian dollar.
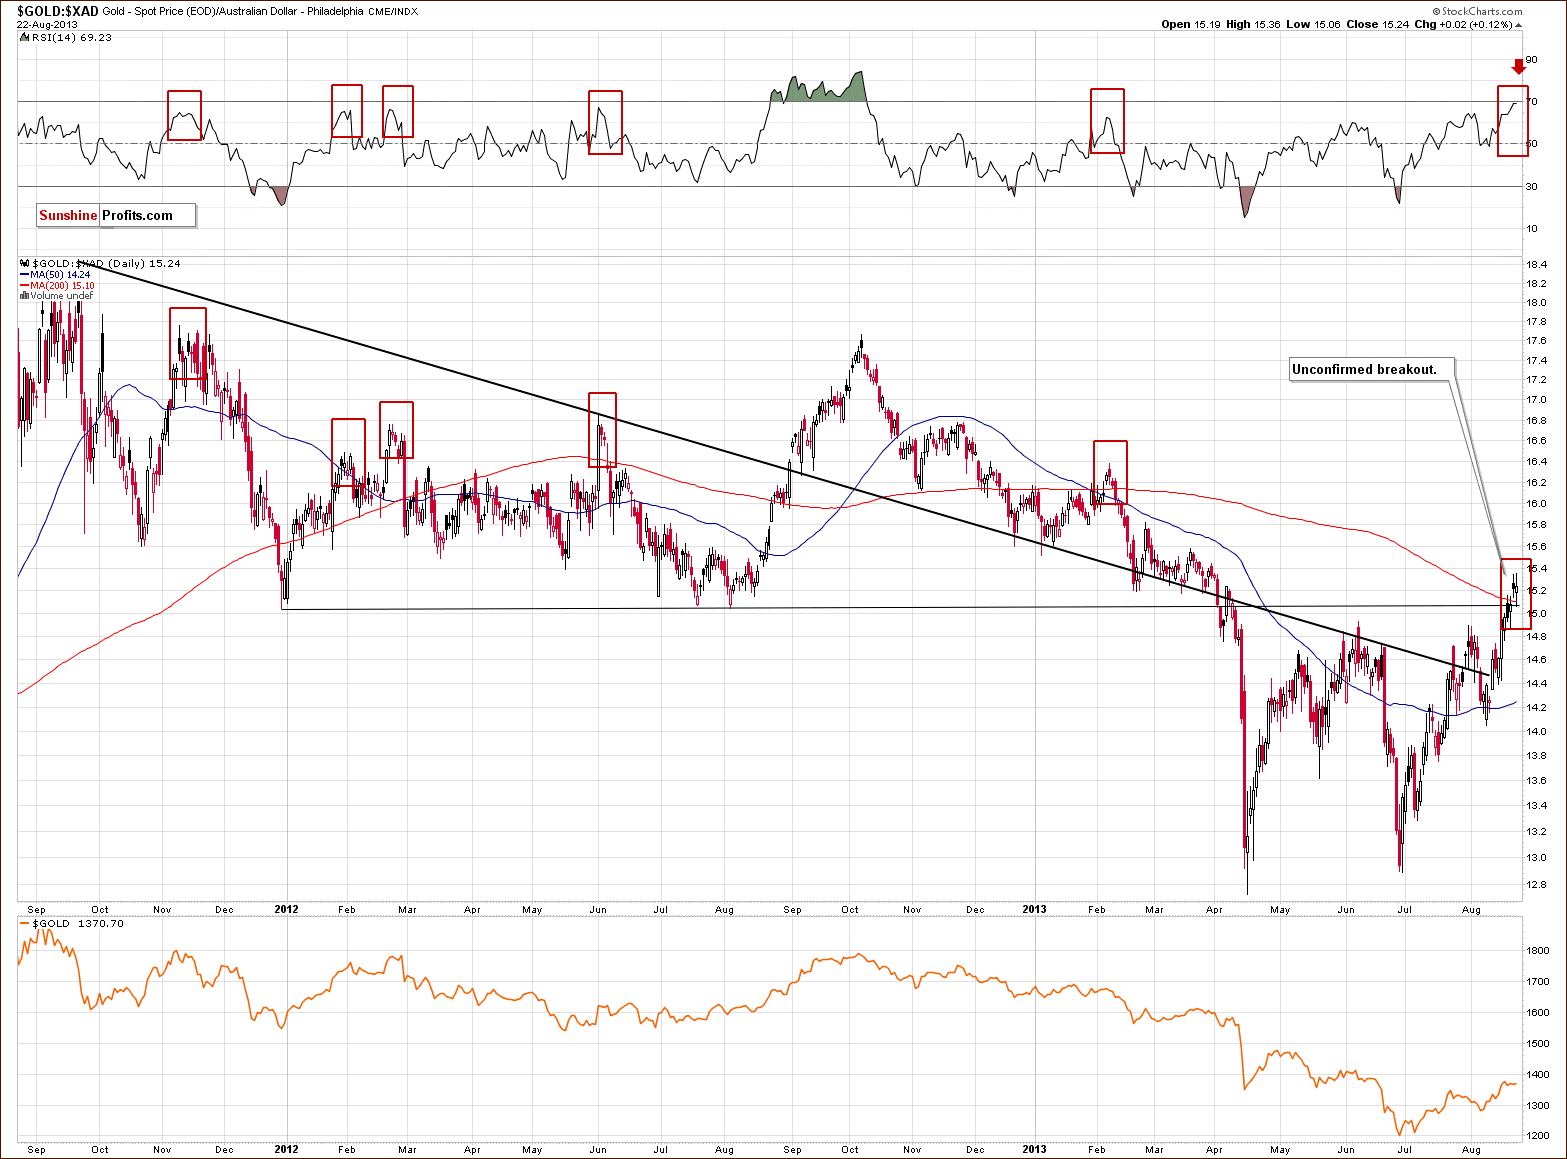
On the above chart, we see that there was a breakout above the strong resistance line based on the December 2011 low and the August 2012 bottom. Despite this growth, the breakout is still not confirmed.
Keep in mind that in the case of gold priced in Australian dollar, high values of the RSI indicator marked local tops even before they reached the 70 level. On the above chart, we clearly see that the RSI is slightly below this level, so the next local top might materialize in the coming days, or we have possibly already seen one.
Let’s examine gold from another perspective – gold priced in British pounds.
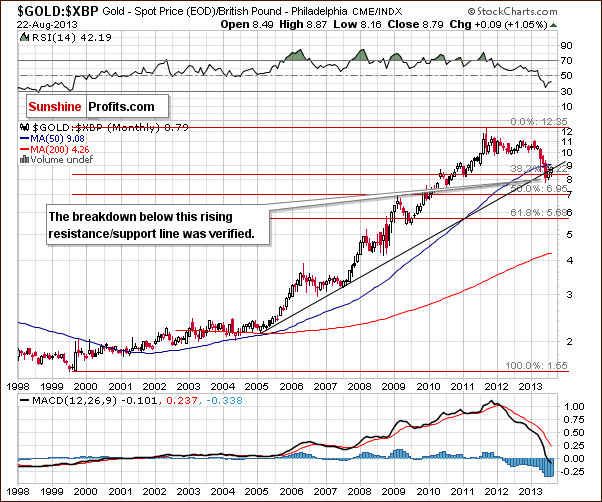
From the British pound perspective, gold closed slightly above the rising resistance line last week. However, earlier this week, it declined below it. From this point of view, it will be more important to see if it closes the month above this line.
Taking into account the recent declines, it seems that we likely have the invalidation of the breakout and consequently, we don’t really view this chart as bullish.
Let’s take a closer look at gold priced in euros.
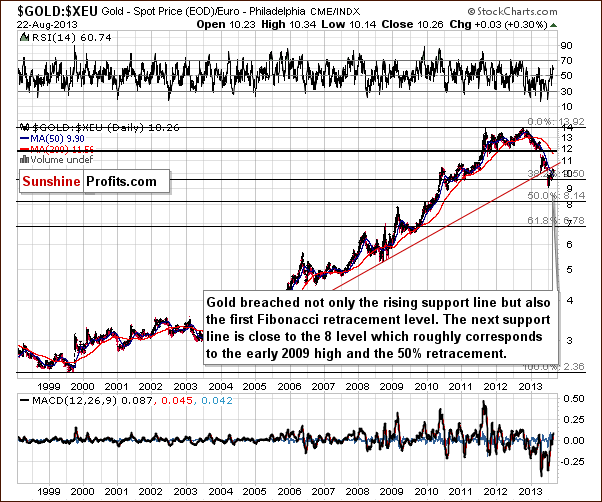
On the above chart, we see that the situation hasn’t changed either. Gold priced in euro remains below the rising resistance line marked with red. Implications here are still bearish.
Summing up, the medium-term outlook for gold remains bearish.
Silver
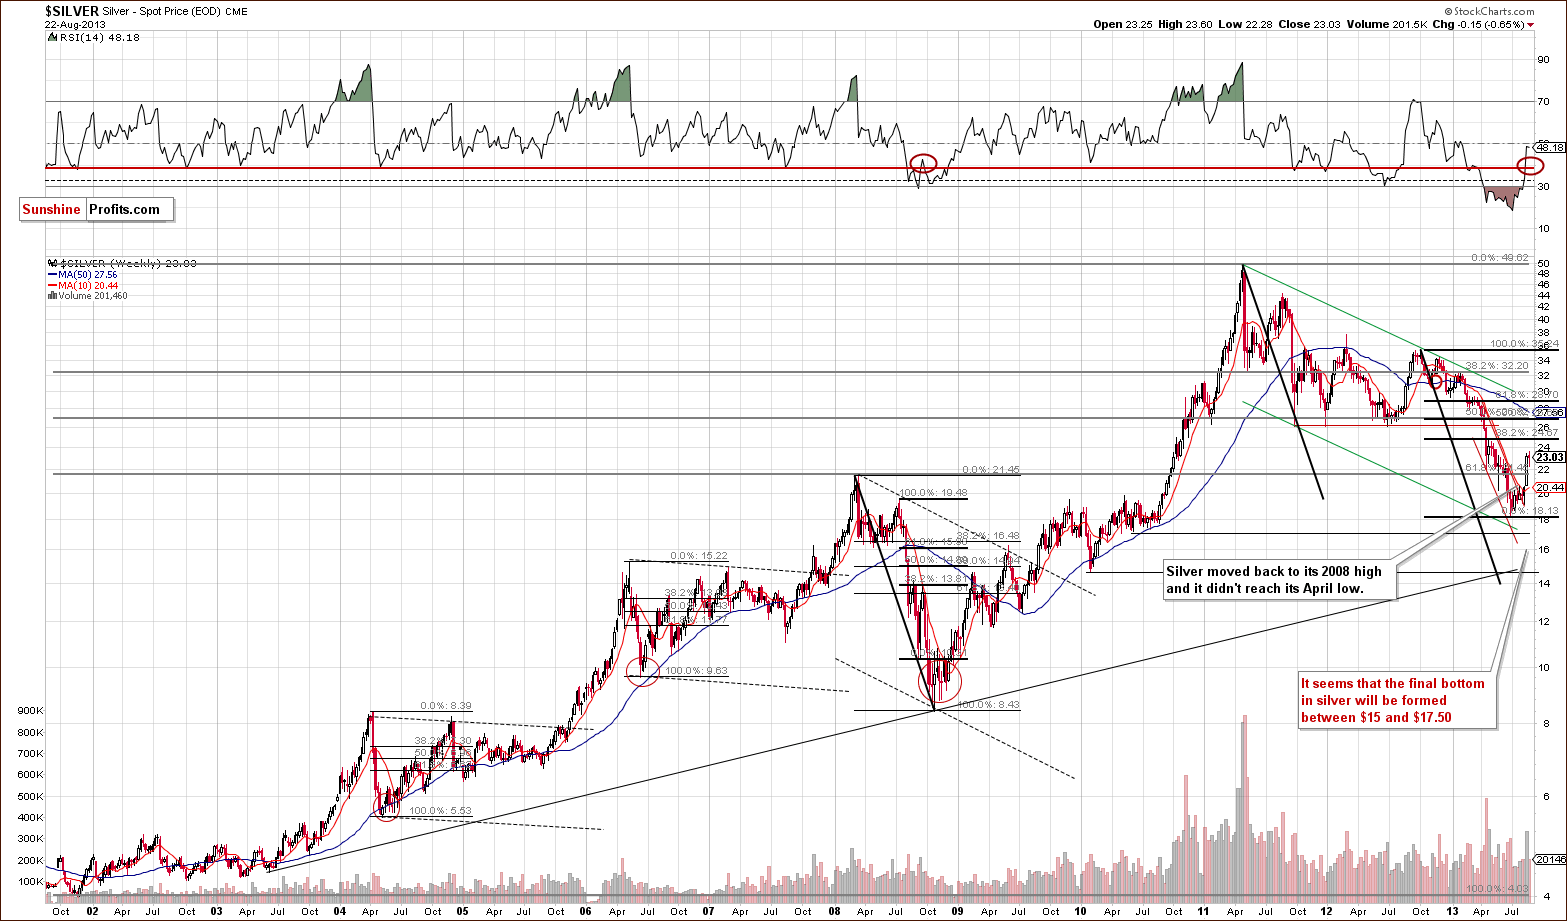
In this week’s very long-term silver chart, we see that silver might climb higher as the analogy to the 2008 decline suggests a 38.2% re-test, but this scenario doesn’t have to be realized. Naturally, history rhymes, but doesn’t have to repeat it self in such a direct manner, especially that we have only one pattern to compare with the current one.
Silver is already at a smaller resistance level that may keep the rally in check. It’s visible more clearly on the short-term chart, so let’s move right to it.
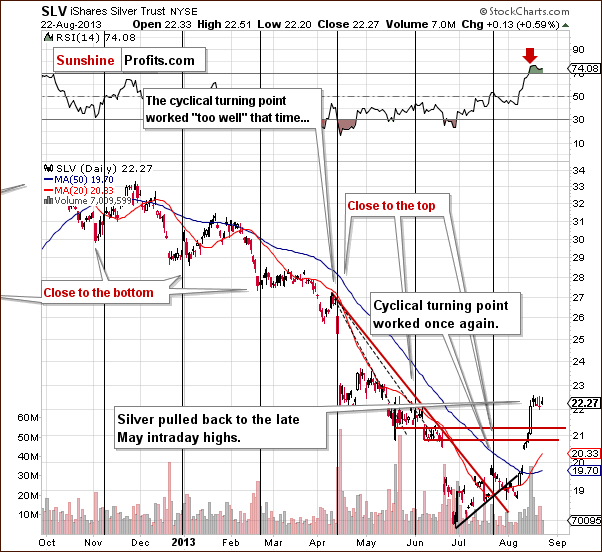
On the short-term SLV ETF chart, we clearly saw significant strength in the previous week. The recent increases have led silver’s price to the late May intraday highs, which now serve as resistance.
Please note, that the RSI indicator is above the 70 level, which means (according to the classical definition) that the top is about to be seen or is already in.
Before summarizing, let’s take a look at the long-term turning points in silver.
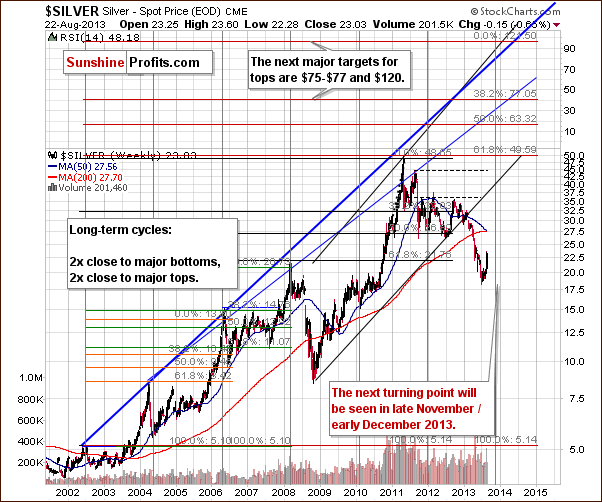
There were two major bottoms and two major tops in the case of this major, long-term cycle. As you see on the above chart, the next cyclical turning point will be seen in late November or early December this year.
This may be where the next major bottom in silver materializes.
Of course this could be a local top and we could see a rally from where we are today, but taking into account other charts (and the negative correlation of silver with the stock market), it seems that the trend is still down, and we will likely see a final bottom close to these dates.
Since the entire precious metal sector tends to move together during major price swings, the above has bearish implications for gold and mining stocks in the medium term.
Before summarizing, let’s take a look at the True Seasonal patterns for silver.
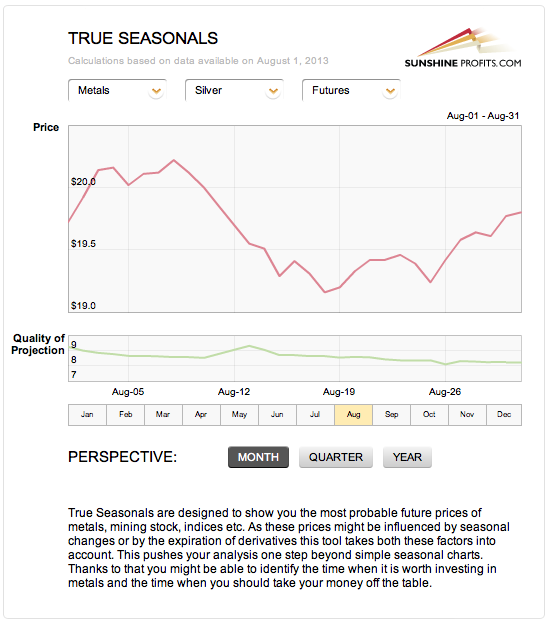
In last week’s Premium Update, we made comments on the gold market and today we would like to feature the silver seasonals. It seems that what we wrote about gold can be largely applied also to the white metal’s chart. The most recent developments seem to confirm the seasonal patterns, at least to some extent (the actual moves might be delayed in comparison with the pattern). The next few days may prove crucial, as they will clarify if the price action is actually delayed compared with the seasonal pattern or if the price will follow the pattern immediately. The first case would suggest a move down in the nearest future, while the second case would imply a move up in the very short term. Either way, it will be worth paying extra attention to how things develop in the coming days.
At this time, it seems that silver’s seasonal decline was delayed – otherwise (meaning if the True Seasonal patterns were to play out in the usual way), we would have likely seen silver’s continued strength relative to the USD Index in the past few days, and this has not been seen.
Summing up, the medium-term outlook remains bearish for the white metal even despite the strength it has shown in recent days. We would like to stress that the bearish outlook is, to a large extent, based on the situation in the USD Index and on the general stock market.
Palladium
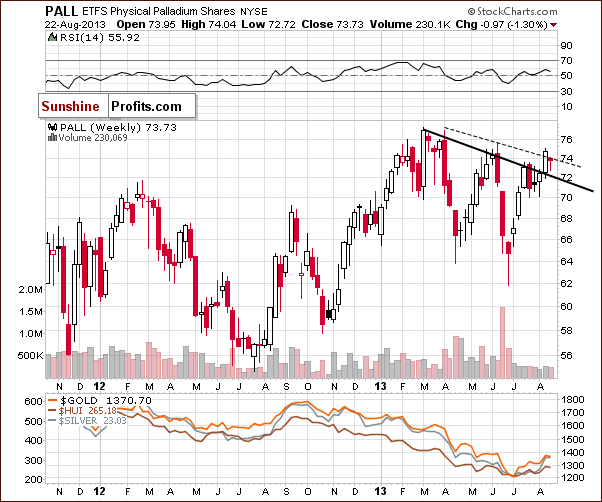
On the above chart, we see that palladium moved above its upper resistance line (marked with a dashed line on the chart) in the previous week. However, the improvement didn’t last long, and earlier this week, palladium moved back below the previously broken upper resistance line.
From this point of view, we have an invalidation of the breakout, which is a bearish signal. This might result in further declines, and the implications for the rest of the precious metals sector are therefore bearish.
Gold and Silver Mining Stocks
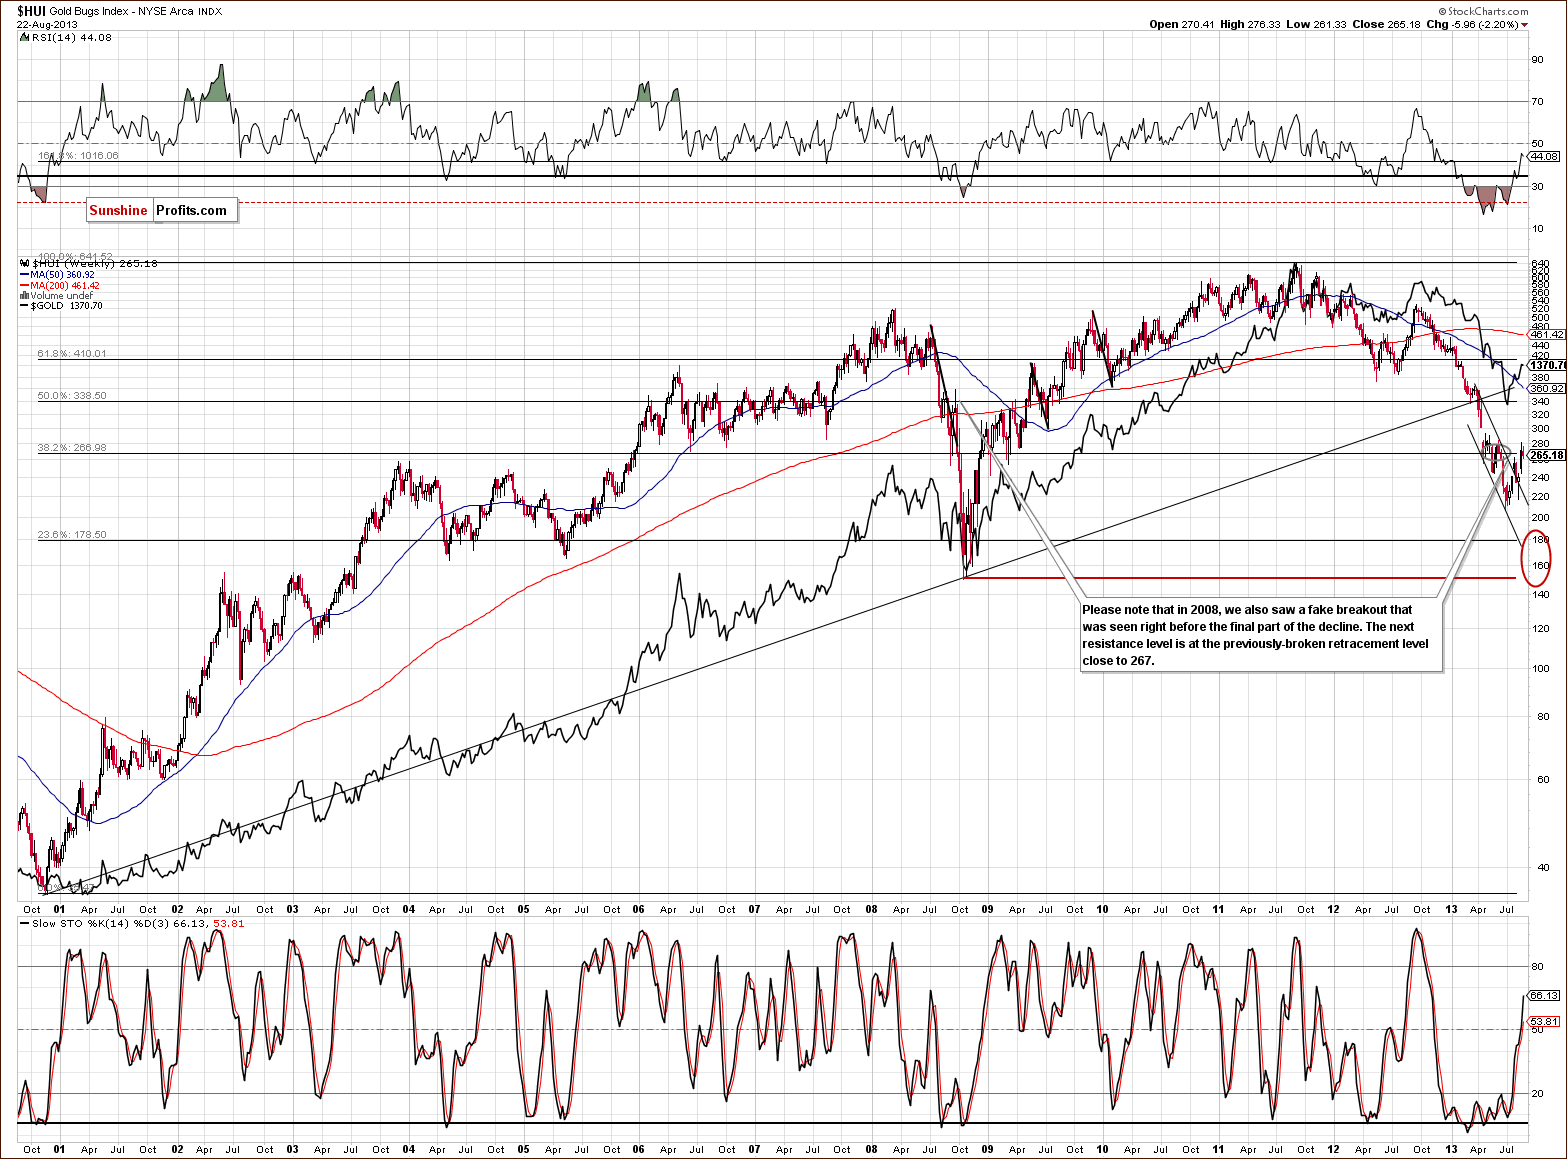
In this week’s very long-term HUI index chart (a proxy for the gold stocks), we saw several attempts, in the past weeks and months, to move above the 61.8% Fibonacci retracement level based on the entire bull market. As you can see, they all failed.
In recent days, we saw another failure, and the mining stocks returned to below the 61.8% retracement level (approximately at 267). In this way, the breakout above this resistance level was invalidated once again.
Implications are therefore bearish once again, and the trend remains down even though we saw a breakout above the declining trend channel earlier this month.
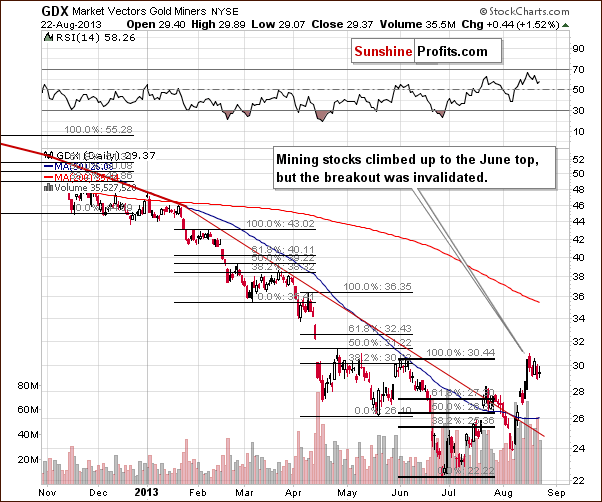
On the short-term GDX ETF chart, we have a confirmation of the breakout above the medium-term declining resistance line, which was a bullish fact by itself and resulted in a move up despite several bearish indications, but it seems that its effect is already behind us.
Similar to the situation in SLV ETF, miners moved to the June top, but the breakout above this resistance level was invalidated. It seems that the local top has already formed, and mining stocks are now declining on increasing volume, which is a bearish factor. Please note that Thursday’s correction materialized on volume that was much smaller than volume seen during Wednesday’s decline.
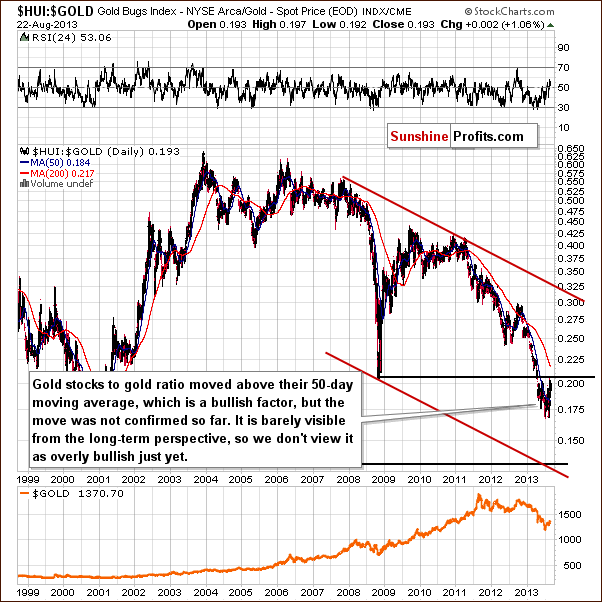
On the above chart featuring the gold stocks to gold ratio, we saw a verification of the breakdown. Recently, the ratio reached its 2008 low, but then slipped below it once again.
From this point of view, the trend remains down, and the recent rally is nothing more than a verification of a major breakdown. Unless the ratio can move above its 2008 low, the above picture will remain bearish.
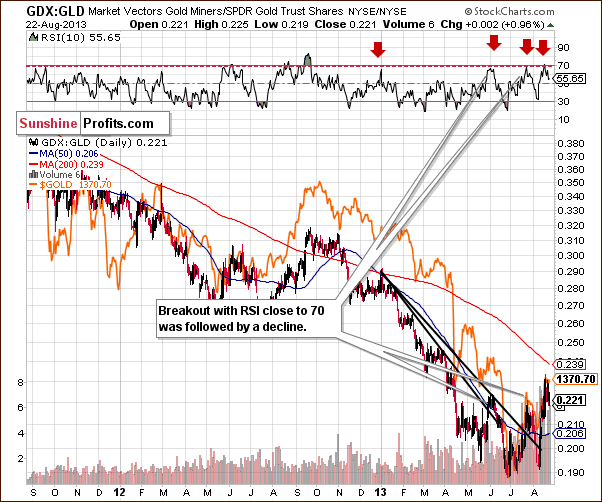
In the medium-term miners to gold ratio chart, we see that since the beginning of the year, every time the RSI indicator reached the 70 level, a local top was formed, and from this point of view, it seems that we have a similar situation at the moment. The recent decline is in tune with the downward movement on the above-mentioned indicator.
Summing up, the outlook for the mining stocks remains bearish, and the trend is still down despite the recent show of strength. The breakdown below the April low was not invalidated, but the move above the 61.8% Fibonacci retracement failed once again. The long-term trend in the gold stocks to gold ratio remains down, and a major breakdown seems to have just been verified.
Letters from Subscribers
Q: Do you think the big players in the silver market have covered their short positions during the past $18.00 silver drop and now are playing a different ball game? Why else wouldsilver move up so sharply? I understand the shorts are covering but thequestion is the big time short players. Are they still in the market?
(…)
A look at the current shorts and longs in todays market as compared to the past $18. market would seem to me to be a good indicator if the shorts have now covered. If they have covered, I think silver is in a good positionto move up to $30.
I have seen statements that silver is now costing miners at least $20./oz to get out of the ground. I have a nephew who was an electrical engineer at a mine that has currently shut down here in the states.
There is also the well worn statement that the mint ran out of silver a few time to mint coins.
A: Some of the shorts in silver were definitely covered, but the question remains if that's enough. Analyzing the way shorts were covered previously - with emphasis on the pace at which it happened - doesn't provide us with bullish implications just yet. We discussed it more thoroughly in our previous Premium Update and we encourage you to read our detailed response here.
Q: Some questions for your kind input:
Whatare the pros and cons of holding future contracts as medium terminvestment when gold/silver finally bottoms in weeks to come? Is using leveraged investment tools genearally not recommended other than forshort term trading purposes.
After gold/silver bottoms, what price movements do youexpect? Would it be a gradual recover or a sharp rebounce in Oct- Dec? Do you see the leg up continuing straight through into March 2014 orpauses around Dec 2013?
A: You can compare the pros and cons of using futures on our page- it's listed as one of the methods. You can compare it to other ways of buying gold and rank them in order of their usefulness for traders and investors. Futures are generally OK for speculative purposes but not for long-term investments. The thing that matters more than the predicted holding period is the amount of capital that you plan to use for the trade. The bigger it is, the less appealing futures become.
We think that after the final bottom an Oct-Dec rebound is likely. However, at this time it's a bit unclear whether the bottom will be reached shortly based on the very long-term cycles in the silver market. I might be the case that we will see gold/silver decline until the final months of the year. We'll keep you informed as the situation becomes clearer.
Q: Are leveraged ETFs safe for medium term hold in the next leg up for gold/silver?
A: In general, if you consider this trade a speculative transaction and do not put too much capital into it - then yes, we think leveraged ETFs are OK.
If you are thinking about entering the market and staying in it until there are signs that the bull market is over (everyone and their brother wants to buy gold and while fundamentals deteriorate) and you are using a large part of your capital for it, then we suggest physical holdings and not ETFs / ETNs.
Please keep in mind that our website includes a ranking of gold and silver ETFs and ETNs that covers over 100 funds.
Q: Should copper confirm the H&S pattern and eventually fall to low2s and accordingly the US Dollar rally and gold reach its final low (although I'm looking far into the future), it seems that copper could then form a massive flat top triangle (since 2006) after rebounding to about $4 after a price decline of copper mimicking 2007-08. Couldn't this perhaps be foretelling of massive inflation on the horizon and PMsrise to uncharted highs? It would seem that this phenomenon could bejust around the corner and, if so, the US dollar will have a corresponding long term decline after fulfilling its current upward run. What do you think?
A: Yes, the above scenario seems quite probable in our view. However, we are not that certain about the long-term decline of the USD Index at this point. The decline in the value of the US dollar in terms of goods and services (inflation) - yes. But whether it will decline in terms of other fiat currencies (USD Index) is not that clear. Other monetary authorities may – and likely will – continue printing their own currencies. It's important to keep in mind that (floating) fiat currencies simply sink at different rates. If they all sank fast but the US dollar sank a little slower, then values of tangible assets (especially precious metals) would be likely to move higher in terms of all currencies, but at the same time the USD Index would move higher.
Additional Information
We hope you enjoyed this week’s trial of the True Seasonals tool, and you saw how powerful it is. You are correct to assume that we will feature it in our Premium Updates from time to time, but we can’t guarantee that we will always focus upon your main area of interest – for instance, individual mining stocks, or the general stock market or the part of the precious metals sector that you are currently trading or investing in.
The True Seasonals tool is updated on daily basis in terms of using the most appropriate derivative whose expiration is currently the most important (futures vs. options vs. stock options). Moreover, each month we update the tool manually to make sure that the seasonal price projections are accurate for all featured sectors/indices/stocks. Consequently, if you’re interested in including the True Seasonal patterns in your analysis (and we suggest that you check it before making any trade), we encourage you to sign up for its full, interactive and daily-updated version. Especially that we just lowered its price and added a promotional offer for the first month - $9.95. That’s just slightly more than a cup of coffee at Starbucks and – unlike coffee – it’s not really a cost, but an investment.
Summary
The USD Index remains at the medium-term support line, and it invalidated a small breakdown this week, which is a bullish sign. The situation on the general stock market is bullish as well, with the RSI indicator based on the DIA ETF moving below the 30 level.
The above creates a bearish outlook for the precious metals sector.
Yes, metals rallied this month. They basically corrected the June plunge. Does it mean that the final bottom is in? No. The long-term charts don’t support this view. In addition to the above-mentioned markets, we have important signals from copper and the HUI to gold ratio, and both are bearish as each simply verified a major breakdown.
The implications coming directly from gold, silver and mining stock charts are not that clear, but they have some bearish implications as well, especially the HUI Index and its inability to hold the breakout above the crucial 61.8% Fibonacci retracement level.
As we mentioned recently while discussing the True Seasonal patterns, if the precious metals sector was about to rally, we should see visible and continuous strength of the sector relative to the USD Index and we’re not seeing it at this time.
Trading – PR: Short position (half) in gold, silver and mining stocks.
Trading – SP Indicators: No positions: SP Indicators suggest long positions, but the new self-similarity-based tool suggests short ones for the precious metals sector, and we think that overall they cancel each other out.
Long-term investments: Half position in gold, silver, platinum and mining stocks. As far as long-term mining stock selection is concerned, we suggest using our tools before making purchases: the Golden StockPicker and the Silver StockPicker
| Portfolio's Part | Position | Stop-loss / Expiry Date |
|---|---|---|
| Trading: Mining stocks | Short - half | 287 (HUI), $31.4 (GDX) / - |
| Trading: Gold | Short - half | $1,393 / - |
| Trading: Silver | Short - half | $23.80 / - |
| Long-term investments: Gold | Long - half | - |
| Long-term investments: Silver | Long - half | - |
| Long-term investments: Platinum | Long - half | - |
| Long-term investments: Mining Stocks | Long - half | - |
This completes this week’s Premium Update. Our next Premium Update is scheduled for Friday, Aug 30, 2013. We will continue to send out Market Alerts on a daily basis (except when Premium Updates are posted) at least until the end of September 2013, and we will send additional Market Alerts whenever appropriate.
Thank you for using the Premium Service. Have a great weekend and a profitable week.
Sincerely,
Przemyslaw Radomski, CFA


