
The arrest of International Monetary Fund Managing Director Dominique Strauss-Kahn dominated the news this week, and as salacious as the story was, for gold investors there was one even more interesting.
The financial blogosphere was buzzing with the news that billionaire investor George Soros has sold most of his holdings in the bullion-backed SPDR Gold Trust (GLD) and iShares Gold Trust (IAU) in the first quarter. According to reports filed with the U.S. Securities and Exchange Commission, Soros bought shares of mining companies Goldcorp Inc. and Freeport-McMoRan Copper and Gold Inc. (FCX). All together Soros sold almost $800-million (U.S.) in gold.
Money managers who oversee more than $100 million in equities must file a Form 13F with the SEC within 45 days of each quarter’s end to show their U.S.-listed stocks, options and convertible bonds. This is how we get to see what the Big Guns are doing.
Soros must have been pleased as punch to take his colossal profits off the table.
Last year Soros described gold as “the ultimate asset bubble” as he kept buying more gold. In a Nov. 15 speech Soros said that conditions for the metal to keep rising were “pretty ideal,” and in January this year, he said the boom in commodities may last “a couple of years” longer.
On the other end of the spectrum, reports filed at the SEC show that Paulson & Co., the U.S. hedge fund run by John Paulson, maintained 31.55 million shares in the SPDR Gold Trust. Not only did Paulson continue to hold his stake in SPDR, but he also increased his interest in miners such as Barrick Gold Corp.
What effect did Soros’s actions have on the precious metals market? While Soros was selling (and it was not yet in the news) the precious metals markets were actually rising. By the time reports leaked that George was selling, the markets had already begun to correct. So, on the face of it, there was very little effect. We would hardly be surprised if we read in the next Securities and Exchange filing that Soros took advantage of the correction to pile into gold again. In any case, Soros’s gold is still just a small fraction of the global gold market. As a measure of gold’s acceptance as a mainstream investment, the SPDR Gold Shares was the second-most-popular E.T.F. in the United States on April 30, trailing only the SPDR S&P 500 fund.
Speaking of selling gold, also making the rounds in the blogosphere this week were articles recommending that the U.S. sell its gold reserves to pay off its massive $14 trilling debt. This week Congressman Ron Paul was asked about the possibility of selling the contents of Fort Knox and he responded that it would be a 'good and moral decision'. While we respect some of Congressman Paul’s ideas, this one seems far-fetched. With about 147 million ounces in reserves the value of all that gold if sold would come to $220.95 billion dollars, which would cover only between 2-3% of the national debt. (Of course, selling off that kind of amount would lower the price.) That would leave the U.S. with a huge mountain of debt and little of offer as collateral.
Meanwhile, a Bloomberg report stated that sales of gold coins are on track for the best month in a year and this during a commodity rout. The U.S. Mint sold 85,000 ounces of American Eagle coins since May 1 at the same time that the Standard & Poor's GSCI Index of 24 raw materials fell 9.9 percent. History shows that the last time sales reached that level, bullion rose 21 percent in the following year. In a Bloomberg survey of 31 analysts, traders and investors the median estimate for gold was that the yellow metal gold will advance 17 percent to a record $1,750 an ounce by Dec. 31 and keep gaining in 2012.
Currency depreciation is the “unofficial” policy of today’s monetary leaders, both the American Federal Reserve and the central banks of other countries. Gold is doing what it is supposed to be doing--its price is adjusting upward in correlation to the depreciation of fiat currencies. We believe that governments will continue to debase the currencies and therefore gold still has a long way to go.
In 1928 George Bernard Shaw wrote: You have to choose between trusting the natural stability of gold and the honesty and intelligence of members of the government. And, with due respect for these gentlemen, I advise as long as the capitalist system lasts, to vote for gold.
And, if you’re still worried about Soros’s sale of his gold holdings, the next item should cheer you up. The World Gold Council yesterday reported that China’s total annual gold demand topped 700 metric tons for the first time ever last year and is expected to keep rising over the next decade. China is the second-largest gold-consuming market in the world. China’s gold demand has grown by an average of 14% per year since deregulation of the gold market by Chinese authorities in 2011. Much of the demand is due to concerns about inflation. Keep in mind that China’s market is still in the neonatal stage since it has only been a decade since deregulation. There is still plenty of room for Chinese consumers to catch up with the West.
By the way, gold prices have skyrocketed over the last decade but have you adjusted your insurance accordingly or is the personal jewelry in your home under-insured? This might be something you might want to look into.
To predict how precious metals will behave in the short run, let's begin this week's technical part with the analysis of the Euro Index. We will start with the long-term chart (charts courtesy by http://stockcharts.com).
Euro - USD Indices
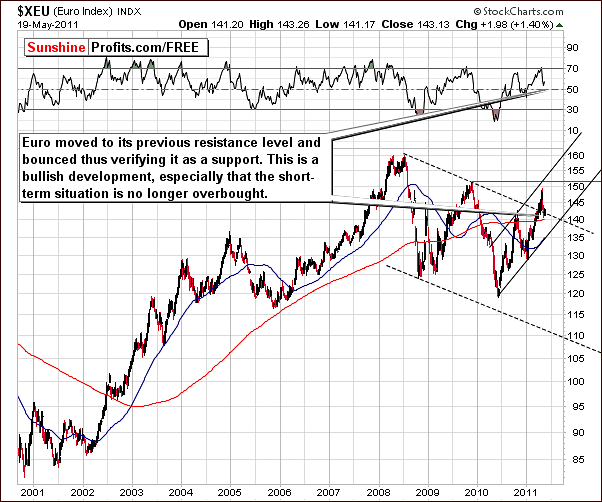
In the long-term Euro Index chart this week, index levels have moved above the resistance line, declined soon thereafter and verified this line as support. This is a very bullish development. Additional bullish phenomenon is seen in the RSI level which is no longer short term overbought. This implies that a rally from here is quite likely. We also note that the index moved below the support line but then quickly reversed; thus what we have seen so far is nothing more than a verification of the breakout. Again, this is bullish phenomenon, not a bearish one.
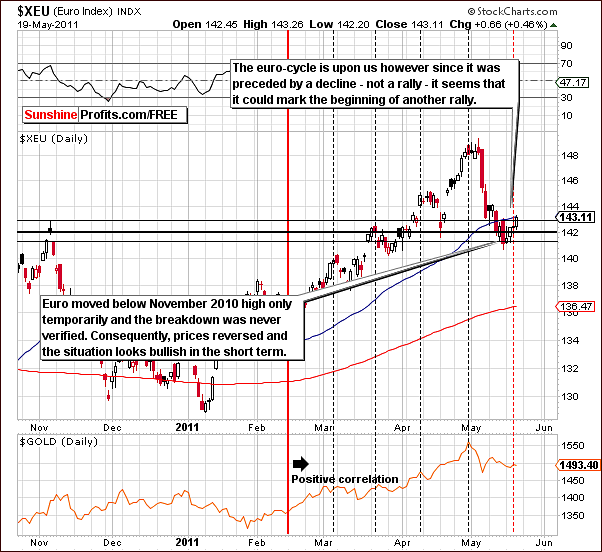
In the short-term Euro Index chart, we see that the price moved below the level of the November 2010 high and then rallied soon after. Generally, it is a sign of strength if price moves below a support line but quickly invalidates the breakdown – and this is what we have seen right now. Although not a certainty, it appears that a rally from here is likely.
Short-term cycles for the euro as well as for gold are in play at this time and with previous move being to the downside; it seems likely that moves to the upside will be seen next.
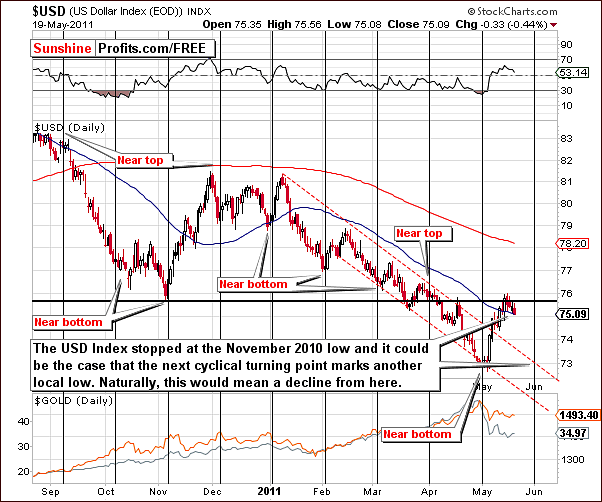
In this week’s short-term USD Index chart, the situation is bearish as would be expected with the Euro Index in a bullish trend. Here we see that the dollar did not move above the November 2010 or March 2011 lows and also did not reach the level of the mid-April high.
It seems that the most likely time that we will see the next bottom appears to be the end of May / beginning of June. This will likely correspond to turning points in the precious metals sectors as well. Please keep this date in mind; we will get back to in at the end of this update.
Summing up, even though it appeared that the breakdown in euro has materialized, waiting for a confirmation has once again proved to be the right decision as prices reversed soon after that. The outlook is bullish for the euro and bearish for the dollar.
General Stock Market
In the long-term general stock market chart this week, we had an unusual situation early in the week. In our Message sent on May 17th 2011, we stated the following:
Stocks have in fact moved below their short-term support lines, but that's not enough to make the situation on the general stock market bearish. Stock may have moved below the short-term support, but the long-term support holds.
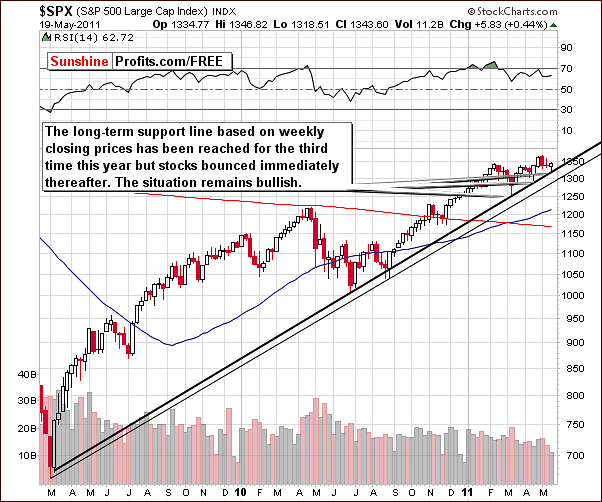
During the rest of the week, stocks generally moved in an uptrend, bouncing off a long-term support line. This is a bullish development and the trend going forward is therefore bullish as well.
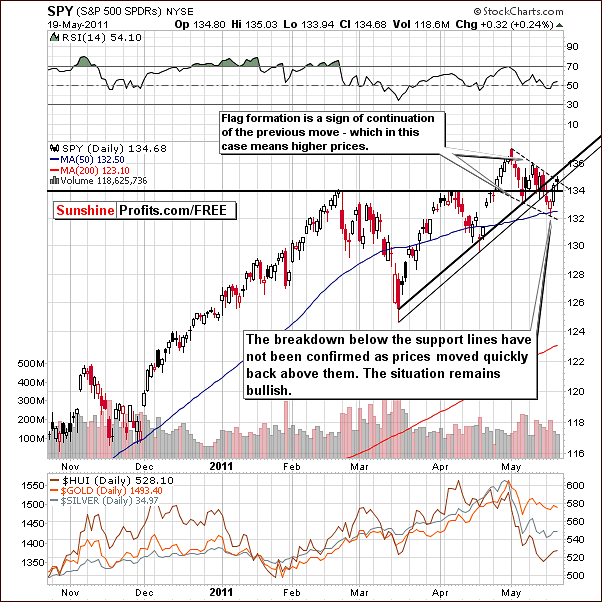
In this week’s short-term chart, we see that prices moved quickly above the level of February highs and also moved above the lower of two rising support lines. In an important development, we can now see what appears to be a flag formation which often results in a continuation of the trend, which in this case is positive. Prices normally rise in roughly the same amount as the increase seen prior to the beginning of the pattern. In this case, such a move would result in about a $4 increase in the SPY, and this would correspond to a target for Dow Jones Industrial Average close to 13,100.
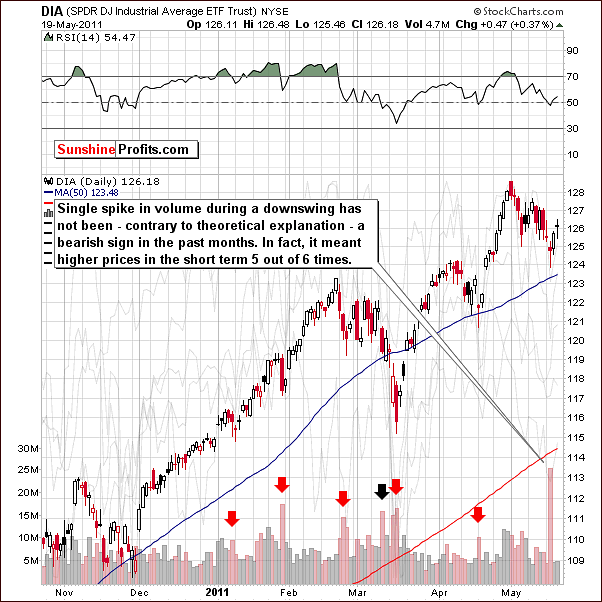
This week we have included a DIA ETF chart, which is a proxy for the Dow Jones Industrial Average. Here we see a flag pattern as well but more importantly a huge spike in volume. This has been seen a number of times in the recent past and in 5 of the 6 times marked in our chart, it meant a local bottom, not a local top. This is therefore a bullish phenomenon especially with the price turnaround seen on an intra-day basis.
The situation looked somewhat precarious earlier in the week but then reversed direction and moved higher later in the week. Again, the situation remains bullish.
Summing up, the sentiment is quite bullish at this time for stocks and it appears that the DJIA appears to be headed towards 13,000 and beyond with the next likely target at 13,100.
Correlation Matrix
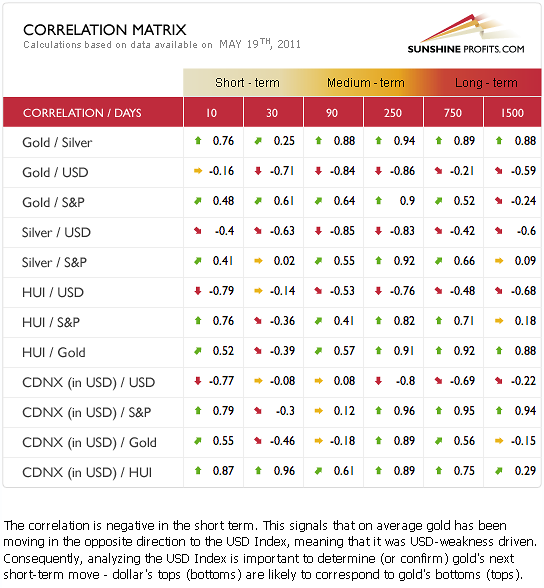
In this week’s Correlation Matrix, we did not see many changes. The situation remains positive for the general stock market which leads us to believe that a rally in gold is quite probable and appears worth betting on. Stocks continue to provide a positive influence on gold and to a lesser extent upon silver and gold stocks.
Generally, the opposite is true for the long term (750- and 1500-day columns) as gold mining stocks as well as silver appear to be more highly correlated with the general stock market than gold itself. Please note, however, that this has not been the case recently (30-day column) and consequently stocks’ rally is an important bullish factor for Gold Investors.
The USD Index is still the key to the current situation in precious metals. The negative correlation with gold and silver is significant in the short term and in the medium term as well for gold stocks. The euro appears poised to rally, and the implication is a positive impact on precious metals at least for the short term.
Keep these points in mind as you read the upcoming sections on gold, silver and gold and silver mining stocks. As the dollar declines, precious metals are likely to move higher and if this is not seen, then it is likely that their rally has run out of steam. In such a situation, we would not advise betting on higher prices for precious metals regardless of the price levels they would reach. We will continue to monitor this situation and advise you accordingly.
Gold
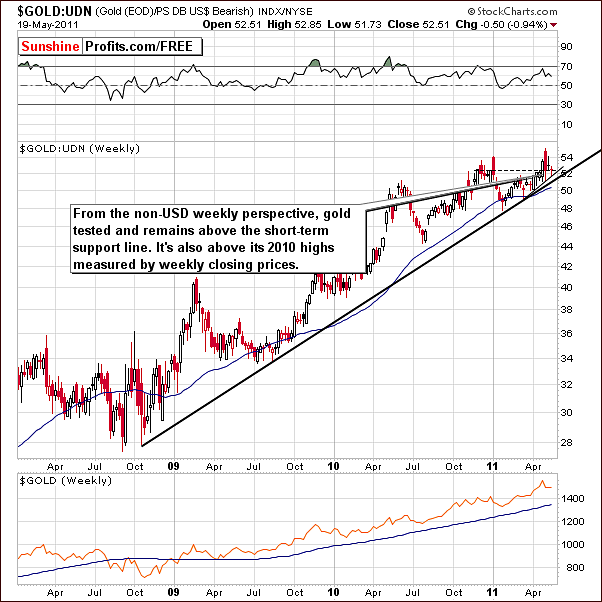
We begin our gold section this week with the long-term chart which looks at gold from a non-USD point of view. We do this is order to put gold’s current short-term volatility into its proper perspective. This week saw index values decline and subsequently bounce back to just above last Thursday’s closing level of 122.
It appears that we have simply seen a testing of the short-term support line, a verification of its support and a move to levels slightly above the 2010 highs based on weekly closing prices. The outlook therefore remains bullish and the price action seen in 2011 is actually now creating what appears to be a very bullish cup-and-handle pattern which indicates the possibility of a strong rally from here. This does not appear to be highly likely at this time but such a rally simply cannot be ruled out based on this week’s signals from the non-USD chart.
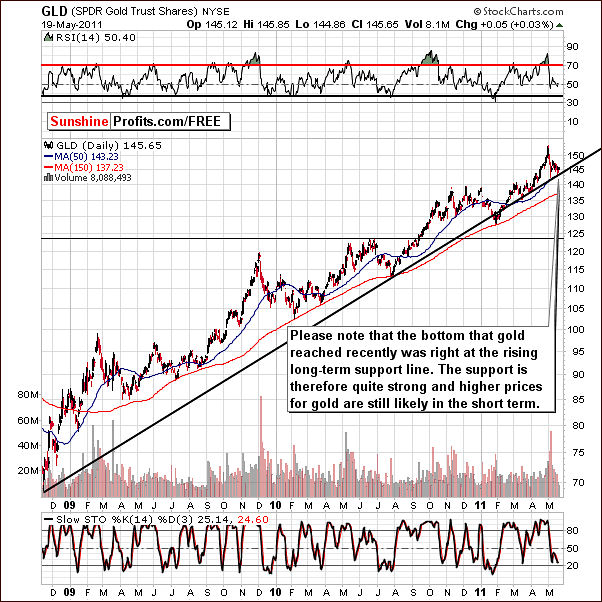
In gold’s long-term chart from the USD side, we see that the trend remains up. Recent price declines here were stopped by the long-term support line and the outlook still appears to be bullish at this time. Low volume levels on days with rising prices are generally a cause for concern but that may not apply in this case. Let’s take a look at the short-term chart for more details.
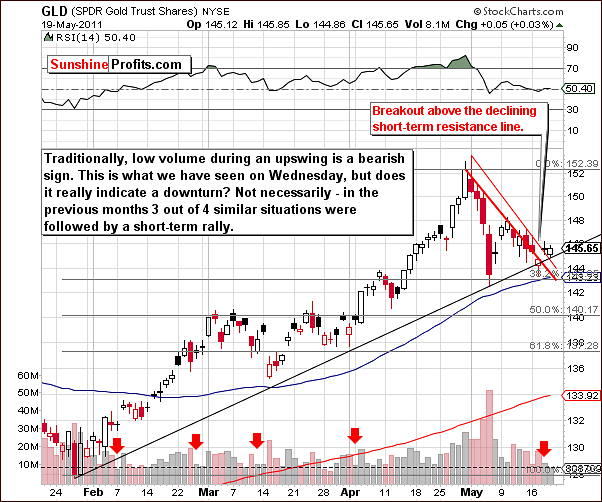
In this week’s short term GLD ETF chart, we see a number of signals which are worthy of mention. Volume levels were small on Wednesday when price levels rose, which contrasted with high volume and declining prices on Tuesday when the short-term support line was reached. Technical analysis generally yields negative sentiment with the type of price/volume action we have just described.
The case however is simply not as bearish as it would seem and it seems somewhat premature to state that buying power is drying up. We note four previous examples of similar cases (rally on small volume preceded by a decline on big volume) in this chart within the past several months. In 3 of the 4 situations, a short-term rally followed and for this reason, the situation does not appear to be bearish at this time.
A breakout above the declining short-term resistance line has actually taken place in the past two days. In fact, the resistance lines based upon daily closing prices and daily highs in our chart were both surpassed on Wednesday and the move held on Thursday. This is overall a bullish development.
In view of what was seen in previous corrections, it appears that the GLD ETF could move to the level of previous highs or even higher. This would be about a $30 or slightly greater move for gold ($149 or so for the GLD ETF and $1530 - $1540 for spot gold).
Still, if the dollar declines and gold fails to rally, we may at that time issue a sell alert to exit speculative positions. We will continue to monitor this situation and report to you accordingly.
Summing up, the overall situation appears bullish for the yellow metal in the short term – probably until the end of the month. Support levels have recently been tested and held, and a study of similar corrections in the recent past indicates that there appears to be at least a short-term time frame in which a further rally appears likely. Once the next local top is in we expect the decline to continue.
Silver
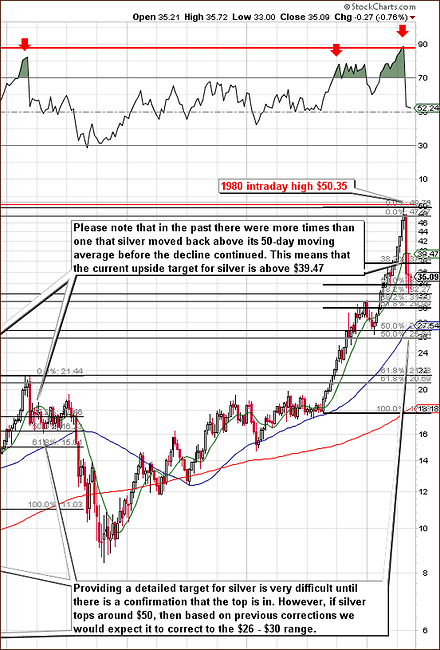
There really was not very much that happened this week concerning silver. Still, we decided to provide you with the above long-term chart once again to keep the short-term moves in proper perspective. On the above chart we can see (click on the above chart to enlarge it) that another attempt was made to move below the 50% Fibonacci retracement level but a small rally soon followed. It appears that in the past three weeks, we may have seen a triple local bottom.
The current upside target level for the white metal is $39.47 or higher. In other words if this level is reached but the dollar does not reach its bottom, then it might be a good idea to wait for the latter to bottom before exiting one’s long position in silver. The same can be said about gold and mining stocks. We will continue to watch this situation closely as it develops further.
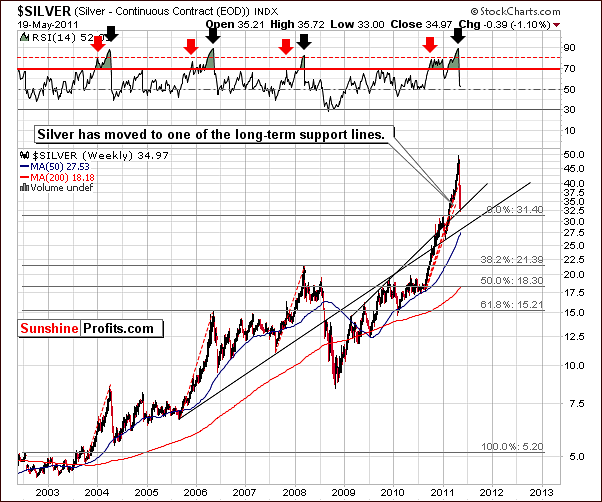
In this week’s very long-term chart, you can see that the long-term support line was touched this week and the decline paused, so at least a bounce is likely – so far the small rally that we’ve seen recently was barely visible from this perspective. The very long-term trends for silver should be considered in conjunction with information gathered from short-term charts. In addition, the long-term charts generally carry more weight than those from the short-term.
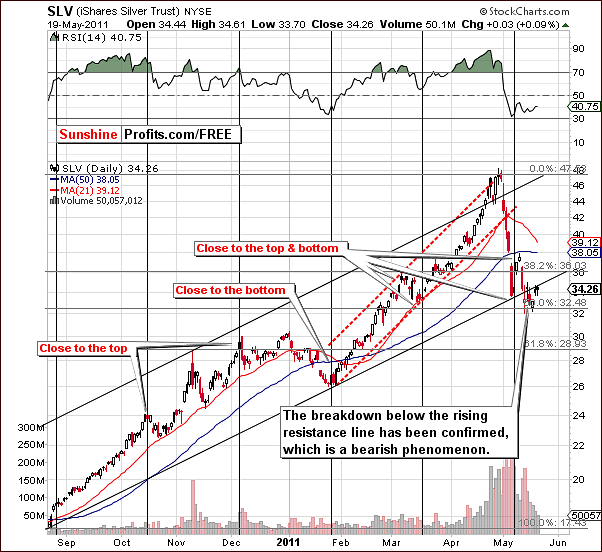
In the short-term chart this week, we see a verification of a breakdown below the short-term rising trend channel. Although this short-term chart in and of itself is somewhat bearish, the situation does not really appear to be (see other silver charts in this update for details). It does appear that the outlook for silver is somewhat less positive than that for gold but if the general stock market moves higher and gold follows, higher silver prices will likely be seen as well.
As we wrote last week, Silver Investors have been driven mostly by the bearish sentiment for the USD Index. Negative pressure is placed upon silver when the dollar rallies. If the USD Index declines once again, silver is likely to move to the upside. Target levels are slightly above the 50-day moving average and correspond to an SLV ETF price level of $39 or so.
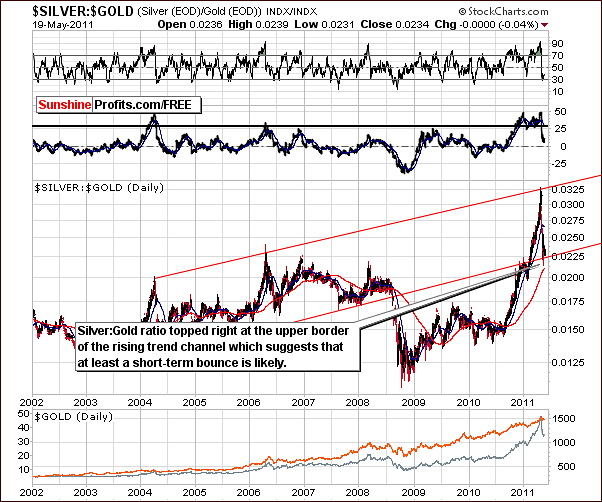
In the Silver:Gold Ratio chart this week, we continue to see the ratio right at a very strong support level. Based on this chart, it appears that some kind of correction rally is likely at this time for both gold and silver.
Summing up, it appears that silver is likely to move higher and it seems that this rally could begin soon. Much depends on what happens in the USD Index and the bias is bullish for the white metal in the short term.
Gold and Silver Mining Stocks
This week, there were no significant developments visible from the short-term perspective, so we decided to focus on the long term charts.
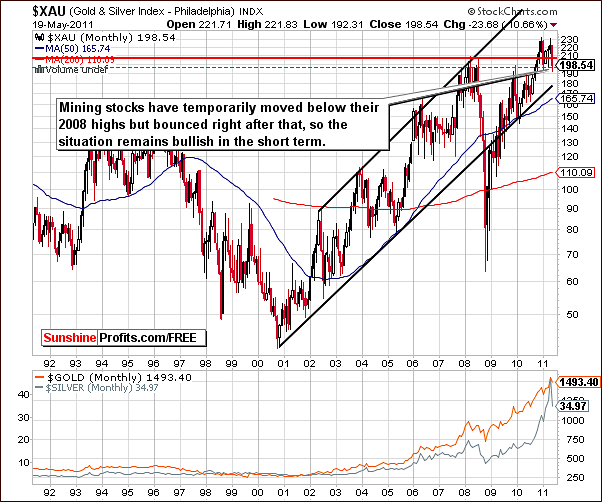
In the very long-term XAU Index chart this week, levels remained above the 2008 highs based on monthly closes. This is at least some bullish news despite the fact that overall, the gold and silver mining stocks have been sold off heavily this month.
Please note that we’ve seen a temporary move below the above-mentioned levels, but are once again above them.
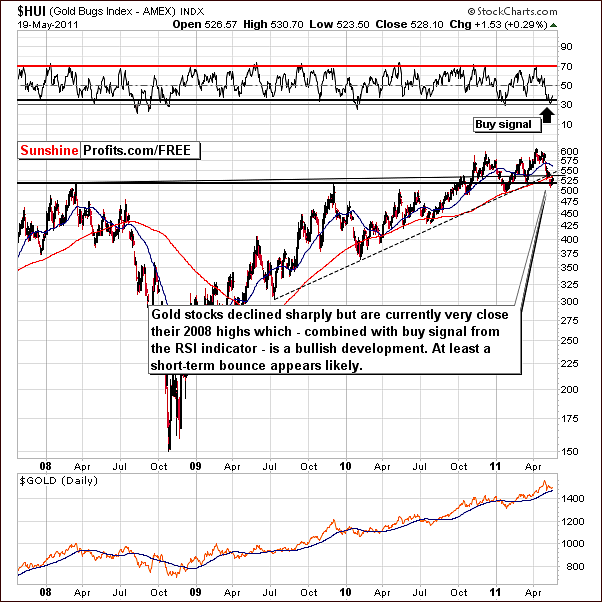
In the HUI Index chart this week, we also see some bullish signs. The RSI recently showed a buy signal and a small rally in the index followed. In the past, the subsequent rallies were considerably greater than what we’ve seen in the past few days and it appears to be room for an additional rally period.
Summing up, the situation for gold and silver mining stocks appears bullish from a short-term perspective. Support levels have been reached and a buy signal was recently flashed based upon RSI levels. It appears that a contra-trend rally has begun and seems likely to continue for the short term.
True Seasonal Tendencies
Last week’s Premium Update included a True Seasonals section and this appeared to generate a great deal of interest. For this reason we have included additional charts this week. On a side note, the True Seasonals tool does not only track metals’ and indices’ performance, but also features individual gold and silver stocks. Meanwhile, let’s take a look at the silver seasonality (+derivatives’ expiration effect) during this time of year.
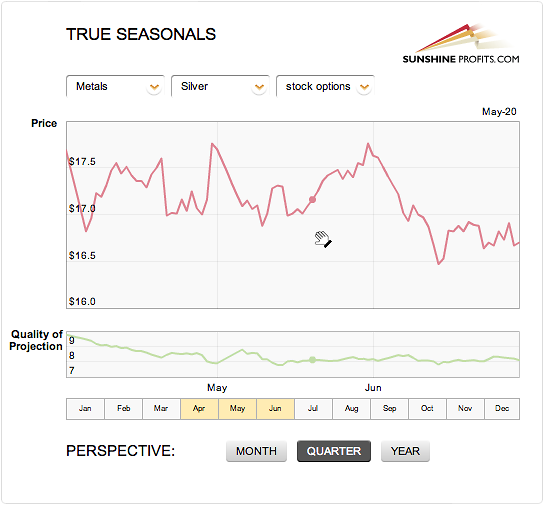
On the above chart, it appears that we are likely to see a rally. The above chart suggests are move to the early-May high, however this may not be the case this time. Please note that the pattern for May played out quite reliably so far – top at the beginning of the month and a double bottom.
Again, the local top may not be as high as the prior top but even if it is a bit lower, the situation still appears to be bullish.
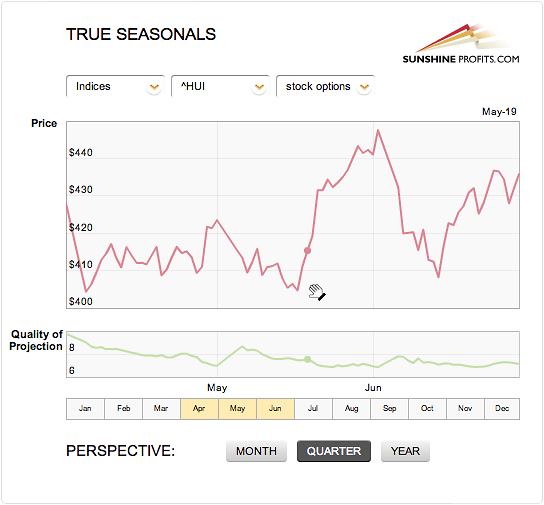
On the above HUI (gold stocks) seasonal chart, it appears that we are right before a considerable rally that would likely take place until the end of the month. Please note that this is very much in tune with what we inferred based on the analysis of the XAU and HUI charts in the previous section. It doesn’t seem that gold stocks will move to or above their previous highs (as seen on the above chart), but nonetheless a rally appears likely.
Summing up, the True Seasonals confirm points made earlier in this update – a short-term rally is likely. As noted earlier – in the Euro – USD Indices section – the move likely to end at the end of May or at the beginning of June.
Sunshine Profits Indicators
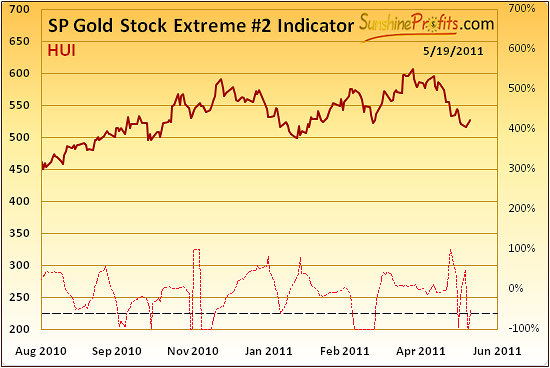
Our Gold Stock Extreme #2 Indicator is included in this week’s update once again. Last week it confirmed the short-term bullish points we had made and once again this week we have seen the dotted line in our chart crossed. At this juncture, it is once again a buy signal from a reliable Sunshine Profits Indicator chart.
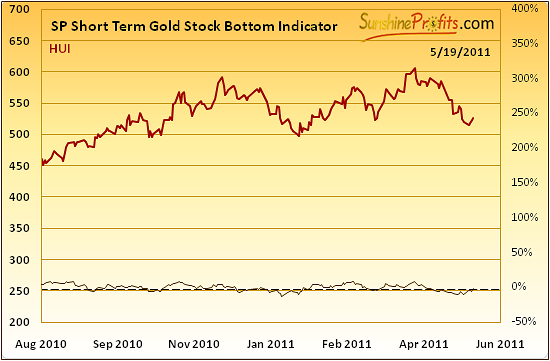
It appears that we have additional confirmation for the next likely move in HUI Index (and the rest of the previous metals sector). The Short Term Gold Stock Bottom Indicator flashed a buy signal yesterday, which proved to be a reliable factor many times in the past.
Letters from Subscribers
Let's begin with a general question about how stagflation would affect precious metals.
We believe that's a bullish background for the precious metals, as it was in the 70s. You might be interested in reading the reply to a similar question from a few years ago during the deflationary scare.
We've also received a question about why should one bother with a counter trend rally if the more important trend is down. Generally it's just a matter of one's preference. We have many Subscribers, who are happy to trade even daily upswings, so the information about a several-day/week rally is important to them. On the other hand, more long-term oriented Investors might simply ignore these short-term suggestions and focus on more long-term-oriented part of our analysis.
Let's move to another question, this time about silver.
I saw this article and wondered about the accuracy of the "56 time decline" of 86% on average since 1920. I feel silver is in a long-term bull market even if it is correcting. Any thoughts welcome.
Indicators Suggest Silver Headed for Single Digits
Silver at one-digit levels is highly unlikely in our view (we think that the probability of silver never going to single digits again - in terms of USD - is over 50%), although we consider the current correction a substantial one. The fundamentals are still favorable and these are the things that drive markets in the long run. We have examined the above-mentioned essay and found several things on which we will most likely elaborate in the following updates. For instance, the statistics that were mentioned often refer to the same rally (final part of the 70-80 bull market) and the evidence of us being in this stage of the rally are doubtful.
Major assumption in that analysis is that silver's momentum was extraordinary and that is something that should prove that we've seen the end of the current bull market. That is generally the case that the final stage of the bull market is very volatile, but that's not the only factor that could have contributed to the recent surge in volatility.
Available supply of silver is much smaller now than it was years ago and the structure of the demand side has changed as well - silver is now used widely due to its industrial applications, which means that if there's little left many firms will compete for the last bars of the metal. Finally - and that seems to be the most important case here - the pace at which information spreads (Internet, mobile devices) and how fast people can react to it (again, Internet and mobile devices) has improved exponentially. So, since people would be expected to take into account many factors (also the emotional ones - like previous price increases by themselves) much sooner than they did previously, much higher volatility in the short-term should also be expected.
Summary
At the beginning of the week, euro appeared to have broken below its support levels, but it finally turned out that this was nothing more than a verification of a breakout. As always, the situation may change in the following days, right now the trend is up for the Euro Index. Consequently the situation remains short-term bullish for euro and precious metals and bearish for the dollar.
The general stock market this week is completing a flag pattern and this will likely lead to higher prices for the short term. This is also positive news for precious metals and especially for gold.
Gold, silver and mining stocks are in a situation that is quite difficult. After careful analysis of many factors, it appears that the next short-term move will be to the upside. Target levels are $39.47 for silver and a $1530 for gold. The situation is somewhat cloudy with respect to mining stocks' targets.
Please keep in mind that sell or buy signals for gold, silver and mining stocks can appear not only in these markets but also in other markets, especially that the link between metals and currencies is quite strong at the moment. As always, we will continue to monitor the situation and report to you accordingly.
From a speculative point of view, it seems that gold is the preferred vehicle to profit on a short-term rally. We do still appear to be in a contra-trend rally however, which means we are not likely to see new highs. Contra-trend moves are more risky and therefore not advised for everyone. An eventual downturn seems quite likely but the short-term trend appears to be up. It seems that early June is the best estimate at this time for the downtrends to begin.
Our next Premium Update is scheduled for Friday, May 27, 2011.
This completes this week's Premium Update.
Thank you for using the Premium Service. Have a great weekend and profitable week!
Sincerely,
Przemyslaw Radomski

