This week we saw the precious yellow metal go from "Gold" to "Golder" with a nice rally, in contrast to the USD, which this week verified its breakdown. If you recall, we said this would happen in the previous Premium Update and this week the USD Index did not go back to its previous trend line and neither did the precious metals. I consider the breakout to have been verified by the fact that these sectors closed above (gold) and below (USD) their respective trend lines for at least 3 consecutive trading days.
Gold and silver have been on a tear, moving higher without looking back, and have now reached the levels of their previous local tops. The USD Index has been very weak in the last few days, but is now looking oversold. Since breakouts have been verified, the next directional trade for gold will most likely be up. However, since the recent rally has been sizable, especially in the mining stocks, you may want to wait for a brief correction before opening new long positions. A correction would also serve as an opportunity to close any remaining short positions you may have in precious metals.
Let's take a look at this week's charts for more details.
USD Index
The big news this week was the USD as the dollar remained under assault Friday with the pound and the euro reaching levels at or near their highs for the year. Without significant data releases or other market moving developments in the U.S. to throw the dollar a lifeline, the dollar sell off unleashed on Thursday continued to take its toll on Friday and the dollar fell to its lowest level in five months.
The USD finally verified its breakdown below its previous trend line, and is now trading below its 200-day moving average. The last time the USD Index traded below its 200-day moving average was in August 2008. Charts are courtesy of stockcharts.com.
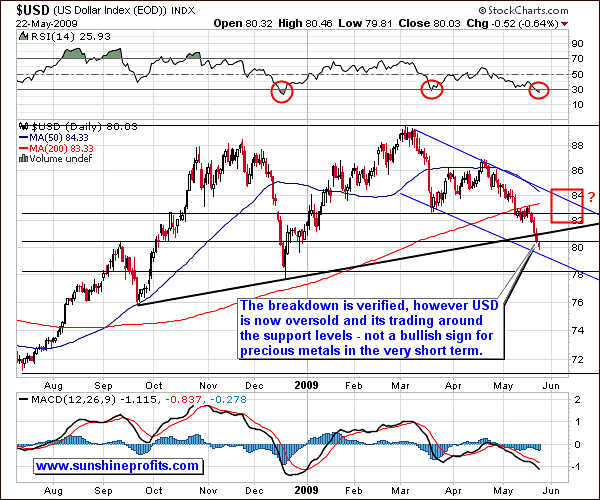
The first thing that I want to bring to your attention to is the value of the RSI indicator, a technical momentum tool that compares the magnitude of recent gains to recent losses. An asset is considered to be overbought once the Relative Strength Index approaches the 70 level, meaning it is getting overvalued and is a likely candidate for a pullback. Likewise, if the RSI approaches 30, we take that as an indication that the asst may be getting oversold and is likely to rise. You can see this clearly in this chart. I have marked these time/value points for you with red ellipses and you can see the RSI dipping to the 30-level each time. In the past these similar points have had similar outcomes and have been rather reliable in determining local bottoms in recent months. So, we may see higher values of the USD Index in the very near future.
Additionally, several other techniques provide us with support levels. The lower border of the declining medium-term trend channel is one of the support levels. The Fibonacci 50% retracement level is another. Last, but definitely not the least, is the multi-year resistance/support 80 level. From a psychological point of view this is a very important level as the USD has bounced near 80 many times in the past.
The analysis of the USD Index from the short-term perspective provides us with an additional support level. The USD has just closed below the short-term declining trend channel, but since this took place only this Friday, it has not yet been verified from a technical point of view.
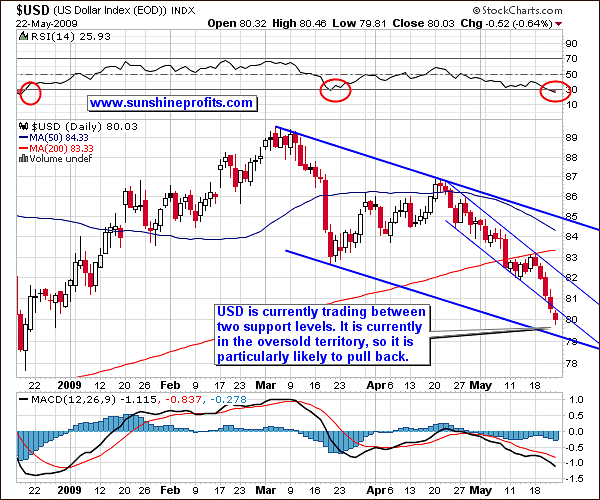
To sum up, it will not surprise me to see the USD bounce from here, as it is it oversold, and is now trading near several support levels. Another intra-day low and a sharp bounce seem likely at this point.
Gold

Gold has reached its previous high, and this is where it might want to take a pause. When explaining the RSI indicator earlier, I said that if the RSI indicator reaches the 70 level, it means that an asset is getting ready for a pull back. If you take a look at the gold chart, you clearly see that the RSI is pointing exactly to that. It is at a level that previously meant a brief pullback. Last time gold moved to this level, it rose quickly from much lower levels, and should the symmetry hold, we might see a pullback below 88 level in the GLD, which would correspond to the $900 level in gold.
Since gold had a robust move this week, if we do get a correction, it will most likely NOT go to the resistance line I proposed in the last issue of Premium Update. That resistance line was the most probable target for a correction last week, but things have this week changed, and from today's point of view, the chance is much lower for an almost $80 correction in gold.
Another noteworthy development in the gold market is the fact that gold has also broken out of the upper border of its trend channel. This is important, as it demonstrates and confirms its strength. The important thing to watch in the upcoming weeks is how gold will react to movements of the USD market. If the USD rallies and gold holds up relatively well, it will mean that we will have even higher prices of gold in the medium term. Specifically, if the USD Index moves higher and tests 82 (or even the 84 level), and gold still manages to stay at, or above, the $945 level ($93 in GLD), trading sideways, we will have a very promising entry point for going long gold. (I usually don't like the idea of entering a speculative long position after a huge rally has already taken place and with several factors pointing to the opposite direction. As I said in the last week's Update, sometimes the best trade is no trade.)
Also, should the dollar index move to the 84 level, and gold stays above the lower border of the trend channel (currently at about $915, $90 in GLD), it will also serve as an important confirmation that gold is going higher in the medium term.
The picture of the silver market is once again in tune with that of gold's. However, as mentioned in the previous updates, silver is more vulnerable to a sell-off in the general stock market, as the market perceives silver also as an industrial commodity. In reality this makes for a strange situation. Like gold, silver is in finite supply. There is only so much of it under the ground. It's not like paper money that can be printed like crazy. But there is a big difference between silver and gold. Silver is both a precious metal and an inexpensive (most likely not for long) industrial commodity. Unlike gold, which is produced but is not used up (all the gold ever mined is basically still around in one form or another) silver is consumed and devoured by the medical, industrial, solar and electrical industries faster than it can be replaced. The silver that has been used up is gone forever and cannot be replaced. Logically that would seem to mean that in the future silver could have a large run up as supplies dry up.
General stock market
Stocks slumped at the close of Friday's session, ending the week little changed as American investors went into the Memorial Day holiday weekend with nagging concerns about the economy. The S&P 500 index slipped 0.15% to 887 but was up 0.5% for the week.
I will look at the general stock market through the weekly chart of the SPY ETF.
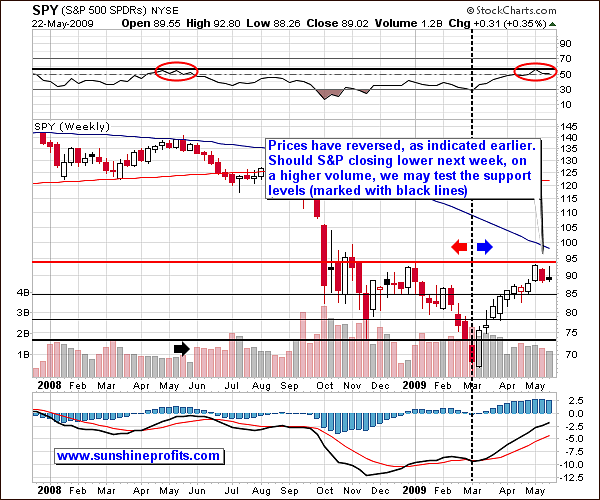
Clearly, the move in the U.S. dollar has not been the only important news this week. What looked like simple side-ways trading from a daily perspective becomes more important once we zoom out to get a larger picture. As you may see in the above chart, the broad market has declined since we wrote about this being the likely scenario, but the decline has not been as dramatic as our support lines might suggest. So far, the situation is similar to the one a year ago. Please take a look at the way the RSI indicator shaped almost exactly a year ago, and compare it to how it is shaped now--.almost identical.
The similarity does not end there. In 2008, we had a local low at the beginning of March and reached a top in May. The current rally began in the beginning of March 2009 and it seems that a high was reached two weeks ago. Please note that both rallies took place on declining volume. The final confirmation that I've marked with a black arrow was a week during which the SPY fell on a much higher volume. Should this take place this week, we may indeed move lower from this point. It's a tough call to make whether or not this is the beginning of a new, powerful downturn, but at the moment, we cannot rule this possibility out completely.
For us, precious metals investors and speculators, the important thing to consider is how such a plunge would affect prices of precious metals and their corresponding equities. For more details we will need to analyze the appropriate rows in the correlations table.
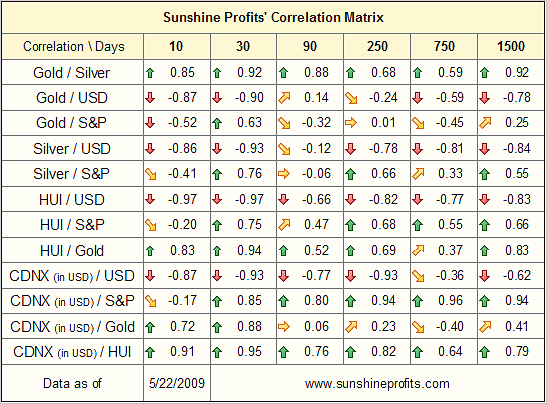
As you can see, gold (and also silver) have had a high correlation with the S&P over the previous 30 trading days moving in the same direction, but this has changed over the past two weeks. The column with the very recent data (meaning the previous 10 trading days) has been unusual and we find the two assets moving in opposite directions. This is especially unusual for silver.
What is really remarkable is that the gold stocks, as measured on the HUI Index, have been negatively correlated with the general stock market. This has definitely not been the prevailing trend over the past several years. Should this phenomenon hold for several more days (so that it significantly influences the 30-day column), we can assume that this phenomenon is not just "noise", but is indeed a significant development in the precious metals market. It will serve as a strong sign that mining stocks will be moving higher.
Mining Stocks
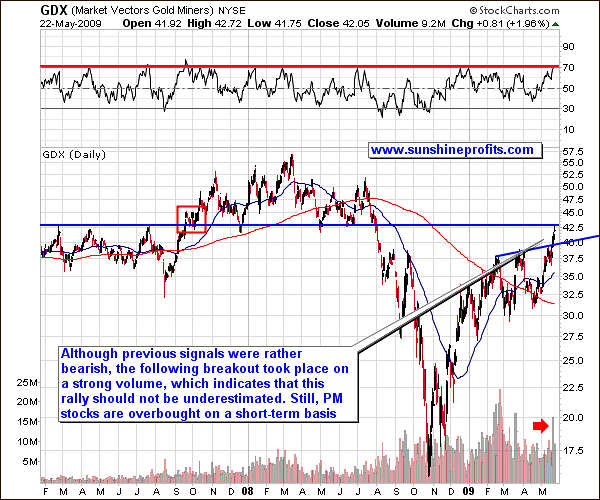
The RSI indicator also suggests that a breather is needed here. A correction, possibly not a very deep one, is the most probable outcome in the next several days or weeks. If the previous support level serves as a resistance (in other words the GDX does not fall below $40), we will have a very good opportunity to enter speculative long positions. This would correspond to a similar breakout/testing situation in 2007 that I marked for your benefit with a red rectangle.
Summary
From a long-term perspective the situation on the whole in the precious metals sector still looks favorable. We have rallied substantially during the past few weeks and although a brief correction is possible, this possibility does not justify moving large capital out of this sector. A week or two of a correction are insignificant when you look at things from a multi-year perspective.
As far as speculation is concerned, the timing could have been better for the May 19th Premium Update I had sent out recommending to short precious metal stocks. It is always easy to make these kinds of judgments with the benefit of 20/20 hindsight. The odds were favoring a temporary sell-off since it seemed that PM stocks have gone up too far, too fast, and history tends to repeat itself most of the time. However, this does not always happen. This is why it's called speculation and not investment, and why I recommended using only a small amount of speculative capital. On the other hand, should this breakout prove to be a fake-out, PM stocks will most likely drop more than the metals, and the short position will give us a nice, protective hedge.
Moreover, this is why I always discuss diversification in strategies. Here, diversification means decreasing risk in terms of reducing the overall volatility of the portfolio. Generally, the speculative part of my holdings is used to short the market and to bet on rising prices as well, so the end result, to a large extent, is independent from the direction the markets are moving. This may seem like a waste of time during periods when long-term holdings perform much better than the speculative picks. But don't let that mislead you. The fact that returns on speculative transactions are often uncorrelated with the returns on your long-term holdings will make your portfolio less volatile during bigger downswings in the precious metals market. You will most likely appreciate this phenomenon during the next serious correction in gold, silver and corresponding equities. Please note that the long-term part of our capital was down in 2008, just like virtually everyone else's, but at the same time the speculative portion grew.
This completes this week's Premium Update.
Thank you for using the Premium service. Have a great weekend!
Sincerely,
Przemyslaw Radomski


